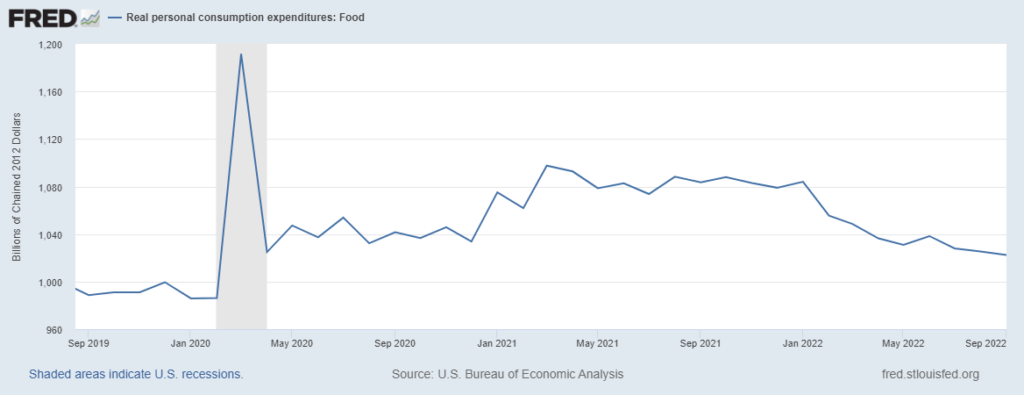
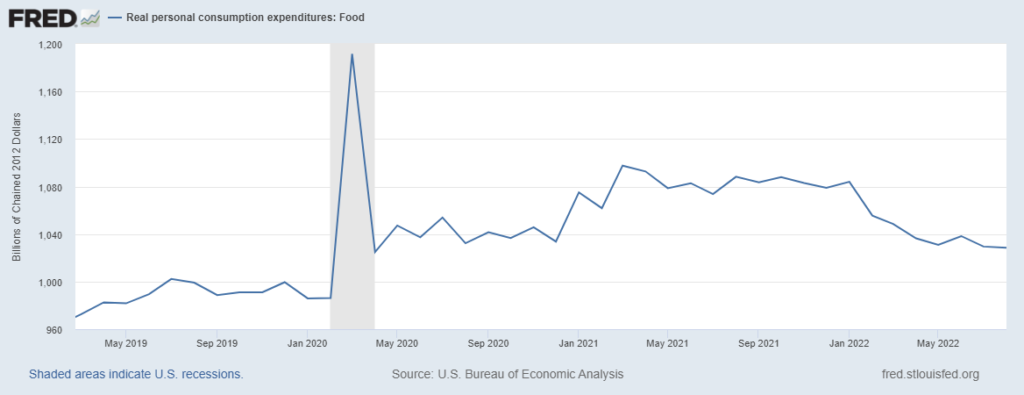
[Update Below] According to the Federal Reserve, Americans continue to purchase food-at-home well above pre-pandemic patterns. In August 2019 US consumers expended $999.1 billion on groceries and related. This August we spent $1028.5 billion. (These are each chained 2012 dollars, see chart below). For further comparison, in August 2012 we spent $845.7 billion. The US population increased about seven percent over these ten years.
This higher demand has persisted even after we returned to restaurants and other food-away-from-home services in Spring 2021. In August 2019 Americans spent $65,191 million at food services and drinking places. This August we spent $86,760 million (not inflation adjusted, here you can see comparable grocery retail sales). Our personal savings rate in August 2022 was less than half that in August 2019.
Another angle on food consumption is offered by the research and consulting firm IRI which finds current cash-basis demand in early October 2022 to be at least seven percent above October 2021 — thirteen percent higher in the “general food” category. As a result, after several weeks of improved demand-supply equilibrium, stock-outs are, again, beginning to proliferate and deepen.
There has been a softening of inflation-adjusted grocery expenditures since January (again, see the chart below). This is probably the result of historically very high food inflation plus reduced cash reserves. But especially given the persistent disincentive of inflation, for food demand to still be at least three percent above pre-pandemic trend has material implications for production and distribution capacity — and therefore flow.
In June I offered the following:
I hypothesize that between May and September we will see food-at-home real consumption gradually decline by another seven to ten percent and then flatten or incrementally increase. I hypothesize that durable goods and services will begin to show slopes similar to 2022 food consumption. I also hypothesize a more rapid rate-of-change than that for food between last November and April.
With two months of data left to ingest, we have barely seen a one-percent decline in food-at-home consumption. Durable goods spending has been stable. Real services spending has continued to incrementally increase. Given my perception of actual need and inflationary disincentives interacting with economic and geo-political risk, I expected much more consumer restraint to emerge by now. If anything the opposite is true (more and more).
From May 2021 until August 2022 US wage growth was not only consistently higher but the rate of growth was increasing too. Last month’s wages (September) were still growing, but at a slightly slower rate. So — maybe — with more nominal cash flow many American consumers have chosen to avail themselves of “retail therapy” and comfort food to manage accumulating stress. This is not a satisfactory explanation, but it is the best I have right now.
+++
October 29 Update: Based on September’s real Personal Consumption Expenditures (see chart below), since the end of April constant dollar (inflation adjusted) expenditures on food-at-home have declined from $1,036.4 billion to $1,022.4 billion — or 1.4 percent. Real durable goods spending in September was basically flat. Expenditures on services, even in the most discretionary categories, seem very stubborn — much more stubborn than I expected.