Since November we have monitored five indicators of Supply Chain Resilience. These have been intended to supplement more comprehensive measures such as the Global Supply Chain Pressure Index (GSCPI) and the CSCMP Logistics Manager’s Index. These and similar indices remain important. (Here are the vital sign updates for December, January, February, and March.)
It is now time for some seasonal updates.
Since Thanksgiving I have focused on southern hemisphere agricultural production; starting now I will shift to northern hemisphere agricultural production. Instead of diesel demand and production, I will shift to flows and prices of natural gas. I will continue to focus on China’s export volumes and prices. I will continue to look at what is happening with North American capacity to produce and transport electricity. I will replace covid consumption of hospitalization with US Personal Consumption Expenditures (despite the increasing risk of pandemics).
As usual, I will try to discern the dynamics of pull and push, especially of any friction emerging between pull and push. There is a bias toward fulfilling US demand. There is particular concern for food and energy flows.
North American Agricultural Production: US winter wheat has been seriously stressed by drought. Planting corn is being delayed by snow and wet weather. Soybean planting is just barely getting underway in the core US soybean producing regions. (More and more) Winter still reigns over most of Canada. USDA projects that US acres-under-cultivation will increase in 2023 (more). We will see what El Nino may mean for the growing season and yields.
Global Natural Gas Demand and Supply: The northern hemisphere’s “heating season” concluded on March 31. This season featured low demand due to a comparatively mild winter. According to the Energy Information Administration, “Net withdrawals of natural gas from underground storage facilities totaled 1,707 billion cubic feet (Bcf) during the 2022–23 heating season (November–March)—the lowest on record since the 2015–16 heating season. Working natural gas in underground storage facilities in the Lower 48 states totaled 1,830 Bcf as of March 31, 2023, according to the Weekly Natural Gas Storage Report (WNGSR), exceeding the five-year average (2018–22) by 294 Bcf (19%), after entering the heating season at a 110 Bcf (3%) deficit to the five-year average.” (More) Due to both mild weather and aggressive purchases, EU natural gas inventory levels are now more than double (56 percent) of end of March 2022 stocks-available (26 percent) (more). Natural gas prices have trended sharply lower since mid-2022 (here and here).
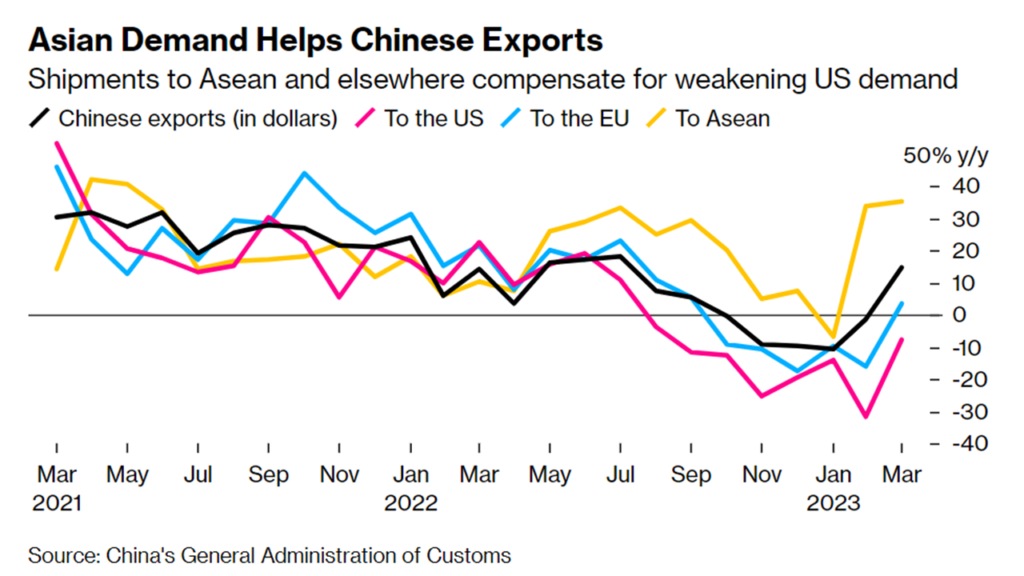
China Export Volumes and Value: Earlier this week Reuters reported, “China’s exports unexpectedly surged in March, with officials flagging rising demand for electric vehicles, but analysts cautioned the improvement partly reflects suppliers catching up with unfulfilled orders after last year’s COVID-19 disruptions.” (More) For the six months before March exports have consistently fallen from very high levels through most of 2022. Bloomberg highlights that this increased (temporary?) push reflects much more pull from East Asia than from the US or EU. Please see chart below.
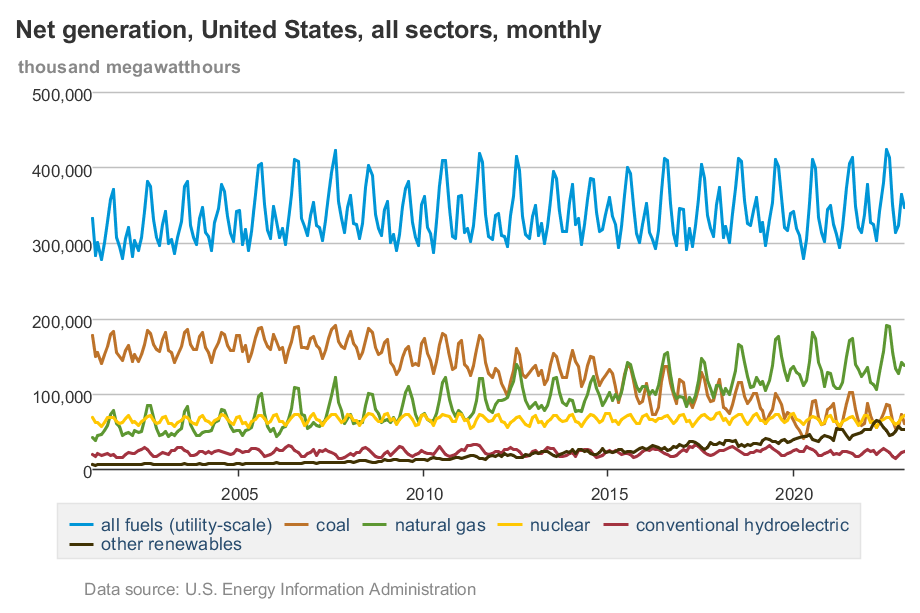
North American Grid Capacity: Increasing demand for electricity is prompting construction of additional generating capacity. According to the Energy Information Administration, renewables will provide the highest proportion of new capacity. Current capacity (see second chart below) remains mostly dependent on fossil fuels. Capacity to generate does not necessarily translate into capacity to deliver. According to UtilityDive, “Since the last wave of major U.S. transmission development about 10 years ago, the transmission system is running out of spare capacity… The growing queues of generators seeking to connect to the grid are a symptom of the maxed out transmission system… Major power system failures and instances of congestion are likely to increase without transmission expansion.” (More and more)
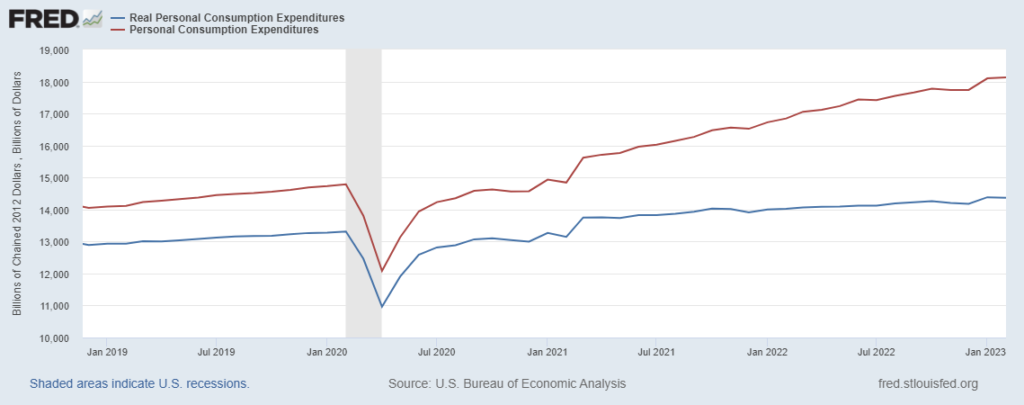
US Personal Consumption Expenditures: US consumers have continued to spend. Friday’s retail sales report found a slight decline in spending between February and March, but year-over-year figures remain robust. For example, retail sales of Food-At-Home were eight percent higher than February (not inflation-adjusted). First quarter sales at food and drinking places (Food-Away-From-Home) were 17.3 percent above first quarter 2022. There is still cause to anticipate some softening of March Personal Consumption Expenditures (please see third chart below). SNAP benefits have been cut and wage growth has slowed, plus some speculate the mid-March banking crisis might have suppressed expenditures. It will be another two weeks before we see the March PCE.
Healthy pull is, so far, prompting improved push. There is not much excess capacity. But pull is mostly being fulfilled. The problems emerge where there is real need, but insufficient pull (more and more and more). There is also reason to wonder if supply capacity can keep up with the increasing rate of demand capacity growth.