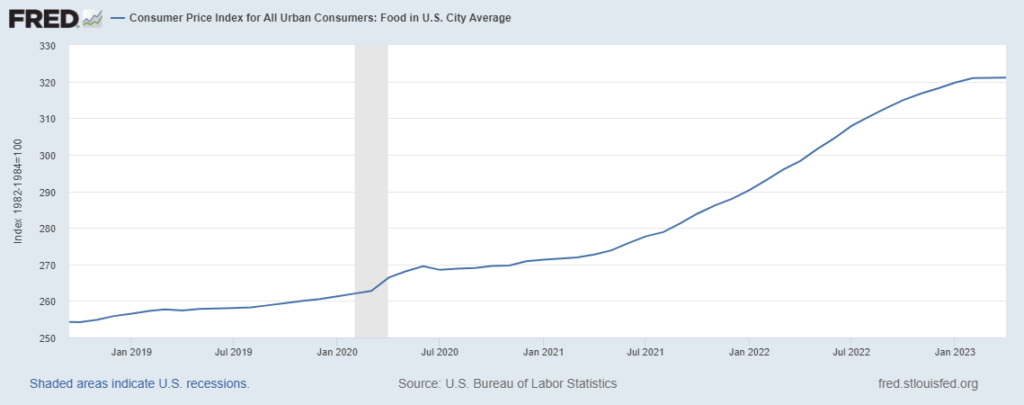
The April Consumer Price Index shows another month of stable to lower food-at-home prices (see chart below). According to the Bureau of Labor Statistics:
The food index was unchanged in April. The food at home index fell 0.2 percent over the month, following a 0.3-percent decrease in March. Four of the six major grocery store food group indexes decreased over the month. The index for fruits and vegetables decreased 0.5 percent in April, and the index for meats, poultry, fish, and eggs declined 0.3 percent over the month. The dairy and related products index decreased 0.7 percent in April as the milk index fell 2.0 percent, the largest decline in that index since February 2015. The nonalcoholic beverages index declined 0.1 percent over the month. In contrast, the index for other food at home rose 0.2 percent in April, following a 0.4-percent increase the previous month. The cereals and bakery products index increased 0.2 percent over the month, after advancing 0.6 percent in March… The food at home index rose 7.1 percent over the last 12 months. The index for cereals and bakery products rose 12.4 percent over the 12 months ending in April. The remaining major grocery store food groups posted increases ranging from 2.0 percent (fruits and vegetables) to 10.4 percent (other food at home).
This is further evidence of general equilibrium of demand and supply in the grocery sector. There are always some stock-outs. There may be somewhat more now as supply adapts to late-pandemic and post-pandemic demand patterns. But for the vast majority of SKUs in the vast majority of places, where there is effectual demand there is also supply.