Month: May 2023

Concatenated Concentrations

In today’s Financial Times, Rana Foroohar outlines the supply chain challenges involved in “too much power in too few hands.”

Unfortunately the FT has a fierce paywall, so here’s what I perceive to be the crucial paragraph:

Chinese mercantilism, European and US corporate price gouging, American Big Tech and Too Big To Fail banks are really all disparate parts of one problem — too much concentration of power in one place. This leads to market fragility, less innovation (which tends to come from smaller companies and more, rather than less, competition), security concerns and defensiveness on the part of states that worry they could be cut off from crucial supplies.

I agree with Ms. Foroohar’s assessment, admire her concise argument, and am even prepared to embrace her recommendations.

She and I may be less well-aligned on causes and corrections (this requires some reading between the lines). I hear Ms. Foroohar emphasizing human intention in creating these increasingly concentrated connections. In contrast, I perceive this sort of clustering, cascading, and intensification as innate to high volume, high velocity networks. Human intention less often drives concentration risk than is just along for the ride. Rather than masterful creators, we are more typically unindicted co-conspirators.

Where human intention and creativity can be quite influential is much more in the mindful, proactive, systematic, anticipatory mitigation of concentration risks. This is uncommon.
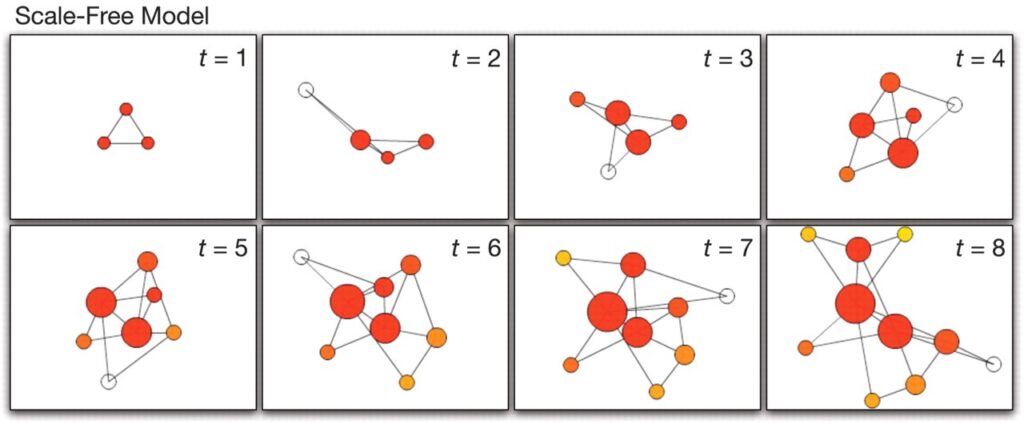
Scale Free Networks from Science (2009)
More as normal?

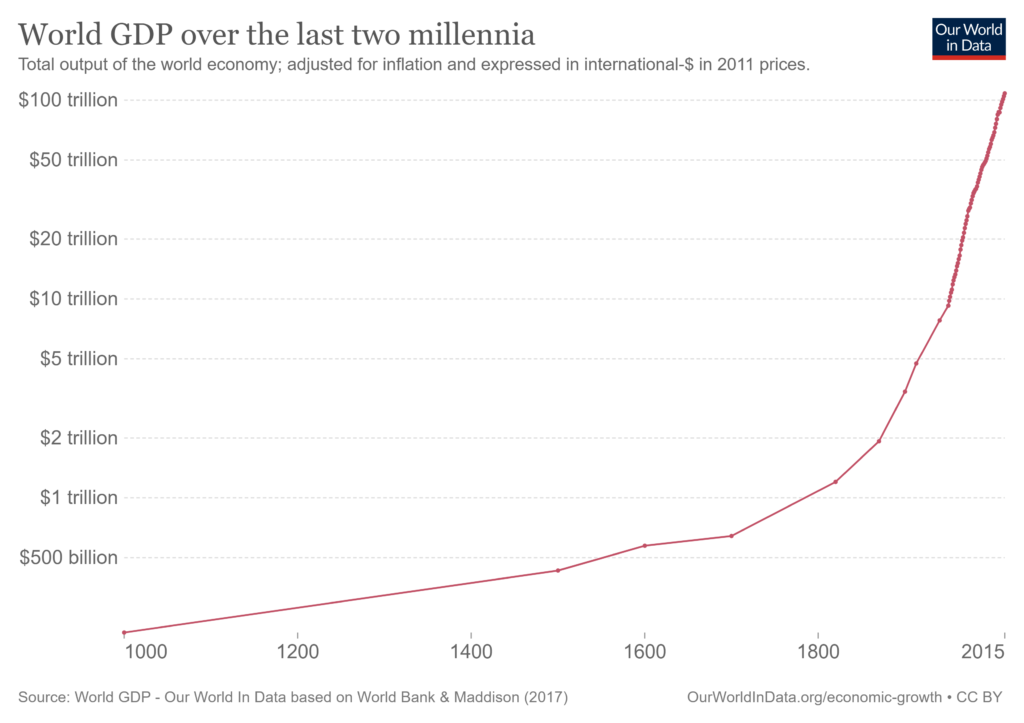
The May 1 post on freight flows includes, “More has been normal — not always year-over-year, but consistently decade-over-decade.” Not for everyone, not everywhere, but by the early 18th Century the experience of more and more was widening and accelerating. Please see chart below. Since the mid 20th Century our planet’s economic output has recorded exponential rates-of-change.

Given the outcome of three-plus centuries, the expectation of more is not unreasonable. Especially since 1950, failure to lean-into anticipation of more would have been delusional. (Despite early, earnest warnings of an eventual slow-down.) The growth of effectual demand and real output has been persistent. I perceive it has also been precipitous (meaning steep, sudden, and potentially dangerous).

This rate-of-change has, of course, prompted profound consequences: economic, social, cultural, ecological, and from almost any other angle. Since 1950 the planet’s population has increased from 2.5 billion to more than 7.9 billion while the proportion “living in poverty” has declined. Just since 1990 those living in extreme poverty has declined from over one-third to less than one-tenth of total population. Much more has been much better for millions.

We are also increasingly aware of the trade-offs — and potential limits — of more and more (here and here and here).

Explosive demand has generated revolutionary changes in scope, scale, and methods of supply. Given population growth and even faster growth in demand, change has been necessary. When changes are effective, they have usually been profitable. In the 1980s Walmart demonstrated how to deliver more for less. Walmart, Amazon, and many others continue to compete by delivering even more for relatively less. Supply chain design and execution is a source of crucial competitive advantage.

Recognizing the trade-offs and limits of living on our current precipice, there are ambitious efforts underway to better sustain the ability to deliver more for less… including fewer long-term climate impacts (here and here and here). So far, supply chain sustainability and resilience seem to be compatible traveling companions. (It is, however, complicated.)

But in some places more is, arguably, no longer needed. According to Reuters, “Last year Italy recorded more than 12 deaths for every seven births and the resident population fell by 179,000 to 58.85 million… Italy could lose almost a fifth of its residents, with the population set to decline, under a baseline scenario, to 54.2 million in 2050 and 47.7 million in 2070.” The Japan Times reports, “Japan’s population shrank by 556,000 in 2022 from a year earlier to 124.9 million, marking the 12th straight year of decrease.” China’s demand will increase as per capita wealth increases. But in 2022 the population of China began what is expected to be a long-term decline (more). In most of the world’s wealthiest places, population growth is slowing or reversing.

Where and when population declines, demand for volume tends to follow. But there is evidence — already observed in Italy and Japan — that as volume becomes less exacting, velocity may become more valuable. Speed — both fast and, when appropriate, slow — becomes a key competitive differentiator. So does specific direction, both in terms of time and place and/or personal preferences and perceived value. For many consumers, quantity advantages (including related volume pricing) defer to aspects of quality… with profound implications for the production, distribution, and consumption of goods and services.

Supply exceeds demand?

Last year Adam Shapiro at the Federal Reserve Bank of San Francisco deployed a method for measuring the comparative contributions of demand or supply to the PCE inflation rate. You can read how he does this with an Economic Letter published in June 2022.

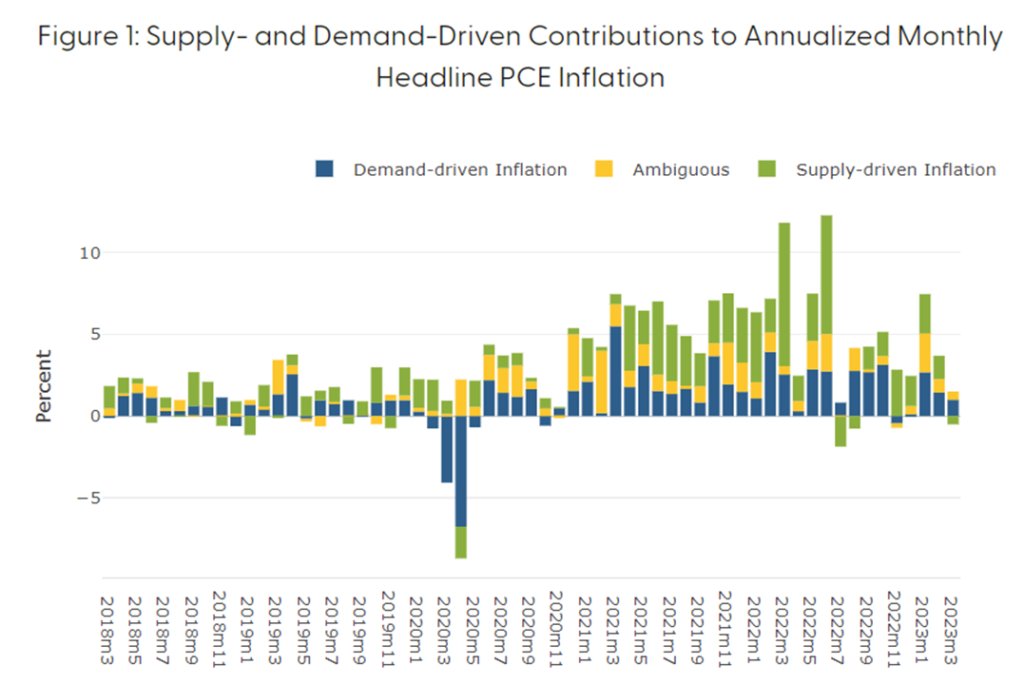
Monthly results since March 2018 are available at a FRBSF research webpage. Four angles on the comparative contribution are offered. Below is Supply- and Demand-Driven Contributions to Annualized Monthly Headline PCE Inflation through March 2023.

Dr. Shapiro seeks to “quantify the degree to which either demand or supply is driving inflation in a current month.” He further explains:

The series show expected time-series patterns. The demand-driven contribution tends to decline during recessions, while the supply-driven contribution tends to follow food and energy prices. Monetary policy tightening acts to reduce the demand-driven contribution of inflation. Oil-supply shocks act to increase the supply driven contribution, but decrease the demand-driven contribution of inflation. The decompositions can be used to test theory or by policymakers and practitioners to track inflation drivers in real time.

I am less concerned about inflation and more concerned about the equilibrium of demand and supply and, more specifically, the efficacy of push to fulfill effectual pull. Further, as regular readers know, I am especially interested in the dynamics of food, fuel, and freight under duress. I perceive Dr. Shapiro’s outputs can be helpful indicators of this (dis)equilibrium.

So, what I read in the chart below is that the shorter the bar, the better the overall balance between demand and supply. For me the credibility of Dr. Shapiro’s differentiation of demand or supply contributions is reinforced by the findings for the first half of 2020. We know that overall demand dried up. The disproportionate contributions of supply to 2022’s PCE inflation rate also resonate with my felt experience of consequences related to labor, raw materials, parts, and other production problems.

What I also “see” is how persistently higher — and only partially fulfilled — demand in 2021 caused increasing “congestion” that prompted profound volatility and disequilibrium across most of the first half of 2022. (I imagine that “caused” and “prompted” may be fighting words for some.)

Appropriate or not, this exegesis views the results since January 2023 as demonstrating a consistent improvement in the balance between demand and supply and, with the March results, the emergence of a slight (0.51 percent) overall excess supply.

What do you see?

Falling freight flows

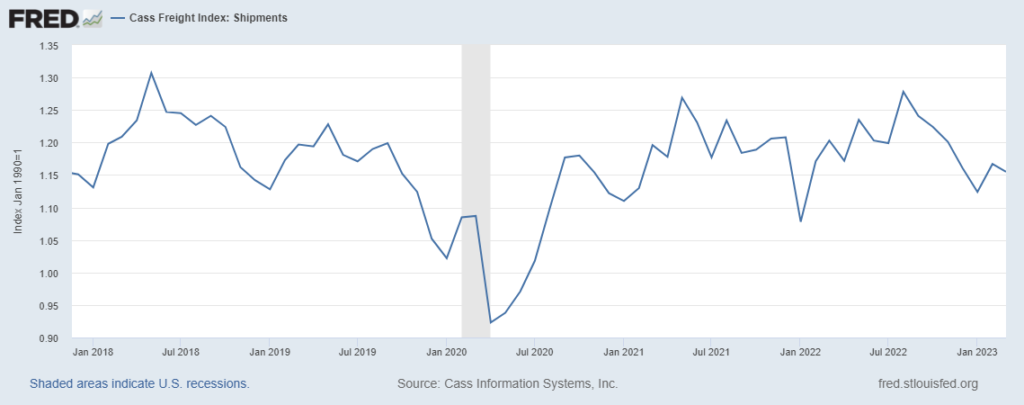
Last week UPS “announced first-quarter 2023 consolidated revenues of $22.9 billion, a 6.0% decrease from the first quarter of 2022. Consolidated operating profit was $2.5 billion, down 21.8% compared to the first quarter of 2022, and down 22.8% on an adjusted basis. Diluted earnings per share were $2.19 for the quarter; adjusted diluted earnings per share of $2.20 were 27.9% below the same period in 2022.” During a teleconference with financial analysts, Brian Newman, the CFO, explained, “In the first quarter, we expected average daily volume to decline between 3% and 4%. For the quarter, average daily volume was down 5.4% year-over-year, primarily because volume in March moved lower than we expected.” This is consistent with other freight market measures (for example, see first chart below).

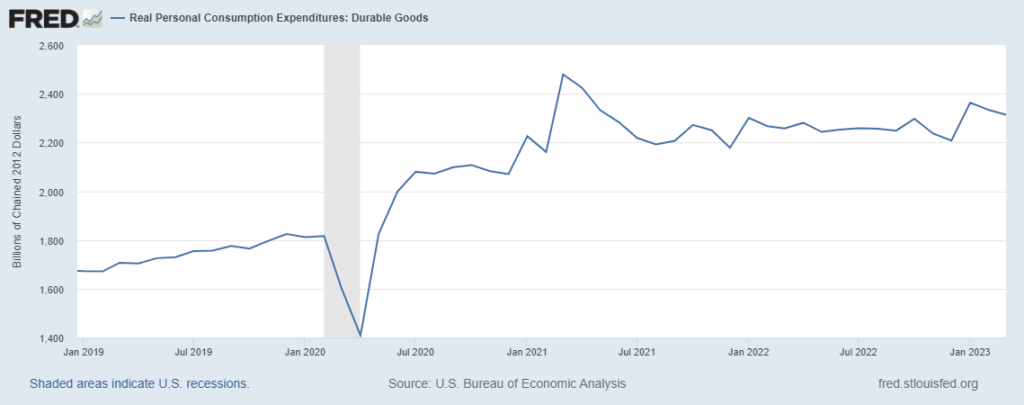
Freight demand is down in the United States and in most of the world (here and here). Less pull prompts less push. Demand (even for durable goods, see third chart below) remains considerably higher than pre-pandemic patterns. But three consistent months of declines in durable goods purchases — from high levels in the context of purposeful demand destruction via North American and European monetary policy — does not support prospects of a swift bounce-back. In terms of future flows, last week the UPS CFO noted, “The biggest change in terms of the base case versus downside is the volume. We were looking at volumes of down one percent in the base case, and now we’ve pivoted to the downside of down three percent. “

On Friday FreightWaves headlined a “trucking bloodbath.” According to this report:

America’s $875 billion trucking industry is struggling. The number of authorized interstate trucking fleets in the U.S. declined by nearly 9,000 in the first quarter of 2023… Folks throughout freight — from CEOs to truck drivers to dispatchers — are raising red flags about a downturn that could go in the history books. J.B. Hunt President Shelley Simpson wrote in a LinkedIn post recently that the current conditions remind her of 2009, which was the longest and most brutal freight recession of the 21st century.

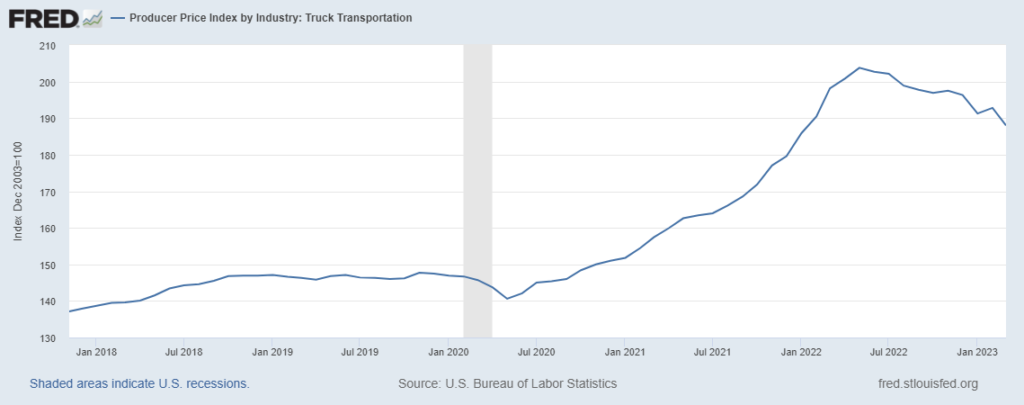
Year-Over-Year spot rates reinforce the sense of dread. Flat bed rates are down nearly one-fifth. Both van and reefer spot rates are down more than one-quarter. (More and more.)

But what seems like a bloodbath to some is a process of “normalization” for others. Two weeks ago J.B. Hunt also hosted an earnings call. The freight firm’s President pronounced a “freight recession”. The executive team assiduously avoided offering any formal forward guidance. But CEO John Roberts clearly does not feel trapped in a movie by Sam Peckinpah or Quentin Tarantino:

Well, I think the real question is the timing… it’s not really a question of if the freight demand will come back to normal. It’s just really a question of when… And so, if we look at where we are right now, and we think, oh well, maybe this time we didn’t quite get that right. That’s going to be part of the reality that we live in. And because we have the experience and because the folks that are around this table have made mistakes and made good decisions, I think we’re really just questioning how we — how we time our reentry into a more normalized system… Those things are teaching us that we’ve got to be a little bit more fluid… while we get to that other side which we know is not a question of if it will present itself but when. So we just have to be patient and careful and thoughtful.

Global and US freight markets have been anything-but-normal for at least three pandemic-punctuated years. A prior year (2019) featured an accelerating US-China trade war that had already skewed pattern expectations. John Kemp at Reuters has put together a chart book that highlights the challenges of accurately perceiving reality or even conceiving what a normal freight market might mean anymore. (Please see Yossi Sheffi’s The New (AB)NORMAL.) The same data that looks awful month-over-month can look fine year-over-year and, sometimes, fantastic over five years. Perhaps paradoxical is the new normal.

The global economy is undergoing significant shifts in terms-of-trade, cost-of-credit, energy flows, demand patterns, sourcing behavior, inflation, and much more. Fundamental structural changes are likely. The war in Ukraine is skewing agricultural, energy, and many freight markets. The war’s global impact will almost certainly loom larger in 2023 than during the war’s first year. The prospect of war(s) in East Asia is a veritable crash of gray rhinos grazing entirely too close. The extreme effects of climate-related shocks accumulate as systemic stresses reflected in mass human migration, political turmoil, economic uncertainty, and immediate human suffering. We should now better recognize pandemic probabilities. Combine these risk factors with an increasing proclivity for political self-subversion and normal seems rather elusive.

Freight movements are the most obvious expressions of supply chain flow. Current US and global freight capacity is robust — potentially even a bit excessive. Near-term (through September) pull prospects are more uncertain than usual. Credible arguments can be set-out for either increased or diminished freight demand over the next few months. Since widespread use of steamships and railways, the behavior of high volume, high velocity freight flows have usually increased (here and here). More has been normal — not always year-over-year, but consistently decade-over-decade. Given human aspirations and potential, more flow is likely. But there is “a real question of timing”, related adaptability, and strategic evolution by freight carriers, shippers, and receivers.

Both murders and births can be bloody.