Here’s one headline from a usually credible source: China’s COVID-19 lockdown is inflaming the world’s supply chain backlog, with 1 in 5 container ships stuck outside congested ports. [Please see April 26 update below.]
The same day, here’s the headline from another credible source: Shanghai lockdown is not causing global supply chain chaos (yet)
Can both be simultaneously true? Perhaps inflammation is a symptom that if effectively treated can avoid chaos?
These two angles depend on two different sources. The inflammation angle is provided largely by Windward (more). The no-chaos-yet angle is based on data from project44. These are competitors in the supply chain visualization market.
Each is looking at activity in approximately the same time and space. The activity, however, is very complex. Visual Capitalist has put together its own compelling angle on this time and space, confirming significant inflammation in an especially influential maritime node. What happens — or doesn’t happen — at Shanghai will eventually be reflected at LA/LB, Rotterdam, and elsewhere.
What is heading downstream from Shanghai? When? At what velocity? Encountering what receiving capacity?
According to Fortune, “As of April 19, Windward recorded 506 vessels awaiting berthing space at Chinese docks, up 195% from the 260 halted offshore in February… Before the lockdowns started, congestion at China’s ports accounted for only 14.8% of the global container backlog, versus roughly one-third now.” (more)
According to FreightWaves, “Waiting time for export containers, including those headed for the U.S., has actually decreased during the lockdown period: from 3.1 days on March 28 to 2.1 days on Monday. ‘This improvement is because fewer containers are getting to the port in the first place, while simultaneously, sufficient vessel capacity is available to handle those export containers,’ said project44.”
The FreightWaves report also compares the current situation to the June 2021 shutdown of China’s Yantian port. Many of us perceive that this was a principal cause of the extraordinary downstream port congestion experienced during the second half of last year. The language quoted by FreightWaves is sufficiently nuanced that you should read the original. But what I hear is that while the Yantian lockdown essentially caused flows to stop for an extended period, current flows in and out of Shanghai have slowed, but not stopped.
Everyone agrees there is more congestion at Shanghai (and nearby Ningbo) than at any pre-pandemic period and is much worse than last month. Too much dock density is complicating shoreside operations. Too few trucks with truckers are extracting import containers. This has reduced velocity of outbound flows from Shanghai. (Much More.) But — in contrast with June 2021 — flow is still happening.
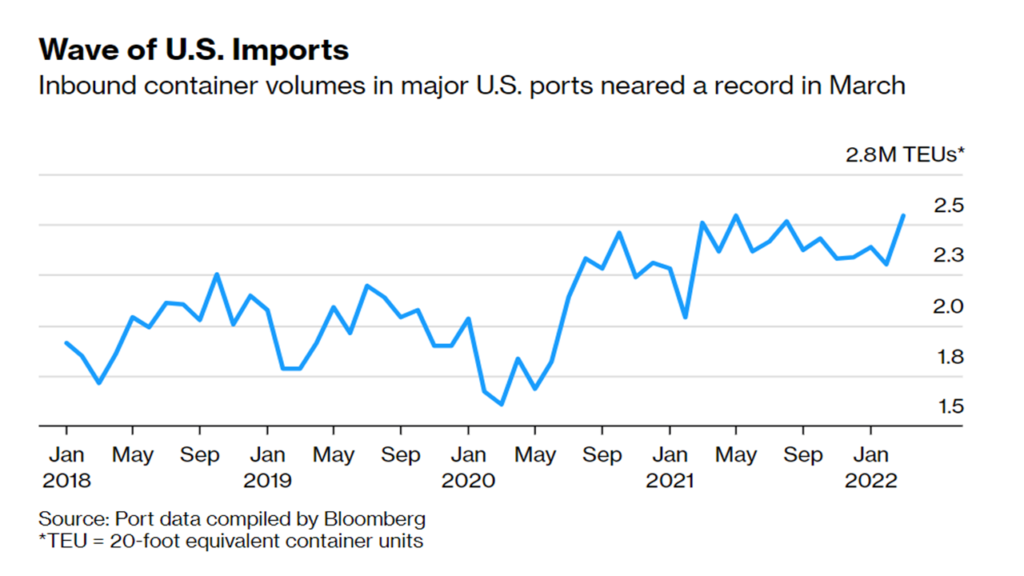
Will Shanghai processing and production resume sufficient to maintain outbound flows of goods (and inbound flows of payments)? (More.) Will US demand for imports from China continue to decline or not (see chart below)? Will US West Coast ports avoid a Longshoreman’s strike? Will San Pedro Bay ever again see less than ten container ships at anchor (here and here and here)? There are plenty more such questions.
The map is never the territory. All models are wrong, but some are useful. Human discernment requires choice. Choices usually exclude. Depending on what is included, equally valid analyses can offer different outcomes. Over time and space these differences can be amplified.
Flow has slowed. So has demand. If upstream sources dry up, there’s a fundamental problem. If downstream discharge cannot happen, there may be an existential problem. While flow persists we can mitigate and solve problems.

+++
Related note: Above I am mostly looking at trade flows between Shanghai and the outside world, especially the United States. This angle does not give attention to the impact of diminished food flows on the residents of Shanghai and well beyond Shanghai. Evidence continues to accumulate that the effort to replace demand–oriented watersheds with a supply-oriented pipelines is failing many (more and more and more and more).
April 25 Update: Increasing covid case counts in Beijing and other provinces suggests that several other watersheds are now under threat. [And the threat of new mutation threatens all of us.]
April 26 Update: Bloomberg has posted a long-read mostly organized around this premise: “China accounts for about 12% of global trade and Covid restrictions have idled factories and warehouses, slowed truck deliveries and exacerbated container logjams. U.S. and European ports are already swamped, leaving them vulnerable to additional shocks.” The US will, as a result it is argued, see a recurrence of 2021 port congestion and related… and there are longer-term implications as set out by the Bloomberg piece. For me, the most persuasive evidence for this argument is increased flow of containers into US ports (please see chart below). If this increased flow persists and grows — especially in uneven spurts arriving at too few nodes — then more congestion and all its discontents will recur. But as regular readers know, I do not perceive that recent levels of US demand will persist. As set out in my original post above there is also evidence that outbound flow from China is — so far — more consistent than inbound. Even the Bloomberg piece notes that much of the current congestion at Shanghai and nearby is the result of inbound goods unable to be offloaded. Outbound flow from China has slowed, but continues (more). I am not (yet) predicting anything. I am arguing that evidence is ambiguous, even contradictory and given changing conditions in China and elsewhere we should not immediately assume the pig-in-the-python at China’s ports must turn our way. We should continue to do what we can to reduce friction and improve flow at US ports and we should watch carefully the character of outbound flows from China.