Bloomberg has posted a very helpful overview headlined “Supply Chains Inching Back to Normal“. The report includes recent assessments and charts by Oxford Economics, Flexport, Freightos, and more. The core takeaway: “Economists generally agree that US household demand for merchandise will be key to watch in coming months, but they’re split about whether it will stay strong or start to soften.”
Last week’s June retail sales figures have been read by many as a stay-strong signal. There are, however, start(ing)-to-soften signals too. For example real consumption for food-at-home and real consumption of durable goods are both well off peak.
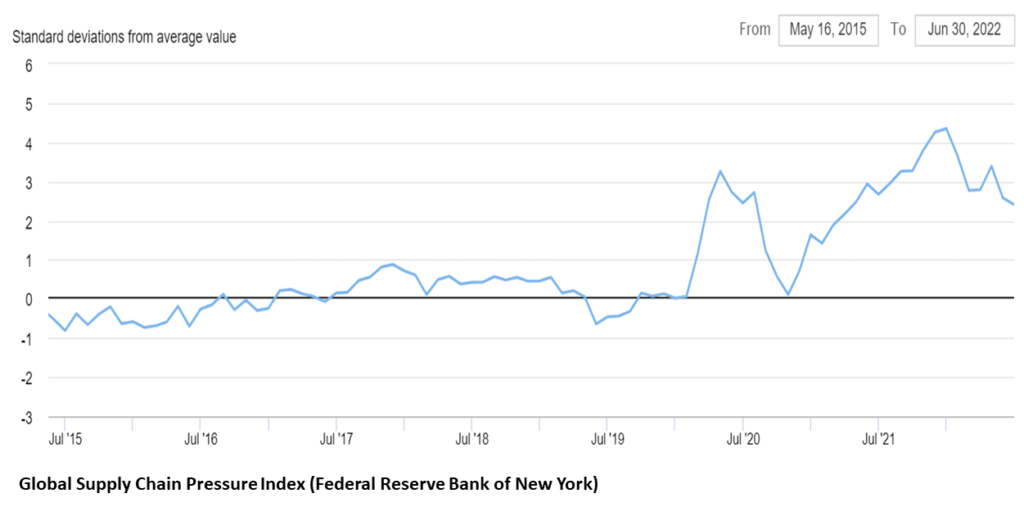
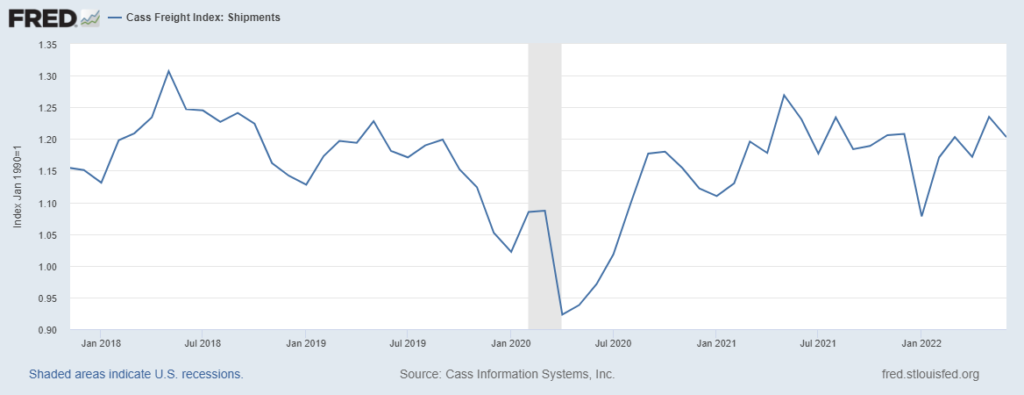
Below are two Federal Reserve sources for overall supply chain fitness. (GSCPI is mentioned but details are not included in the Bloomberg report. The Cass Freight Index is not mentioned.) Given the high-pressure on US supply chains in 2021, this is one time when down-hill slopes are welcome.
Reduced demand and related cooling of friction are also apparent in other freight market indicators. Just one: the van load-to-truck ratio is 30 percent below June 2021. As previously outlined, I expect this softening to widen and persist. I hope for a few months of gliding, rather than sharp drops in demand.
But as the two charts below also suggest, US flows continue to be volatile. There are plenty of current problems (more and more and more) with risks worth anticipating. In the classic Three Stooges routine — inch by inch, step by step — the slow turn is not achieved without related pain.