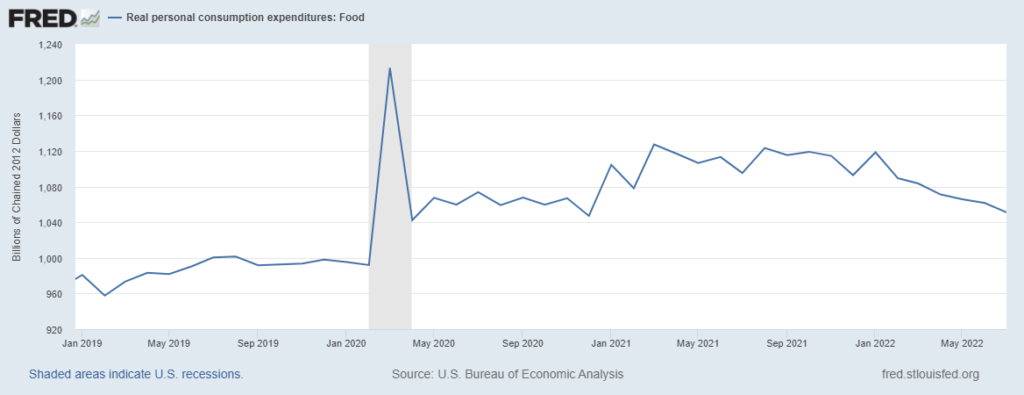
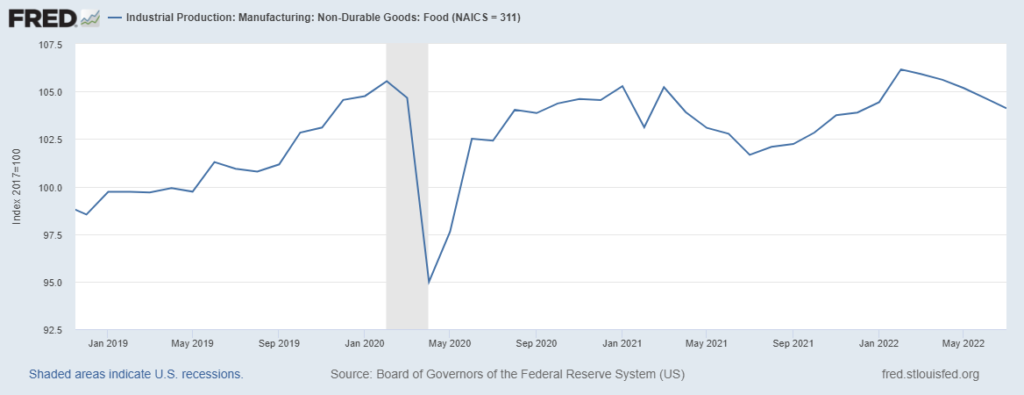
Since March 2020 American consumers have wanted more of many food products than there has been capacity to supply these food products (more). The first chart below displays real personal consumption expenditures for food. The second chart shows an index for US food manufacturing. Even after several months of consecutive declines, food demand remains well above 2019 levels, while food manufacturing outputs have remained consistent with or only slightly above 2019 levels for most of the last two years (more).
Given this imbalance of demand and supply, prices have increased to test the depth and persistence of this demand. Given the tight labor market, volatile operational costs, and recent increases in the cost of capital, suppliers have been reluctant and/or constrained in their ability to increase manufacturing capacity. Increasing food prices have (as the real PCE chart below suggests) begun to re-balance demand in the overall food category. There is still a ways to go before supply capacity and real demand are balanced.
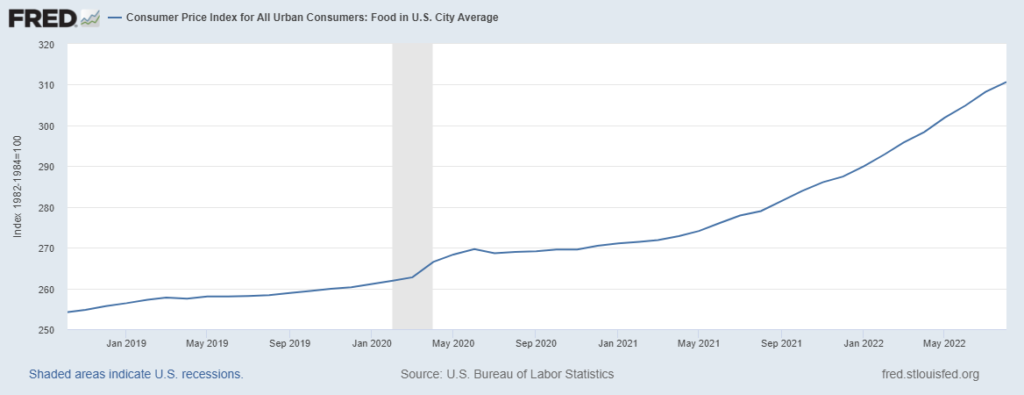
This morning’s Consumer Price Index for August confirms that US food prices continue to increase. According to the Bureau of Labor Statistics, “The food at home index rose 13.5 percent over the last 12 months, the largest 12-month increase since the period ending March 1979.” (See third chart below.)
These price increases and their rate of change are reducing real demand. As of the end of July there was roughly $40 billion in “excess” monthly food demand still to be shed. The August PCE will almost certainly show more such shedding. Once the excess is mostly gone, the CPI arc should begin to flatten or even decline… as long as pre-pandemic sourcing, manufacturing, and distribution capacity can be maintained. On a seasonal basis, the US food manufacturing sector is — so far –demonstrating an ability to fully deploy existing capacity. In July 2022, for example, this sector produced a bit better than three percent more than July 2019.