[June 16 update far below]
According to the International Energy Administration, in May Russia’s oil export volume was down 3 percent. The total dollar value returned was, however, up 11 percent (despite considerable price discounting per going global rates) (more). Outbound flows to China, Turkey, and India have picked up as other flows have declined (despite China’s much lower crude oil demand). Total inbound cash-flow matches pre-March (pre-sanctions) on reduced product outflow. So far, pull is effectively overcoming earnest efforts to impede push.
Given inescapable impediments caused by counter-pandemic policies, many have been surprised that China’s customs data for May exports were up almost 17 percent in value year-over-year (and 2021 was also up YOY) (more and more ). Volumes were also up. According to the South China Morning Post, “container throughput for foreign trade at eight major ports in China increased by 13 per cent year on year in May.” Inbound flows have been much more constrained. There have been earnest efforts to maximize outbound push, despite near grid-lock conditions for domestic flows.
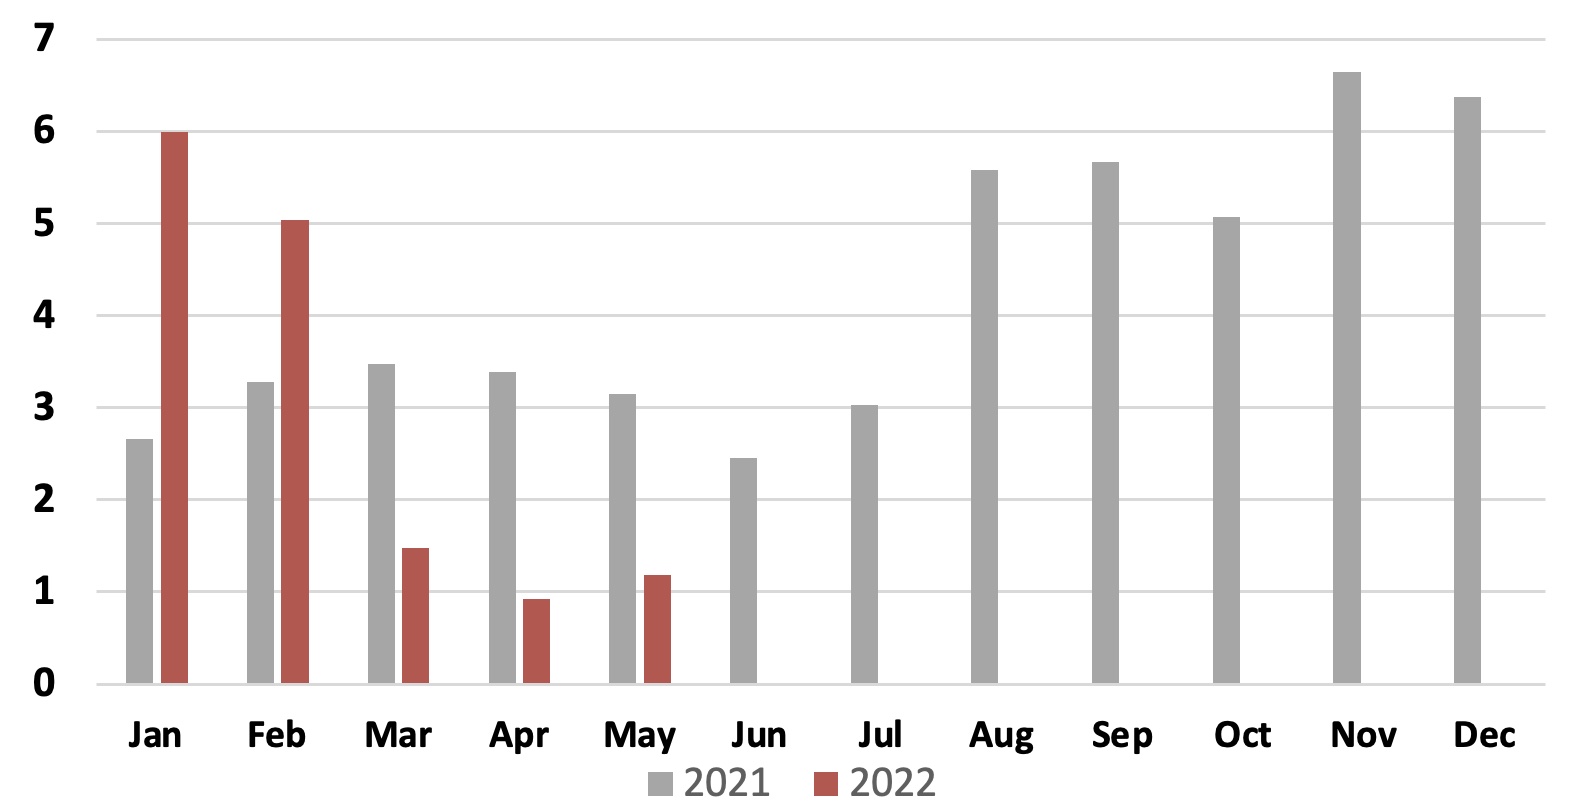
Ukraine’s grain flows through Black Sea ports are blocked by defensive mines, military attacks, Russia’s blockade, and the full friction of war (more and more). Before the war up to 90 percent of Ukraine’s grain exports moved through Black Sea ports. In 2021 just four ports, Odesa, Chernomorsk, Pivdennyi, and Mykolayiv handled 6 million tons per month. Since the war began on February 24, a rough average of one million tons of grain per month have been exported using every available means (see chart below). Most years Ukraine is among the top five grain exporters. Pull is persistent, even intensifying. Grain and related prices are mostly increasing. Push is cutting new channels (more and more and more and more). But, so far, push has not found a way to compensate for suddenly losing 90 percent of preexisting capacity.
While only three examples, to compare and contrast suggests that pull can be very persuasive as long as push capacity persists. Strong pull can motivate overcoming considerable friction in flows and even loss of usual demand. But if a significant proportion of upstream capacity is blocked or destroyed, no amount of pull will restart push in the short-term. Large scale capacity is the result of large-scale and typically long-time investments.
Some readers may wonder: why give so much space to explaining what is obvious. It is increasingly my experience that capacity issues — and especially capacity-crashing issues — are not obvious to many otherwise wise and experienced folks.
Ukraine’s grain exports per month 2021 and 2022 through May
+++
June 16 Updates: Good detail on Russia oil flows from S&P, including: “Russia’s oil export resilience to Western boycotts and sanctions so far has surprised most market watchers. After plunging 930,000 b/d in April, Russian total oil production in May actually rose by 130,000 b/d to 10.55 million b/d…” Report includes break-down by old and new pull. New shipping spot market index (more)shows price for China to US containers well below highs (if still double pre-pandemic averages). Interesting angle on reshaping Ukrainian grain channels by constructing new — supposedly temporary — distribution nodes where stocks could be concentrated to size, scope, scale and optimize non-traditional flows. See Reuters report on temporary silos (more and more).