[June 15 update far below]
Americans are big eaters.
According to IRI (see chart below) grocery demand has recently been up five to almost ten percent, depending on product category, compared to 2021… which was higher than than 2020 which was about one-fifth higher than 2019.
Comfort food has — understandably — been in high demand.
According to the Federal Reserve in April 2022 compared to April 2017 the US produced 12 percent more “sugar and confectionary product,” and about 16 percent more meat (seasonally adjusted). The overall food production increase was just about five percent. (The US population increased by about 2.2 percent over this period).
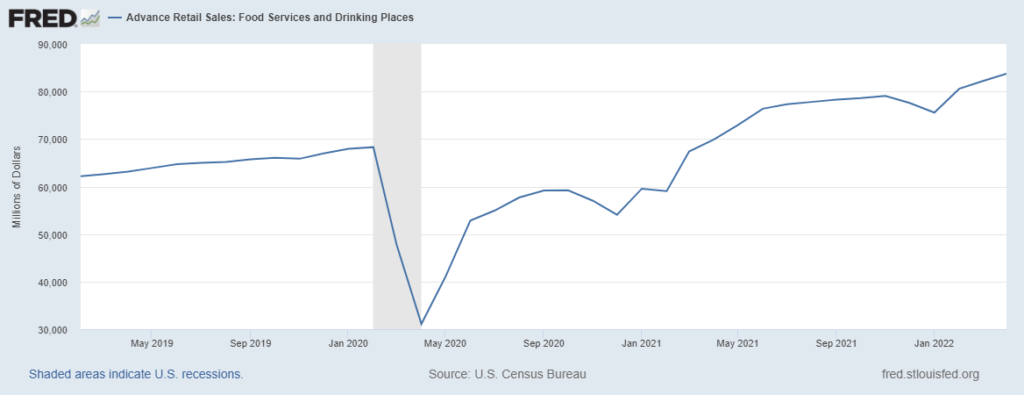
We are now eating out about as much — or much more — than pre-pandemic (see chart below). According to the Fed in April 2019 Americans spent $63,137 million at Food Services and Drinking Places. This April we spent $83,741 million. That’s about one-tenth above a generous extension of pre-pandemic growth trends.
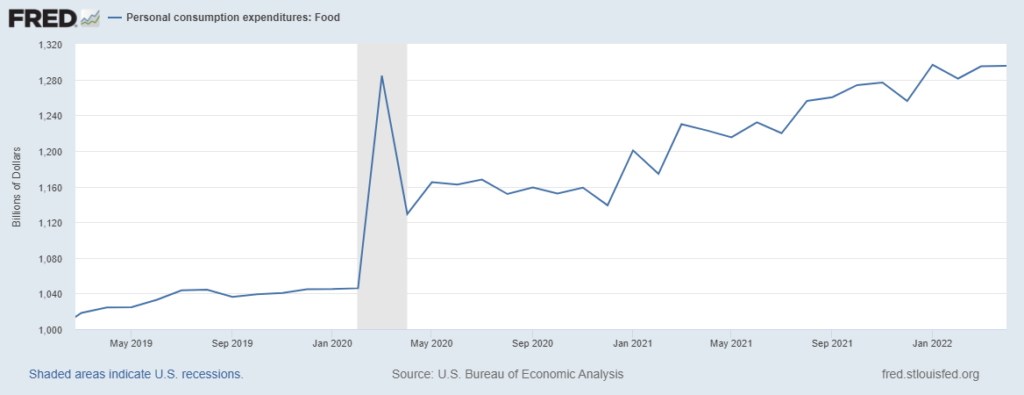
Many expected (I expected) grocery demand to gradually soften as eating-out returned. Instead for most of the last year-plus, dollars spent have increased for both Food-At-Home and Food-Away-From-Home. In April 2022, according to the Bureau of Economic Analysis, Americans spent about one-quarter more on food than in April 2019 (see chart below). American consumers also continue to spend well above pre-pandemic trends on durable goods… and much more.
Given these aggressive new spending habits, I am less skeptical regarding the reality of “retail therapy.”
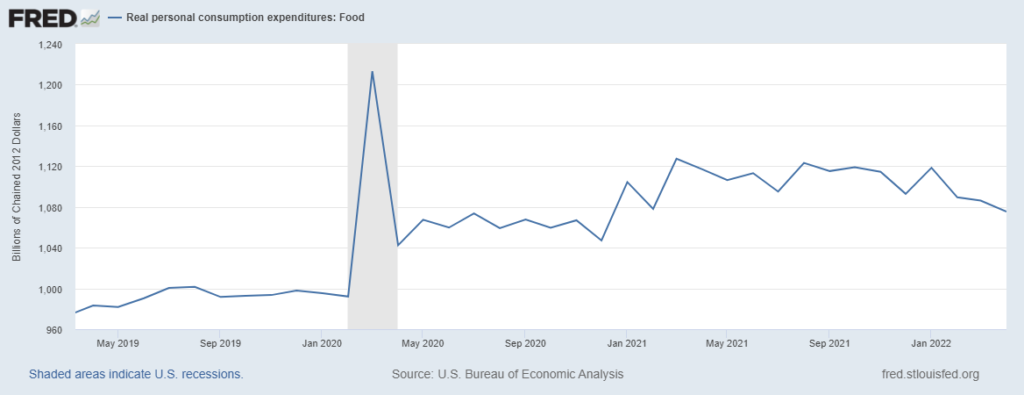
As expected with a demand surge, food prices have increased. This reflects pull exceeding existing push capacity. When adjusted for inflation, the growth in “real” demand has moderated, especially this year (see final chart below). But this real demand remains at least 8 percent above April 2019. (Please mind the gap: while overall food production has increased about five percent, overall food demand has increased yet three points more over the same period.)
In its May Consumer Price Index released Friday (more), the Bureau of Labor Statistics reported:
The food at home index rose 11.9 percent over the last 12 months, the largest 12-month increase since the period ending April 1979. All six major grocery store food group indexes increased over the span, with five of the six rising more than 10 percent. The index for meats, poultry, fish, and eggs increased the most, rising 14.2 percent, with the index for eggs increasing 32.2 percent. The remaining groups saw increases ranging from 8.2 percent (fruits and vegetables) to 12.6 percent (other food at home). The index for food away from home rose 7.4 percent over the last year, the largest 12-month change since the period ending November 1981. The index for full service meals rose 9.0 percent over the last 12 months, and the index for limited service meals rose 7.3 percent over the last year.
Even on an inflation-adjusted basis, Americans are spending more on every category tracked. We are spending savings accumulated early in the pandemic. We are spending more (saving less) of current wages.
Disequilibrium of demand and supply prompts price increases. Disequilibrium results from less supply or more demand. Because of avian flu there has recently been a reduced supply of eggs — even while there has been increased demand. Hence, the nearly one-third price increase. In other food products we have mostly had more supply, but we have had even more demand.
There is evidence that real US demand for food peaked around Thanksgiving 2021… and consumer willingness (ability?) to pay increasing food costs is subsiding. As fuel and other household costs continue to increase, I expect to see a decline in inflation-adjusted spending on food until supply and demand are better balanced. Given increased energy costs and global disequilibrium in food-related demand and supply, what the United States may then experience is incremental demand-destruction for food as discretionary expenditures narrow. We will not see a June PCE for another six weeks; that will provide retrospective evidence for what is happening right now.
IRI Demand Index through May 29, 2022

Federal Reserve Sales at Food Services and Drinking Places, April 2019 to April 2022
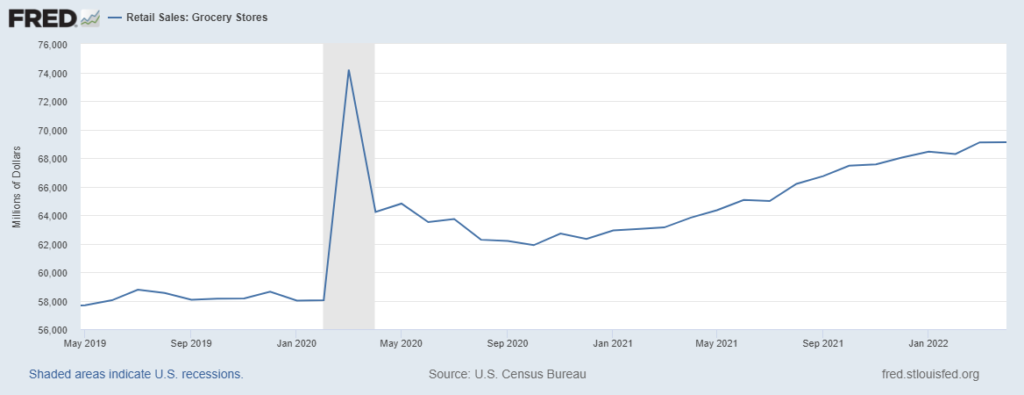
Federal Reserve Personal Consumption Expenditures (Food-At-Home)
Federal Reserve Real Consumption Expenditures on Food (inflation adjusted 2012 chained dollars)
+++
June 15 Update: While not as meaningful as the June report on Personal Consumption Expenditures (or even the May PCE scheduled for June 30), the retail sales report for May (released June 15) does reinforce the sense of an incremental softening in consumer demand for food. The chart below shows grocery sales not adjusted for inflation. Overall retail sales were at least as flat and arguably lower. The overall retail inventory to sales ratio is still below par, but continuing to improve. Some retailers, though, are having painful encounters with inventory bullwhips.