According to this morning’s report from the Bureau of Economic Analysis, during the month of June US real personal consumption expenditures continued flat, almost unchanged from January and basically the same as October 2021. The “feels-like” rate of expenditure is much hotter because of inflation (economic humidity?), but in terms of steady 2012 dollars US demand for aggregate goods and services has been very consistent.
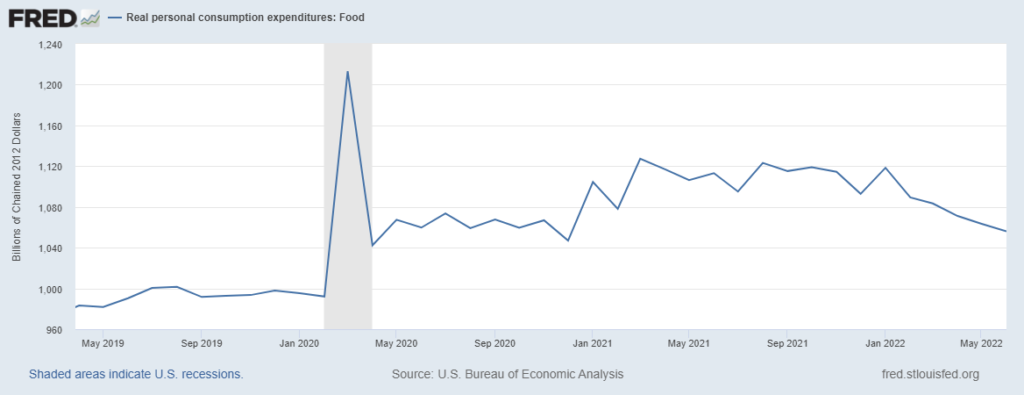
In June 2019 US consumers spent $990 billion on food-at-home (see chart below). In March 2020 fear-of-missing-out (and plenty more fears) spurred grocery purchases to over $1200 billion. But as most shelves continued to be stocked and various viral fears subsided, the contents of grocery carts settled at about six to seven percent higher than pre-pandemic, partly reflecting significantly reduced consumption of Food-Away-From-Home.
Then in the first quarter of 2021 grocery purchases lifted over ten percent and wobbled there most of last year. I will confess (again) that I expected to see this level of grocery buying gradually decline as eating-out climbed. But according to the data, starting in April 2021 American consumers spent as much or more at restaurants than pre-pandemic, even while maintaining our plentiful pandemic pantries (and/or expanded waistlines?).
Until February 2022 — since at least Super Bowl Sunday real expenditures on groceries have declined. Despite this decline, US consumers are still spending well-above real pre-pandemic trend on food-at-home and far above the prior trend on food-away-from-home. I suspect — but don’t have evidence to prove it — that this bifurcation reflects the very different “felt” reality of the top two earning quintiles from the other three. (Nominal dollars spent on groceries are still increasing slightly, but this is due to inflation.)
On June 26, in the context of several posts related to how supply chain disruptions can contribute to inflation, I wrote:
I hypothesize that between May and September we will see food-at-home real consumption gradually decline by another seven to ten percent and then flatten or incrementally increase. I hypothesize that durable goods and services will begin to show slopes similar to 2022 food consumption. I also hypothesize a more rapid rate-of-change than that for food between last November and April. These are deniable hypotheses. I am not sure. It does seem plausible. If this happens, demand and supply will be closer to equilibrium.
The durable goods slope is not (yet?) displaying my anticipated slant. Neither is the services slope… but I really did not expect services to begin falling until summer is over. The June services number is lower than expected. Sustained demand for durable goods remains higher than I expected five weeks ago. (This is why it is called a deniable hypothesis.)
In April the PCE for food-at-home was $1071 billion. Real food expenditures in June were $1056 billion or a decline of about 2.5 percent. If the May+June rate of change continues through the end of September consumption would be lower by slightly less than seven percent. I hope this more gradual easing is maintained. That result is certainly better for the grocery industry and would be consistent with an economic “soft-landing.” More when we see July’s data…
In any case, at least in the food sector, we now have a level of demand much better calibrated with current production and distribution capacities. In my judgment, this means the supply-driven contribution to inflation is diminished.
BELOW: INFLATION ADJUSTED PCE FOR FOOD-AT-HOME THROUGH JUNE 2022
