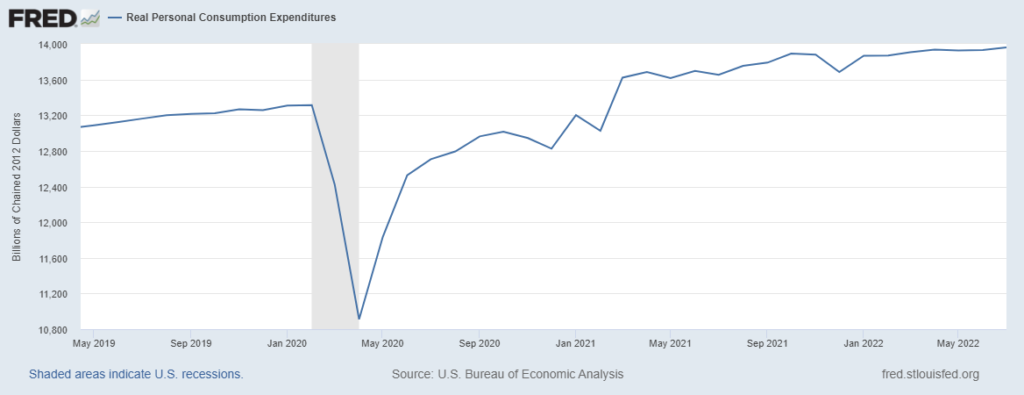
This morning’s July report suggests a largely unchanged consumption glidepath. Nominal consumption increased 0.1 percent from June. Inflation adjusted consumption was up 0.2 percent. (See first chart below.)
While many discretionary expenditures (e.g., non-durable goods) have flattened or fallen, other factors — such as shelter costs — are keeping consumption historically high. The Bureau of Economic Analysis notes, “The $23.7 billion increase in current-dollar PCE in July reflected an increase of $33.3 billion in spending for services that was partly offset by a decrease of $9.6 billion in spending for goods. Within services, the largest contributors to the increase were spending for housing and utilities (mainly housing) and for “other” services (mainly international travel). Within goods, gasoline and other energy goods was the leading contributor to the decrease.” (More and more.)
Fairly steady durable goods spending and reduced spending on food-at-home and non-durable goods means production and distribution capacity has mostly caught-up with increased demand. It is, however, helpful to acknowledge how much higher demand remains. In terms of chained 2012 dollars, in July 2019 total consumption was $13,161 billion. Last month US consumers spent $13,959 billion. That’s about double any previously encountered rate of change, with even higher and volatile rates in between.
Two months ago, based on PCE patterns percolating in the May report and prior, I attempted a prediction:
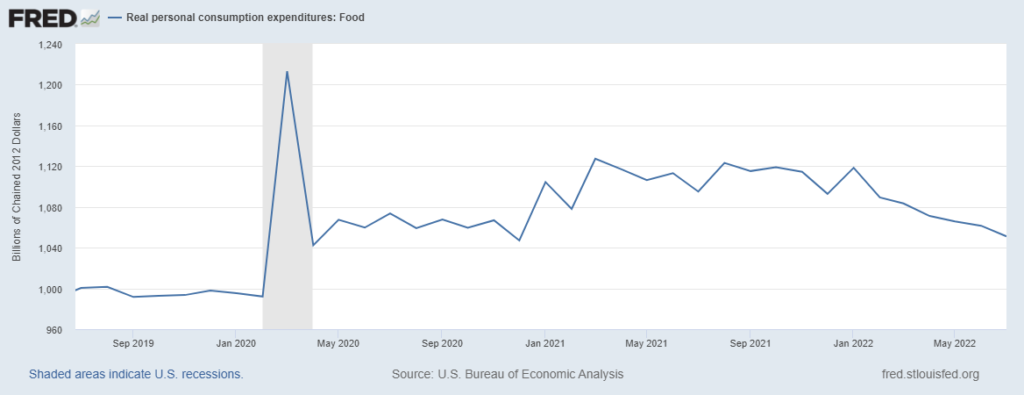
I hypothesize that between May and September we will see food-at-home real consumption gradually decline by another seven to ten percent and then flatten or incrementally increase. I hypothesize that durable goods and services will begin to show slopes similar to 2022 food consumption. I also hypothesize a more rapid rate-of-change than that for food between last November and April. These are deniable hypotheses. I am not sure. It does seem plausible. If this happens, demand and supply will be closer to equilibrium.
So far my hypothesis for food seems to be happening (see second chart below), even if at the low end of — or below — my guess (more). Given June and July PCE results, it is almost time to acknowledge I was wrong on durable goods and services. I was expecting durable goods to continue (and accelerate) its April-to-May decline in consumption. I expected services to be supported by summer spending, I did not expect a sustained decline before September. But the consistent increase in real service spending is stronger than I anticipated. Batting 300 is only good in baseball.