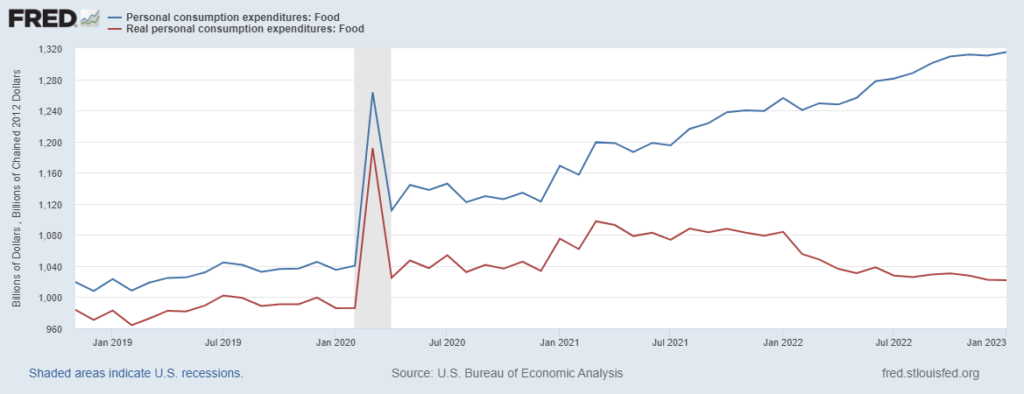
US Personal Consumption Expenditures for food, adjusted for inflation, once again showed modest reductions in January (see chart below). In January $1021.9 billion chained 2012 dollars were spent compared to December’s $1022.5 billion (red line). This compares to $1084 billion in January 2022 and $985.9 billion in January 2020. Slowly, slowly we turn. But we are still spending at least two percent more on Food At Home than pre-pandemic — for reasons I can guess about, but have decided data cannot conclusively demonstrate. The economic implications of this consumer behavior (spending more for less) are making many nervous (here and here). But the supply chain implications seem rather benign, at least to me. The full January report from the Bureau of Economic Analysis is available here. In the version of the chart shown below the blue line is nominal consumer spending while the red line shows spending adjusted for inflation.
+++
February 26 Update: Writing at Bloomberg, Laura Curtis observes, “Supply chains across the world are healing up almost as fast as they broke down. That doesn’t mean the pressure they’re exerting on inflation will disappear as quickly… It’s easy to underestimate how long it can take for inflationary trends to work through supply chains.” She then gives evidence for the why, where, and how fast our velocity.