In 2024 a bit more than twelve percent of US residents — roughly 42 million Americans — received benefits from the Supplemental Nutrition Assistance Program or SNAP. Last year close to $100 billion in federal funding was spent on SNAP.
Policy adjustments in the One Big Beautiful Bill, passed by Congress and signed by the President on Independence Day, seek to reduce SNAP expenditures, potentially twenty-five to thirty percent.
SNAP beneficiaries are not evenly distributed geographically or as demographic proportions. According to the US Department of Agriculture, in 2024, “the share of residents receiving SNAP benefits in each State ranged from as high as 21.2 percent in New Mexico to as low as 4.8 percent in Utah. In 36 States, the share was between 8 and 16 percent” (more). Eligibility and participation rates vary considerably by population area. The new policies are aimed especially at tightening eligibility. More rigorous eligibility requirements also tend to reduce participations rates — even among those who are eligible.
SNAP beneficiaries can be a crucial slice of the consumer market for many grocery retailers. While low-income urban neighborhoods have concentrated populations of SNAP beneficiaries, whole counties with high proportions of SNAP beneficiaries is mostly a rural characteristic. Please see the map below (this map depends on decade-old data, but changes in population proportions have not been dramatic). According to Grocery Dive, “Some grocers will face harder hits from the SNAP changes than others. While SNAP accounts for roughly 12% of grocery sales in the U.S., it can account for less than 1% of sales at a higher-end grocer and more than 60% at a grocer serving low-income urban or rural areas…” Many of the retail locations most dependent on SNAP consumers are already among those with the lowest margins and most vulnerable to failing. Many of these retail outlets serve expansive rural areas.
States have various options for how new SNAP eligibility requirements will be implemented and measured (here and here and here). Results will vary and so will market (and presumably political) responses. The longer-term impact on grocery demand and related implications for supply will not be clear for another six to nine months — and even then, this is not a closed system where SNAP variables can be cleanly separated from other demand factors.
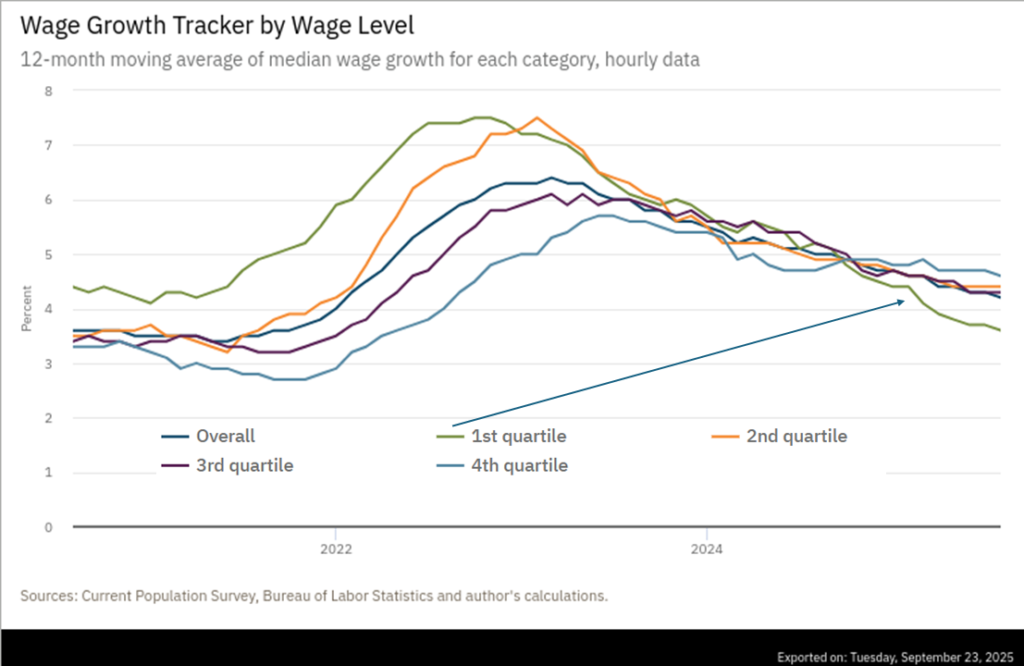
Still, the forthcoming SNAP reductions will further complicate food access by the most financially constrained US households. Food banks and other sources of local emergency assistance are already unable to fulfill current demand (here and here and here and here). Wage growth among the lowest paid quarter of workers is falling (see second chart below and more) even as grocery prices have continued to increase.
But the intention is to reduce SNAP-supported demand, reduce government expenses, and encourage greater self-reliance. All else being equal (which will not be the case), more rigorous eligibility requirements will incrementally reduce grocery demand overall and dramatically reduce effectual demand by the most vulnerable (both vulnerable consumers and vulnerable retailers). In high volume, high velocity demand and supply networks it is the peripheries — geographic and proportional — that are most likely to be shed. The more streamlined supply chains that emerge are usually marginally more resilient. But already underserved communities and individuals are often left profoundly less resilient.