First half 2025 US import volumes were choppy but higher overall (see green line on the chart below through end of July). Since a record-setting March, inbound flows have slowed but remain at historically high levels. According to the global shipping analyst Descartes, “In August 2025, U.S. container imports reached 2,519,722 twenty-foot equivalent units (TEUs)—the second-highest monthly total this year. Volumes were 3.9% below July but 1.6% above August 2024.”
The first half surge has been reasonably explained as importers attempting to build inventory before increased tariff rates hit hardest. A second half trough in imports is predicted — and may have started. Descartes observes that in August, “China-origin imports eased to 869,523 TEUs, down 5.8% from July and 10.8% below August 2024.” Seven out of the top ten US ports experienced July to August declines in container volumes unloaded, with an overall national slowdown of just over four percent month to month.
Prices being paid for imports have increased. But so far prices have lagged tariff-related cost increases. According to the Yale Budget Lab as of early September the average effective tariff rate had reached 17.4 percent. But average end-user prices for these imports have increased at something closer to four percent (here). Given the size of these flows, rapidly shifting action/reaction, and policy volatility precise measures should not be expected. But the direction of travel is clear enough and the longer average tariff rates remain this high the more likely price increases will accelerate. In some cases — examples include coffee and some car parts — prices are already up by double digits (more and more and more and more).
While long-duration increased costs will eventually be followed by increased prices, the full impact on demand is difficult to anticipate. For price sensitive consumers spending will obviously be further constrained. But almost half of US consumption is generated by the wealthiest ten percent (here and here). How will those with the most discretionary income shift their purchasing patterns?
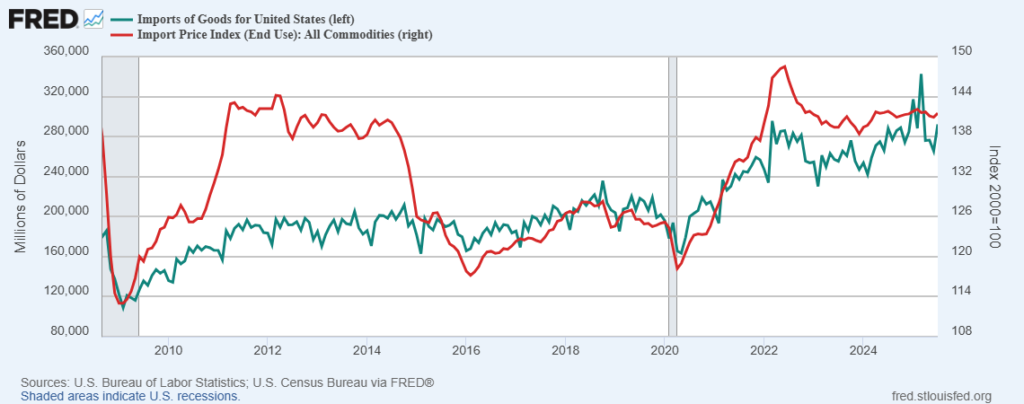
In the chart below the red line is the import price index since the Great Recession. Between 2011 and 2014 significant price increases did not significantly reduce demand. But most of this price increase was for fuel-related imports, then even more essential than today for meaningful participation in earning or spending. The post-pandemic price increase for imports shown was much more broad-based, but accompanied by temporary increases in incomes and savings. Will a broad-based increase in 2025-2026 import prices — without significant increases in discretionary incomes — suppress purchases of imports and overall US consumption?
The demand response depends on how high the price goes on which products for how long. For a quarter-century I have been an enthusiastic fan of Starbucks green tea Frappuccinos: “non-fat, no whip, no classic, ten scoops of matcha” (instead of the normal five). I considered the large size (venti) an expensive indulgence at $5, but I still bought it about once a week, sometimes more. Recently Starbucks began charging a dollar for each extra scoop (here and here). I have exercised my discretion. I no longer buy it. I have not found a replacement product. My credit score recently dropped one point because of a sustained decline in spending (not just at Starbucks). How much is matcha a metaphor for other discretionary consumption expenses? We are about to find out.
In my experience high volume, high velocity supply chains are resilient to most disruptions and even considerable destruction, except for sustained destruction of demand — whatever the cause.