According to the Bureau of Economic Analysis, “Personal income decreased $109.6 billion (0.4 percent at a monthly rate) in May… Disposable personal income (DPI)—personal income less personal current taxes—decreased $125.0 billion (0.6 percent) and personal consumption expenditures (PCE) decreased $29.3 billion (0.1 percent). Personal outlays—the sum of PCE, personal interest payments, and personal current transfer payments—decreased $27.6 billion in May. Personal saving was $1.01 trillion in May and the personal saving rate—personal saving as a percentage of disposable personal income—was 4.5 percent.” Compared to April, reductions in spending were especially pronounced for purchase of vehicles (-49.3%), gasoline (19.8%), and eating out (10.6%).
Peter Cardillo, Chief Market Economist with Spartan Capital Securities told Reuters, “Personal income is disappointing. We were looking for an increase of about 0.3%, so now it’s negative. We were looking for a weak personal spending number, but again negative. These two indicators raise the possibility that the economy has slowed in the second quarter and may be headed for negative economic activity.” Headline inflation Year-Over-Year was slightly higher than — 2.3 percent versus 2.2 percent in April — but still fairly tame. Reuters called it “benign”.
Since December demand has softened. I will even suggest it is flattening. Demand remains, however, quite robust. It is too soon for me to call a sustained downward turn (consider the slopes in this decade long picture of real PCE).
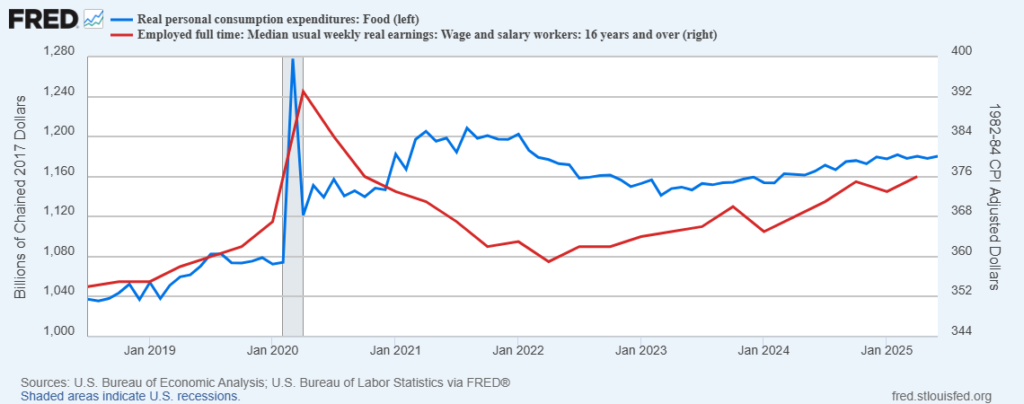
Before the pandemic expenditures on Food-At-Home rather tightly tracked wage/salary patterns. During the pandemic (especially 2020-2021) this correlation broke down as much less was spent on Food-Away-From-Home and many other spending categories. But real — inflation-adjusted — spending on groceries has continued well-above pre-pandemic patterns even as constraints on other spending categories have dissipated and food inflation prompted widespread complaints. Please see chart below.
For me this divergence between the wage/salary slope and the FAH expenditure slope reflects a consumer still predisposed — and able — to spend on personal preferences. Sustained reconvergence of these slopes will reflect a potentially significant economic phase-transition. If both slopes experience sustained declines, that will signal meaningful and wide-spread economic stress. But that’s not what we see yet. The red line will be updated on July 15 through the end of the second quarter.

+++
July Update: Well, the two slopes have not yet converged, but second quarter outcomes have further narrowed the gap. This narrowing is, however, due mostly to wage increases rather than declining consumer expenditures. Please see chart below. Still, future direction is worth watching even if not — yet — a flashing red light and barely even a yellow warning sign (corner ahead). Contemporary supply networks respond with considerable speed to shifts in demand signals — for both good and ill.