US consumer demand remains strong. Despite the Delta variant’s determined discouragement, July retail sales were 0.5 percent higher than June. The Wall Street Journal explains, “With many schools, college campuses and offices reopening, consumers shelled out more for groceries and merchandise at big-box stores. Those purchases—along with higher spending on furniture and hardware—offset another big decline in car sales, which have suffered from a global computer chip-shortage that has crimped supply.”
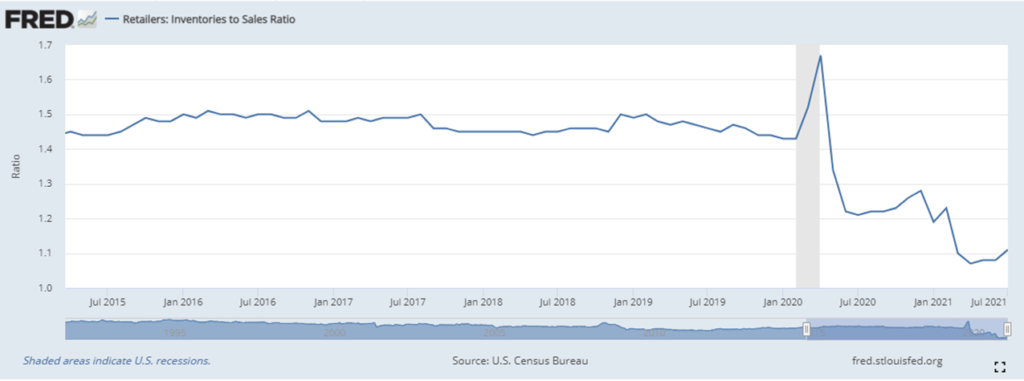
Even with strong and often volatile demand — and constant reports of stock-outs — the ratio of retail inventories to sales increased to 1.11 . This remains very tight. But for three consecutive months, the ratio has remained above April 2021’s 1.07 asphyxiation level. It is, however, worth noting that breathing remains difficult for the food and beverage category. Here the seasonally adjusted ratio improved from 0.72 to 0.73. Grocery demand has continued to outpace most other retail categories. Could grocery stores sell one-fifth more with better assured supply? Or have upstream challenges introduced grocery to the charms of fast fashion merchandising? Are customers buying what’s available just-in-case?
As the Federal Reserve chart (below) suggests, the ratio had stayed within a narrow range since the end of the Great Recession. But when consumers stopped buying in March and April 2020 inventory quickly accumulated. Perceiving potential for a long-term demand drought, many retailers stopped ordering… just in time to be ill-prepared for a flash flood of retail demand in May-June 2020 and escalations since. In April 2021 US retail sales peaked at nearly one-third above the April 2020 bottom, Inventories have never caught up with this Niagara Falls of cross-cutting, fast falling inventory to sales ratio.