Many perceive port congestion as a clog in a corroded pipe that needs replacing. I have argued port congestion is the outcome of flooding (more). Our pipes are delivering more flow than ever before. But a great flood has overwhelmed preexisting channels. Along the way, clogs have emerged, showing us where and how current flow capacity is most constrained.
Still, even where there are clogs, flow is usually well-above any prior level. In 2018 the Port of Los Angeles handled a record-breaking flow of just under 9.5 million containers (TEU equivalents). As of the end of September 2021, the port had handled 8.2 million containers. By this New Year’s Eve, the 2021 flow is likely to be one-tenth to one-fifth more than the 2018 record.
Recently 80 (more or less) container ships have been waiting to be unloaded at the Ports of Los Angeles and Long Beach. Early November is always a busy time at ports, but this size back-up is unprecedented. There are many contributing factors. Congestion at East Asian ports has generated a pig-in-the-python push. A pile-up of containers on US docks has slowed unloading new containers. Dock density has increased truck wait-times. An almost fixed number of trucks and truck chassis constrain options for removing containers off the docks. Full shelves at warehouses have slowed unloading of containers and release of chassis (to move new containers). Restrictions on how many containers can be stacked on top of each other disallows a relief valve available at other ports. This list could easily continue. These various points of friction have been building up over the pandemic and especially since Spring 2021.
Now some of our supply chain clogs are beginning to clear. The flood has found new channels in which to flow. There may even be evidence of less precipitation upstream.
Over the last sixty days significant progress has been made discharging containers from LA/Long Beach by rail. On November 10 Union Pacific CEO Lance Fritz said, “We are essentially normal in our international supply chain on Union Pacific from ports to intermodal ramps inland.” Ocean carriers are deploying sweeper ships to collect empty containers off the docks, freeing room for new containers arriving. With more space on the docks to maneuver, less time is being spent unloading which is also reducing wait times at anchor (“dwell times”). (See the Port of Los Angeles Dashboard and the Port of Long Beach Dashboard.)
The ports of LA and Long Beach are not alone in experiencing significantly increased volumes… and related challenges. This is a global pattern. As congestion in Southern California has worsened, maritime carriers have tried to shift to less congested ports. Import volumes for the ports of Seattle and Tacoma are up one-fifth this year. On the US East Coast, Savannah throughput volumes are at record highs. Port of Charleston is up about 15 percent. Port of Virginia is up over 16 percent. Flows into New York/New Jersey are up 23 percent over last year with much less congestion than Southern California. According to Loadstar, trans-Pacific carrier prices have begun to soften: “The discounting and waiving of premium fees for late November and December shipments caused a mini-collapse in container spot rates this week.” The potential return of a “traditional slack season” is even being referenced.
As with any crisis — personal, institutional, or national — stress unveils strengths and weaknesses that the everyday can obscure. I was recently introduced to inventory and tracking tools that should significantly enhance the flow of empty containers and empty pallets; two separate tools deploying very similar concepts and functions. I bet there is something similar for chassis by now. California DMV is trying to remove friction-points for more folks to qualify for a Commercial Drivers License. A Local zoning ordinance has been waived to allow containers to be stacked higher. More warehouse space is being built. Higher wages are being offered to warehouse workers.
We will enter 2022 with improved capacity for expanded flows. But none of these incremental improvements address the core cause of congestion and its consequences. These are flood mitigation measures.
The flood is the result of Americans — traveling and eating-out much less and having much more cash on hand than usual — gorging on more groceries and household “stuff”. The chart below shows the extraordinary shift in consumption of Durable Goods. Nondurable goods consumption is also up dramatically. Many of these goods are produced in East Asia, shipped in containers, and arrive at a few sea ports that were quite reasonably configured and organized for less throughput.
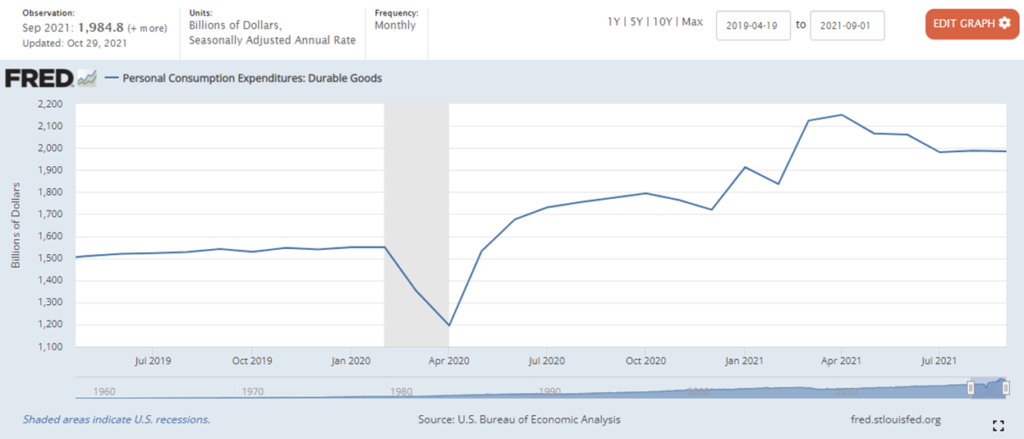
We are beginning to see the flood subside. There are signals that unprecedented pandemic demand is resuming something closer to pre-pandemic volumes and velocity. Durable goods consumption (immediately above) is already off its springtime peak. Consumption of services (and experiences) is closing in on its pre-pandemic proportion of expenditures. The Personal Saving Rate has fallen from an amazing 26.6 percent in May to a much more normal 7.5 percent as of the end of September. Price increases (aka inflation) for the highest-demand products are also beginning to reduce pull, making it easier for push to fulfill demand.
As of today, November 15, we are forty days from Christmas. This Great Flood is off-peak, but there is a huge watershed still to drain. We will still see logjams (especially adjacent to “bridges”, aka nodes and intersections). We will continue to see our excess flow carving new channels. Some long-suffering dikes may yet fail. We will not always be able to receive what we want, when we want it at a price we prefer. But this sure ain’t no drought.
+++
A reader — and evidently client of Goldman Sachs — says my analysis is similar to what they are telling him. Here’s the pull-quote he sent me.
The inflation overshoot has been startling, but so far is attributable to a surge in durable goods prices driven by surprisingly severe and persistent supply-demand imbalances. We do expect persistent inflationary pressure from faster growth of wages and rents, but only enough to keep inflation moderately above 2%, in line with the Fed’s goal under its new framework. The current inflation surge will get worse this winter before it gets better, but as supply-constrained categories shift from a transitory inflationary boost to a transitory deflationary drag, we expect core PCE inflation to fall from 4.4% at end-2021 to 2.3% at end-2022.
Here’s the full Goldman Sachs note. This was evidently published yesterday, but unfortunately I did not see it until about six hours after I posted my note above.
Glad to have independent, distinguished, and credible complementary analysis. But I will also point out, the Goldman Sachs economists are looking at price action, while I am more focused on demand pull and supply push. Related? Absolutely. Chicken or egg? I bet we might differ.
[Original post about 0600 Eastern Time. This addition was posted at about 1500 Eastern.]