Month: October 2025

Water, fuel, and food for Jamaica

Hurricane Melissa is forecast to make landfall on Jamaica sometime early on Tuesday, October 28 (more). It will probably be a slow-moving Category 4 or 5 storm bringing catastrophic rains and 140 mile-per-hour plus winds.

High winds and coastal storm surge will wreak havoc. The impact of flooding on transportation and water infrastructure is of particular concern. Thirty and more inches could inundate much of Jamaica on October 27 and 28.

Almost 3 million people live on Jamaica. The island is roughly 145 miles long and 50 miles wide (or about 4400 square miles, 11,000 square kilometers).

In 2024 Hurricane Beryl passed near Jamaica as a Category 4 storm seriously disrupting the electrical grid’s distribution network. But power was restored for over 90 percent of customers within one week. Hurricane Gilbert (1988) disrupted both distribution and transmission networks leaving many without power for months. (More and more.)

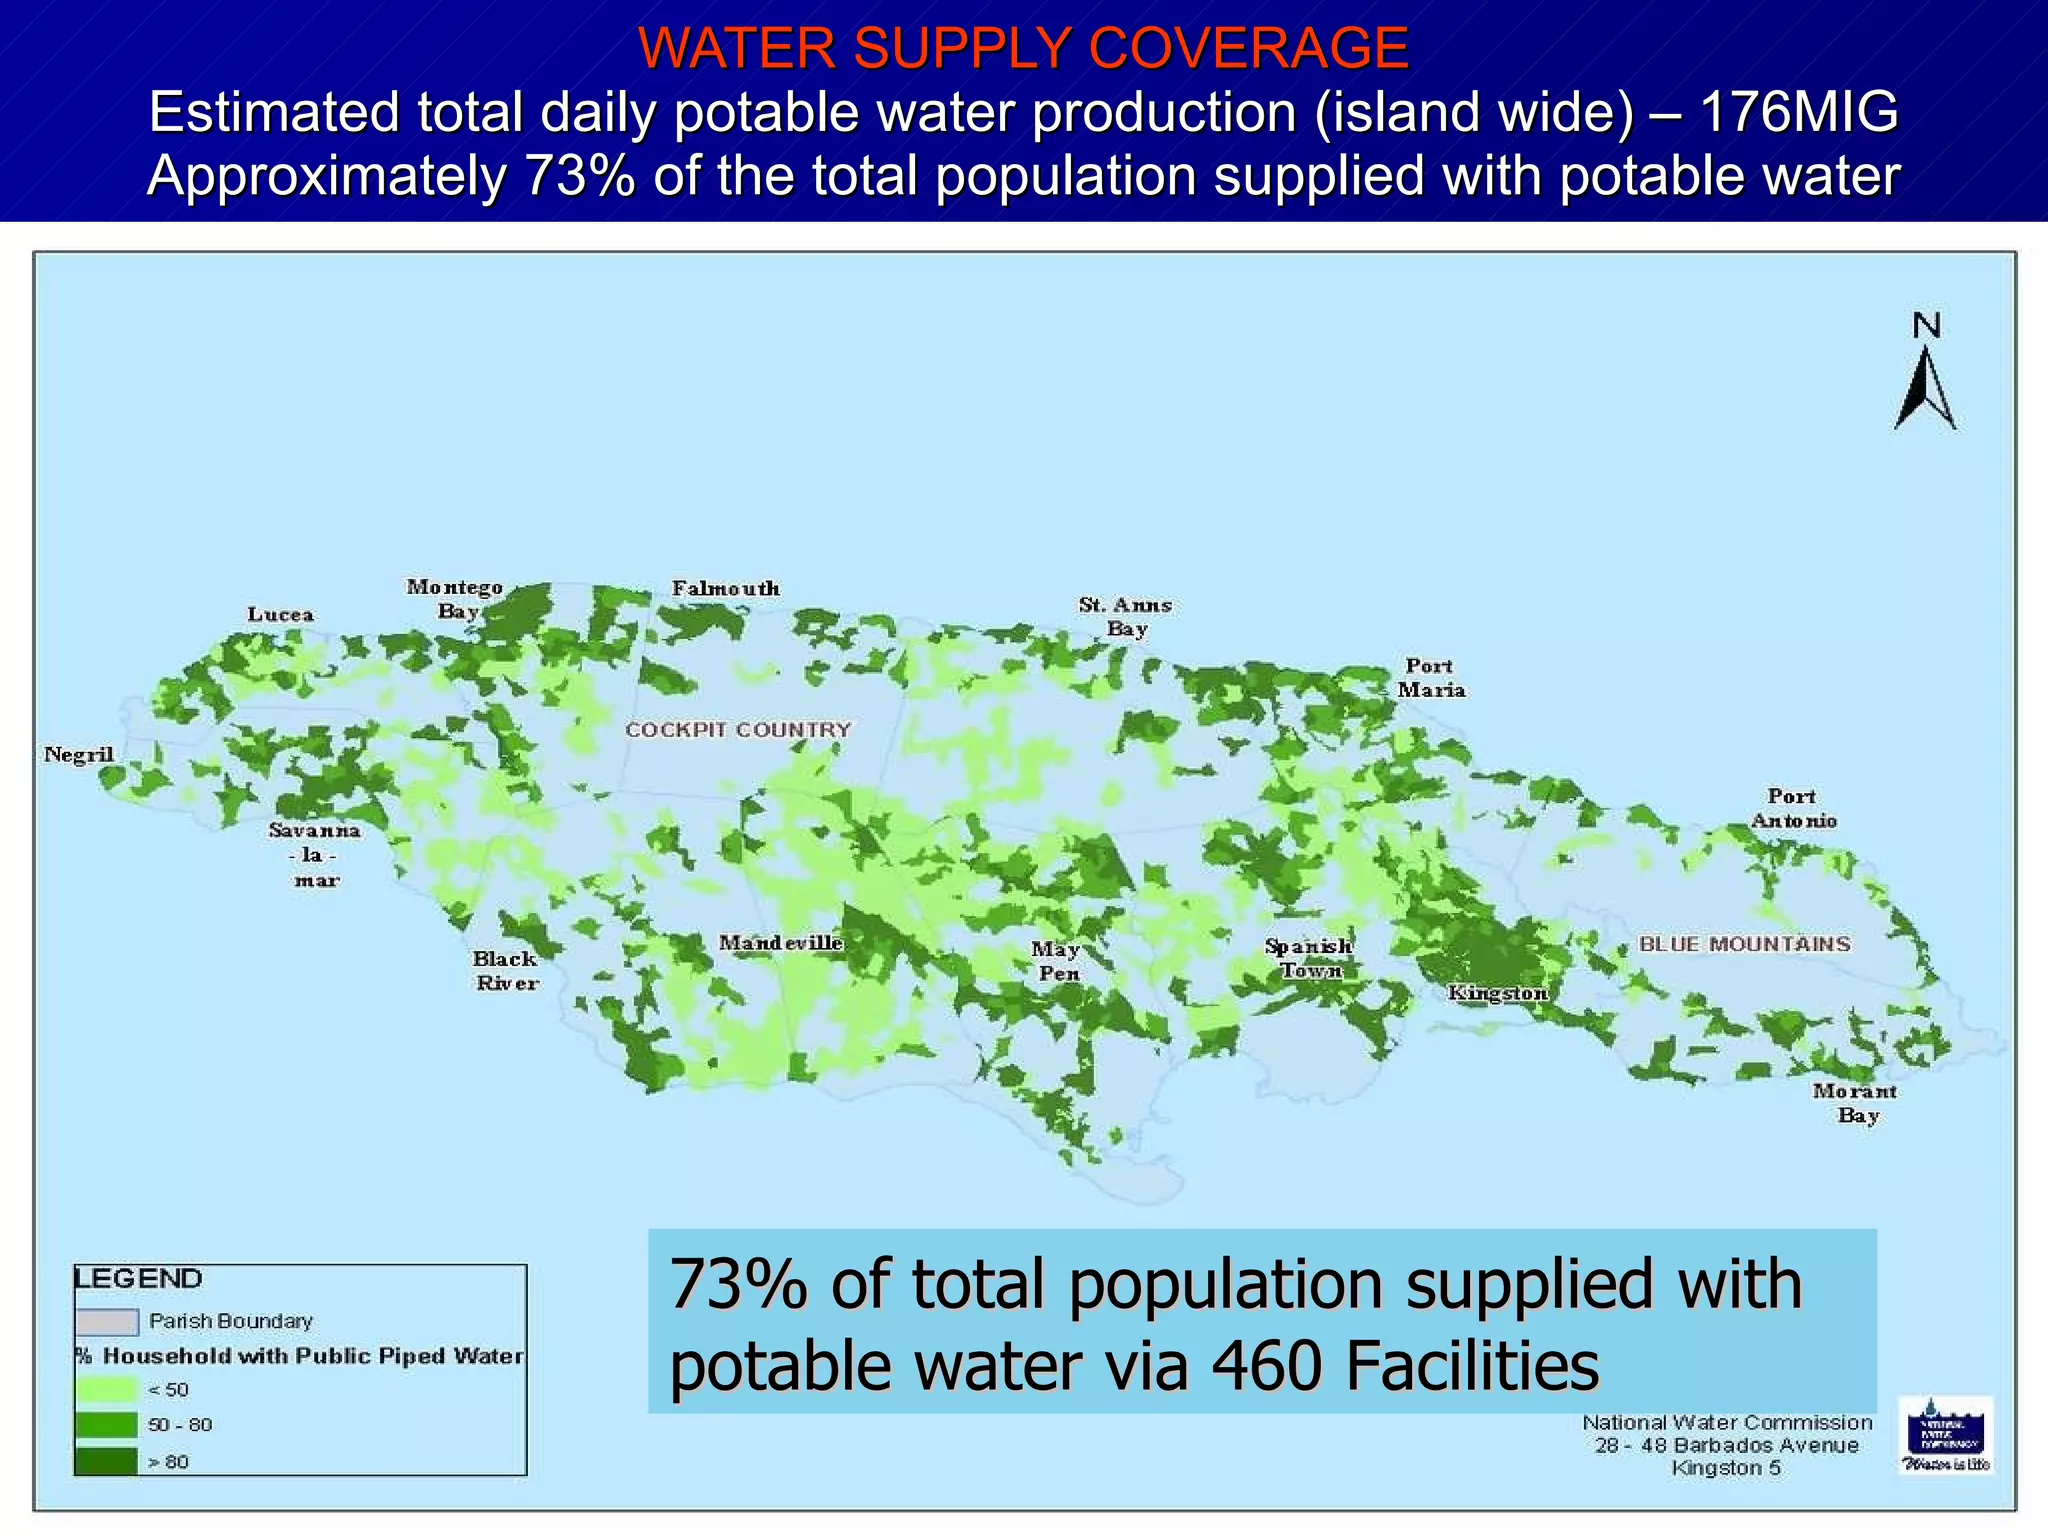
Jamaica’s National Water Commission supplies potable water for almost three-quarters of the population (see map below). Over 80 percent of Jamaica’s water is pumped from groundwater. Pumps require grid power or emergency back-up power. Electrical generators require fuel.

Petrojam Ltd. operates a petroleum refinery near Kingston. But Jamaica imports much more refined fuel than it produces. In recent years, over sixty percent of refined fuels consumed in Jamaica have been imported, mostly from the United States. Refined fuels are used to generate almost one-third of Jamaica’s grid power. In case of a long-term grid outage, fuel demand is likely to increase to support water pumping, cell tower operations, warehouses, trucking, and emergency generation needs. Supply and demand could experience exacerbated disequilibrium because fuel to generate electricity is often not the same as fuel to satisfy other energy consumption needs. Fuel distribution/delivery is mostly by truck. This distribution capacity is not sufficient to gap-fill infrastructure, commercial, and residential demand during a long-term grid outage in combination with transportation impediments. (Here and here and here.)

About eighty percent of Jamaica’s food is imported, mostly from the United States. Roughly 60 percent of food flows usually support the tourist sector in Jamaica (here). Major grocery retailers include Progressive Grocers, Hi-lo Food Stores, and PriceSmart. A market leading food importer/wholesaler is Everything Fresh. Continued or disrupted flow by these high proportion providers should offer meaningful indicators of overall network fitness in the aftermath of Melissa. As is the case for most islands, the food supply chain serving Jamaica is not especially Just-In-Time. Substantial warehouse stocks are usually maintained — especially for hurricane season.

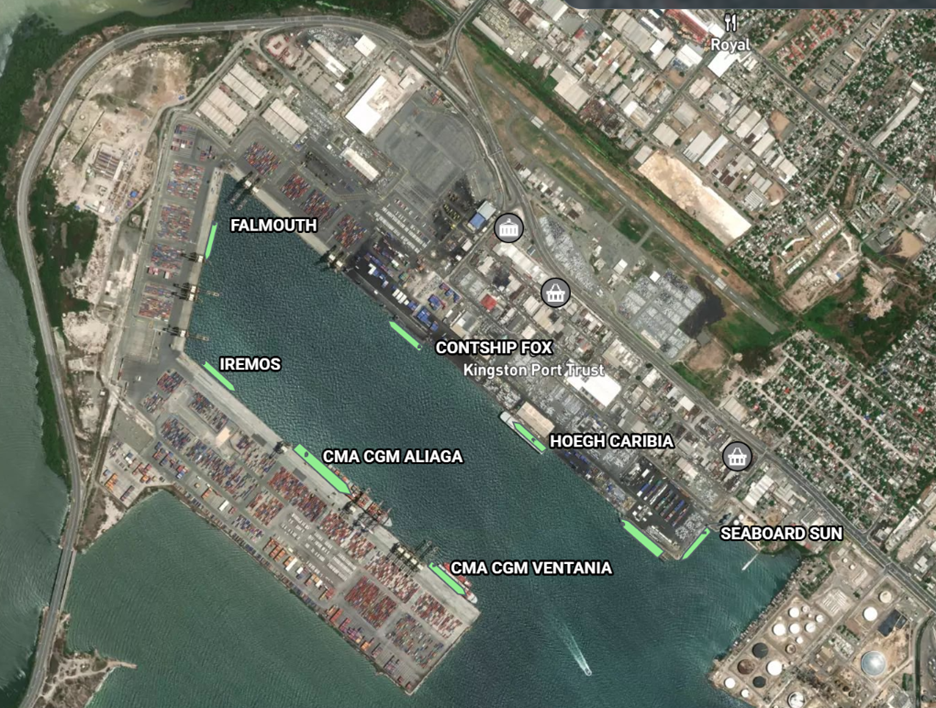
Melissa seems likely to cause time-extended grid outages. The longer the grid is down the more important recovery of water systems, fuel delivery, and food availability. Strategic capacity for fuel and food is concentrated at the Port of Kingston (more and more). If port operations can quickly resume, upstream flows will resume. Maritime movement — or current lack of movement — can be monitored here. The nearest NOAA buoy is over 200 miles southeast of Kingston. Wave and wind forecasts and history for Port of Kingston are available here. The Crowley Maritime schedule for Jamaica (more) will also help confirm and clarify the general velocity of inbound post-hurricane flows.

Pumping capacity for system replenishment is the most important flow-point (or choke-point) for providing potable water. This capacity is currently distributed over more than 150 pumping sites. As a result of this decentralization, catastrophic loss of capacity should be mitigated. But if the grid is gone, then fuel flows inbound and outbound of Kingston become even more important. Monitoring — and facilitating — fuel flows through the neck of the network’s hourglass at Kingston could become the key means for expediting flows of fuel and food and water to survivors.

[NOTE: As of Monday morning, October 27, web-based resources hosted in Jamaica are loading more slowly or not available.]

+++

UPDATE October 28, 0400 Eastern Time: Slow moving, CAT5 Melissa remains southwest of Jamaica. Landfall is now forecast for late morning or this afternoon proximate to the 78th Meridian (see second map below). The current forecast for the Port of Kingston suggests the worst conditions will emerge mid-afternoon with wind gusts above 50 mph, wave heights of 12-16 feet, and rain accumulation exceeding one inch per hour for much of this afternoon.

The highest cloud tops, corresponding to the most vigorous convection, are shown in the dark red and pink colors. Clustering, deep convection around the center is a sign of a healthy tropical system.
Source: https://weather.com/storms/hurricane/news/2025-10-27-hurricane-melissa-forecast-category-5-jamaica-haiti-cuba
Source: https://www.linkedin.com/pulse/population-density-distribution-jamaica-gis-analysis-national-young-cjdyc/

UPDATE, October 29, 0400 Eastern: Melissa just made landfall on eastern Cuba (here). The situation in Jamaica will remain uncertain until sunrise allows for closer and wider observations. But early indicators suggest key elements of network capacity for receiving and moving water, food, and fuel have survived. According to the Kingston Gleaner newspaper:

Hurricane Melissa, according to the US National Hurricane Center, made landfall near New Hope, Westmoreland, with wind speeds of up to 185 mph. As the disaster pummeled those areas, rendering far lighter winds and rainfall in the capital city, Kingstonians tuned in to weather broadcasts and social media reports relaying reports of massive flooding, heavy winds, and the overall trauma of what the Meteorological Service of Jamaica (Met Service) warned was the island’s worst disaster. “We have been spared, but at the same time St Elizabeth and Westmoreland haven’t been spared,” said Burgess [a Kingston-based civil engineer], expressing dismay for Jamaicans affected in those primary hit parishes, and also those impacted in the eastern islands.

The maritime channel south of Jamaica is busy again. At least four tankers can be observed heading for Kingston harbor. Webcams at the port area show calm conditions and lights (here and here). It will be a tough and extended recovery for thousands in Jamaica. But it appears that response and recovery will be supported by significant continuity of network capacity.

Force on Target is fundamental to resilience probabilities. Melissa was (and remains) a monstrous force. But the hurricane’s targets in Western Jamaica encompassed the island’s least concentrated population (see map above) and almost no concentrations of supply chain capacity. If the same force had made landfall 75 miles east, consequences would have been massively multiplied.

UPDATE: October 30, 0600 Eastern: The Port of Kingston does not seem to have opened yet. Details of channel safety or channel clearing are not available to me. But the number of vessels now anchored off the port suggest that maritime operators expect to be able to offload soon. Yesterday, Wednesday, local media reported that the port expected to reopen today. I count at least six tankers and three cargo vessels standing by. Midday yesterday about three-quarters of Jamaica’s grid customers continued in the dark, but water system disruptions were being characterized as “minimal” (here). Reliefweb is aggregating helpful multi-agency reports here: https://reliefweb.int/country/jam

1100 hours Eastern (October 30): I still don’t have “official” confirmation that the Port of Kingston has reopened, but the terminal is certainly conducting operations and I see a handful of vessels at the docks.

UPDATE: October 31, 0400 Eastern: The Port of Kingston is open and was fully operating yesterday. On Thursday twenty-one vessels arrived. This morning I count eight cargo ships at the docks (see AIS mapping image below), several more are at anchorage nearby, and eight new vessels are scheduled to dock today (October 31). Both cargo and tanker vessels are contributing flow.

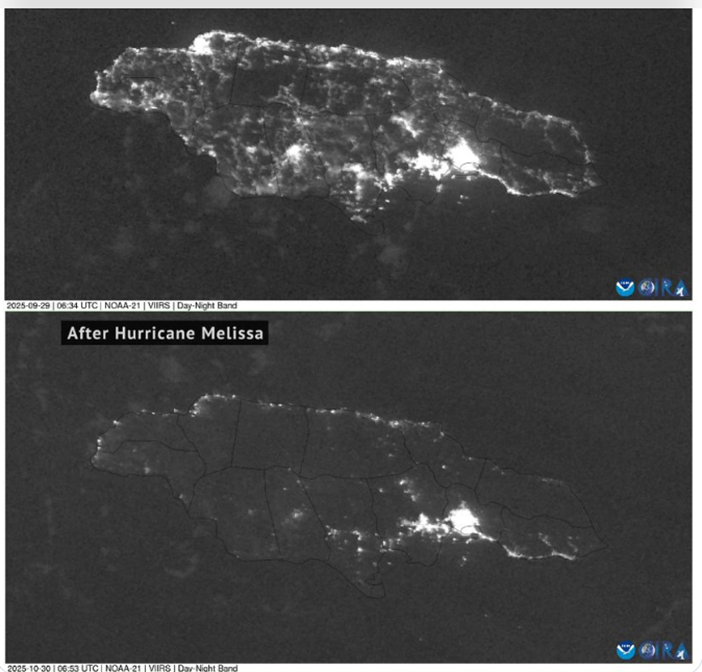
Roughly seven out of ten grid customers continue without power (see before/after satellite views below). CAT5 impacts obviously tangled the distribution network island-wide. In the hurricane’s direct path over western Jamaica a complete re-build of the distribution network will be needed in many places. I have not yet seen a credible assessment of impacts on Jamaica’s transmission network. My guess is that yesterday’s efforts were focused on triage opportunities for restoring grid power to high priority facilities and assessing/planning how to prioritize next steps. Anywhere the transmission network has failed will receive high priority attention. While transmission networks are recovered there will be slow progress in reconnecting the distribution network.

The resilience of food and fuel supply chains are especially (obviously?) crucial in case of a long-term grid outage. If the port was not receiving and discharging food and fuel — “feeding” survivors, emergency generators, water systems, and transportation — the risk of thousands not surviving Melissa would be much higher than it is today with flow disrupted but persisting. (More and more.)

UPDATE, November 1, 0700 Eastern Time: I am not yet finding or hearing well-documented assessments related to Jamaica’s electrical grid. I am aware of various reports that claim up to seventy percent of the transmission network has been seriously damaged. This is plausible, but should not be accepted without much more validation. Pre-Melissa Jamaica’s grid consisted of about 750 miles of high voltage transmission lines and about 12,000 miles of distribution lines (12-24 kV). Seventy percent of the distribution network being down strikes me as consistent with other evidence. I suppose a high proportion of longer-distance transmission lines might transit east to west through the worst impacted north-south corridor. But I don’t want to accept such a dire estimate for the transmission network — and related recovery calendar — without much more corroboration.

Demand demonstrates persistent pull

According to the Bureau for Labor Statistics, “The Consumer Price Index for All Urban Consumers (CPI-U) increased 0.3 percent on a seasonally adjusted basis in September, after rising 0.4 percent in August… Over the last 12 months, the all items index increased 3.0 percent before seasonal adjustment… The index for gasoline rose 4.1 percent in September and was the largest factor in the all items monthly increase, as the index for energy rose 1.5 percent over the month. The food index increased 0.2 percent over the month as the food at home index rose 0.3 percent and the food away from home index increased 0.1 percent.” See chart below.

As a general (if imprecise) rule, when and where supply is roughly the same, higher prices imply increasing demand (or at least persistent demand, despite price increases). During September US fuel and food supplies did not experience significant declines. Producers, distributors, and retailers have experienced increased costs (here and here and here) that are gradually being folded into higher retail prices. Bloomberg explained, “Goods prices, excluding food and energy commodities, rose at a slower pace in September, dragged down by cheaper prices for used cars. Categories that are more exposed to tariffs, including household furnishings and recreational goods, advanced. Apparel prices climbed at the fastest rate in a year.”

So far, many consumers have continued to consume. A recent analysis by the Bank of America Institute found, “Total credit and debit card spending per household increased 2.0% year-over-year (YoY) in September, compared to 1.7% YoY in August… Middle- and higher-income households have stronger wage growth but higher-income spending is likely also benefiting from wealth effects. The discretionary spending of the top 5% of households by income tends to widen compared to the middle-income cohort when the S&P 500 is rising.”

Persistent effectual demand motivates persistent effective supply.

Free Trade Dialectics

The Free Trade thesis of the late 20th Century is being challenged by President Trump’s tariff-positive antithesis and much more autarkic vision for the 21st Century United States. This thesis-antithesis clash has not produced a clear new synthesis — at least not yet. There are vigorous efforts to restore and preserve the prior thesis. Below is a one minute commercial produced and placed by the provincial government of Ontario, it features an edited version of 1987 remarks by President Ronald Reagan explaining the benefits of free trade. President Trump has responded by canceling trade negotiations with Canada’s federal government. Supply Chain Resilience fit for the thesis is not well-calibrated with the antithesis. While waiting for a synthesis to evolve, supply chain operators are placing their own bets.

Feeding Gaza

The estimated population of Gaza remains above 2 million. Some suggest up to 2.4 million people could still be resident in the roughly 50 miles long by 25 miles deep strip extending along the Mediterranean between Egypt and Israel.

Since the October 7, 2023 Hamas attacks on Israel, flows of food, fuel, and other essentials into Gaza have been disrupted, diminished, and often nearly non-existent as a result of military operations. This has resulted in wide-spread hunger and malnutrition with related morbidity and death (here). In the last two weeks a fragile ceasefire has allowed for increased flows and urgent efforts to surge flows. In the last three to five days flows have increased from a trickle to an intermittent stream, still insufficient for the population.

Upstream sources of food and fuel have long exceeded available flow capacity. Substantial food/fuel stocks and rolling-stock to deliver are available within fifty miles (e.g., the Egyptian port of Al Arish is roughly 30 miles west. Metro Jerusalem is 50 miles Northeast. See second map below).

On October 9 — leaning into the emergent ceasefire agreement — Tom Fletcher, United Nations Under-Secretary-General for Humanitarian Affairs and Emergency Relief Coordinator, noted the following priorities:

…we will scale up the provision of food across Gaza to reach 2.1 million people who need food aid and around 500,000 people who need nutrition. Famine must be reverted in areas where it has taken hold and prevented in others. So we will be distributing in-kind rations. We’ll be supporting bakeries, community kitchens. We’ll be supporting herders and fishers in restoring their livelihoods. And we will be providing cash for 200,000 families to cover basic food needs and bolster their ability to cope, and also to give them their sense of – and this is so important – dignity and agency by choosing their own food from the markets… we’ll increase nutrition screening, and we’ll provide nutrition supplies, including high-energy, nutrient-dense food items for the most vulnerable groups, including pregnant and breastfeeding women and children and adolescents. (More and more)

While significant upstream supplies have always been available close-by, food depots in Gaza have seldom had much beyond a Just-In-Time flow capacity due to restricted inbound and outbound flows. But the most serious flow impediment has been often absent midstream to downstream flows. Lack of secure points-of-distribution accessible to the population and inaccessible “last mile” supply routes have constrained discharge of whatever food, fuel, and other resources made it across the border into Gaza (see first map below).

With the ceasefire still holding, progress on downstream discharge capacity is improving. For example, the UN Office for the Coordination of Humanitarian Affairs (OCHA) reports that:

… as of Sunday (October 19), food parcels were being distributed at over two dozen locations in Deir al Balah and Khan Younis, reaching more than 15,000 households there. These food parcels contain various nutritious food items, including rice, lentils, beans, chickpea paste, tomato paste and fortified sunflower oil. Partners are working to expand the number of distribution points to ensure that people can access food closer to where they live. Also on Sunday, 21 partners prepared and delivered some 944,000 meals through 178 community kitchens. This is an increase of some 286,000 daily meals in about three weeks. Sunday’s total included 69,000 meals from 13 kitchens in the north, as well as 875,000 meals from 165 kitchens in the south and central areas.

The downstream infrastructure necessary to surge flows will take time to re-establish — especially in a context where much of the built environment has been destroyed (here). There is also continuing concern regarding non-structural limits on inbound flows to Gaza (here and here).

Currently intense demand is widely dispersed. Supply capacity remains concentrated and too static to find, much less fulfill, demand. Downstream flows are spotty, irregular, and sparse. Push is not anywhere close to matching pull velocity. A Civil Military Coordination Center has been created to monitor and facilitate improved push velocity (here and here).

Much more still to come… we can hope.

The map above reflects pre-ceasefire (May 2025) conditions. Cargo crossings remain limited to locations noted.

The map above indicates principal upstream sources of flow ala 2024. These remain mostly accurate in October 2025. Not all Gaza crossings and discharge possibilities shown have reopened since the ceasefire.

Inbound slows (as intended)

Residents of the United States are the most high volume, high velocity consumers in the world. China’s factories are the most high volume, high velocity suppliers in the world. Demand and supply are engaged in an increasingly serious spat with already volatile outcomes.

The Financial Times reports, “US Treasury secretary Scott Bessent has accused China of trying to hurt the world’s economy after Beijing imposed sweeping export controls on rare earths and critical minerals, hitting global supply chains… Maybe there is some Leninist business model where hurting your customers is a good idea, but they are the largest supplier to the world,” he added. “If they want to slow down the global economy, they will be hurt the most.”

President Trump wants the United States to make more stuff again. He wants to recover US manufacturing capacity and jobs — especially related to producing goods perceived as fundamental to national security.

Trump administration policy and practice can be framed by three goals:

Discourage imports. Tariffs complicate and constrain supply by increasing both direct and indirect costs — eventually prompting increased prices, reduced import sales, and more opportunity for domestic producers. For example, last week a major European maker of farm equipment “has been forced to pause exports of large equipment to the US because of “alarming” and little-known new tariffs that are hitting hundreds of products” (here).

Encourage domestic manufacturing. Tax incentives, tariff waivers, and direct government investment are being deployed to support old and new industrial sectors perceived as fundamental to US economic and military essentials. Examples are here and here and here and here.

Generate federal government revenues: Tariffs are currently conceived as a sort of slotting fee that non-US suppliers pay for the privilege of accessing the US consumer. Tariffs support the two prior goals and generate much needed revenue for a high-deficit federal budget. Through the end of September more than $200 billion in tariff revenues were received (here and here).

China’s global exports grew over eight percent in September, while its flows to the United States declined by more than a quarter (here and here).

Euronews reports, “German exports to the United States have fallen for the fifth consecutive month, reaching their lowest level in nearly four years, as the impact of tariffs imposed by US President Donald Trump continues to reverberate across transatlantic trade” (more and more).

For the last five months postal parcel traffic to the United States has fallen by 70 percent (here and here).

There is demonstrable progress in discouraging imports. For all of 2025 US tariff revenues could easily triple 2024 totals (or more).

But increasing import costs and reducing import volumes are easier — and especially quicker — than rebuilding domestic manufacturing capacity (here) or opening more rare earth mines (here) or supporting industrial innovation (here and here and here). There is a real risk of reduced product availability and higher prices for a range of goods, prompting negative economic outcomes and related political feedback in the United States. There are also risks of trade retaliation impacting US exporters (here and here).

Meanwhile in China, economic growth has been sluggish — at least compared with the quarter-century before 2008 (here and chart below). An extended property crisis, deepening deflationary pressures, and reluctant consumer demand are mutually reinforcing and tough to undo. China’s manufacturing oversupply is a domestic as well as an international challenge (more).

The US is an extremely consumption-oriented economy. China is an extremely production-oriented economy. This could be — even has been — complementary. But the US and others increasingly perceive China to be economically predatory — and such predation could extend beyond economic competition. China perceives that the United States is being arbitrary and aggressive in restraining China’s competitive prowess and national achievements.

Starting in late September a month-long US-China detente deteriorated (here and here and here). Now China is threatening to cut-off global purchases of rare earths (more), while the US is threatening to cut-off China’s ability to sell much of anything in the United States (more). If either threat is consummated, the consequences will be tough to unwind. Several supply chains are being whip-sawed by these tensions, measures, counter-measures, and uncertainty. Trade flows have already been seriously disrupted. Friction is building.

The strategic value of anticipatory Supply Chain Resilience is certainly being demonstrated. But many of the best strategies will be existentially challenged if this tit-for-tat unfolds into mutually assured destruction of demand and supply networks shared over the last four decades.

Source: World Bank

Data informed or data driven?

On October 1 ADP reported continued softening in the US labor market. CNBC explained, “Private payrolls saw their biggest decline in 2½ years during September, a further sign of labor market weakening that compounds the data blackout accompanying the U.S. government shutdown.”

On October 3 the Institute for Supply Management reported, “In September, the Services PMI® registered an unchanged reading of 50 percent, 2 percentage points lower than the August figure of 52 percent. The Business Activity Index moved into contraction territory in September, registering 49.9 percent, 5.1 percentage points lower than the reading of 55 percent recorded in August. This is the first time the index has entered contraction territory since May 2020.” (Here is the complete report.)

Both reports use credible data sources to reach plausible judgments regarding the current direction of travel for demand and supply. The similar direction found by two independent reports reinforces claims of validity. These retrospective indicators are suggestive–but far short of conclusive–for future speed and direction of travel.

The current hiatus in US government data outputs is a meaningful moment to reflect on the role and limitations of data — and related issues of fundamental epistemology and decision-making.

I conceive a ladder of learning consisting of:

Step 1: Occurrence, duration, and variation are simultaneously distributed across space.

Step 2: Observations of Step 1 from different spatial and temporal angles of more or less scope.

Step 3: Qualitative and quantitative measurements of Step 2 that generate usable data.

Step 4: Organizing data by various characteristics to generate targeted, often purposeful information.

Step 5: Contextualizing information by reference to dependent, interdependent, and independent variables to generate knowledge.

Step 6: Carefully and creatively applying knowledge to solve a problem or engage an opportunity.

Whether this ladder ascends to wisdom or descends into foolishness depends on the accuracy and validity of each Step 2-6 and, in my experience, especially on the quality of Steps 5 and 6.

Step 1 is infinite in scope. Subsequent steps attempt to narrow scope to fit human capacity for understanding. Steps 2, 3, and 4 are usually radically reductionist. Observations can be equally valid yet contradictory. Measures can be accurate but exclude crucial aspects of occurrence. Data can be thoughtfully and carefully curated while unable to elucidate known-unknowns, much less unknown-unknowns, or even (especially?) unknown-knowns. Contextualization can be highly contentious as echoes of infinity are reintroduced for purposes of reliable knowledge-making.

When widely accepted that the ladder of learning stands on flooded soggy soil and leans against a rather wobbly wall, the step-wise process can be helpful. Each step offers probabilistic insights for decision-makers to consider, but the ladder does not lead anyone into the delusion of risk free certainty. Problems will escalate and accelerate if certainty is perceived or claimed.

So, more data is better than less. Continued access to well-validated longitudinal data, with known limitations, is particularly helpful (such as BLS, BEA, and Census data). Honest, self-critical, and courageous decision-makers ready to boldly test, but not over-commit, to data-informed hypotheses can accelerate toward wisdom and divert from foolishness. Resilience is most likely to emerge from a humble relationship with reality.

The current absence of government data is unhelpful. There are other sources of data. Quality and quantity of data matter. But the quality and care of decision-making matters more.

Supply Shocks

Anyone who reads four or more of these blog posts will recognize I am preoccupied — obsessed — with demand. My understanding of substantive, sustainable Supply Chain Resilience is tightly related to demand dynamics. It is my experience that high-capacity supply chains are very adept at adapting when significant effectual demand is pulling. This bias has served me well. Again and again demand dynamics (or lack thereof) is a meaningful frame for observing — and discerning — complex reality. But bias is bias. Each of us need to recognize our biases if we have any hope of self-correction when fundamentals begin to shift. In the video below, Greg Daco, chief economist with EY, explains why he is currently concerned with supply shocks. Give him at least two minutes to make the case.