Month: September 2025

August Demand and the Horizon Ahead

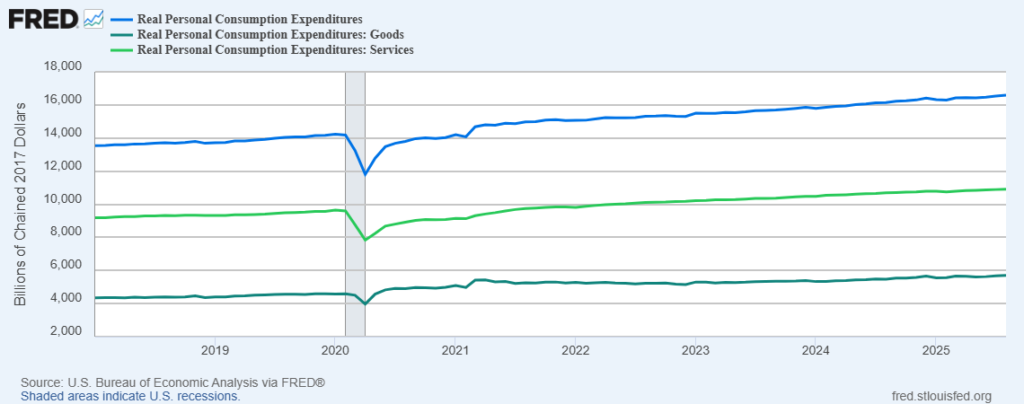
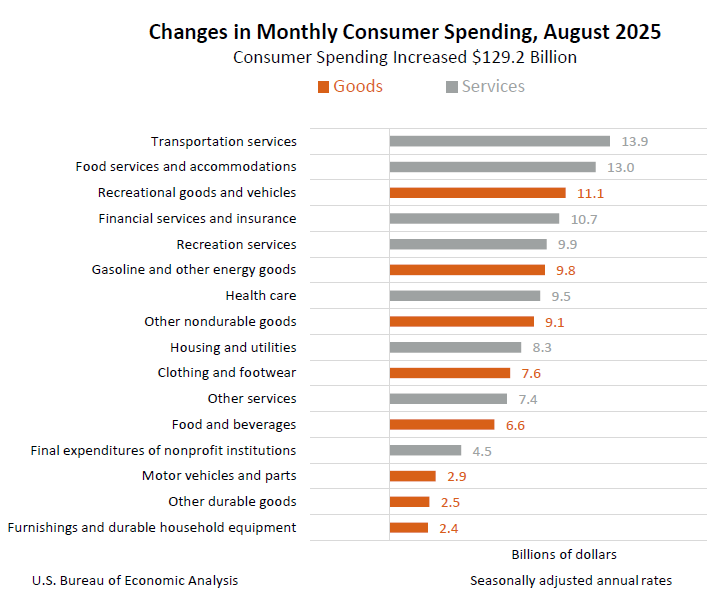
According to the Bureau of Economic Analysis, during August US consumers earned and spent a bit more. “Disposable personal income (DPI)—personal income less personal current taxes—increased $86.1 billion (0.4 percent) and personal consumption expenditures (PCE) increased $129.2 billion (0.6 percent).” These are nominal, not-inflation-adjusted measures. The first chart below shows the real, inflation-adjusted, expenditure pattern.

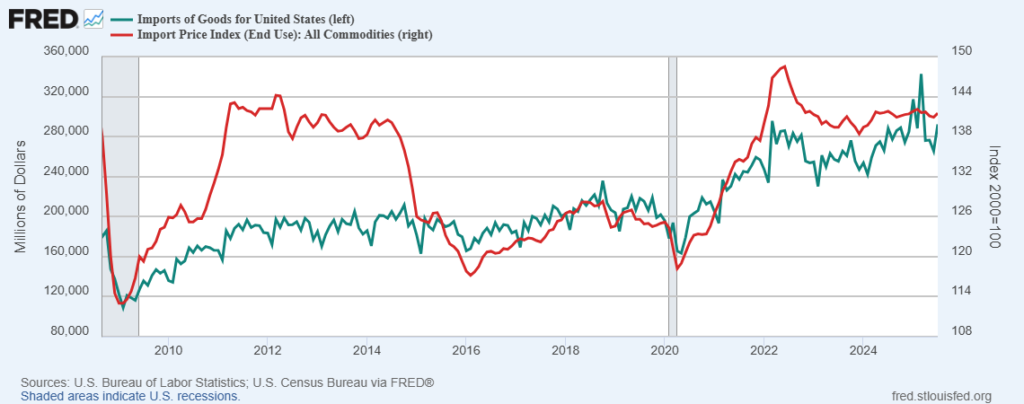
This volume and velocity of demand-pull can sustain strong supply-push, even in the context of significant flow volatility (e.g., here and here and here and here).

In its reporting on August Personal Consumption Expenditures, Bloomberg included, “Services were the driver behind the advance in PCE inflation while goods prices were tame. In particular, prices for recreational goods and vehicles, major appliances and household supplies all declined. Such discounts helped propel spending in those categories.”

The Washington Post explains, “The wealthiest Americans have been doing even better than previously thought — and are driving a consumer spending surge that has been fueling the U.S. economy as they splurge on travel, hotels and dining out, newly-revised economic data shows.” (More and more.)

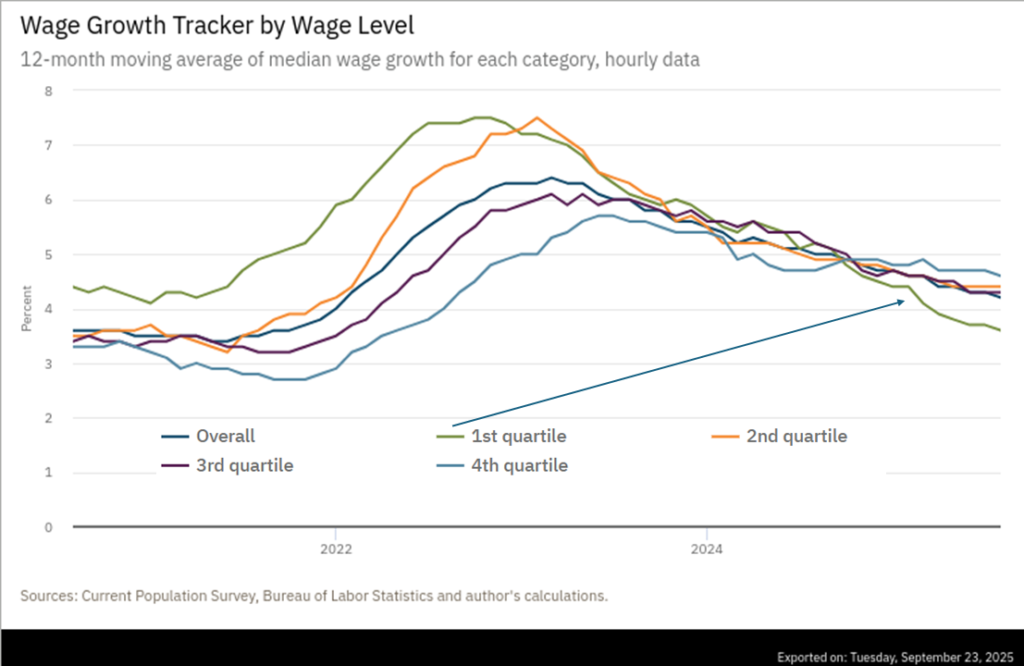
US consumer spending has been described as “exceptional“, “stubborn“, “surprising“, and “crazy“. But President of the Richmond Federal Reserve Bank, Tom Barkin, says, “… recent data show consumers resumed spending over the summer, especially those with higher incomes. And why wouldn’t they? Unemployment is still low, nominal wages are still increasing, and asset valuations are near all-time highs.

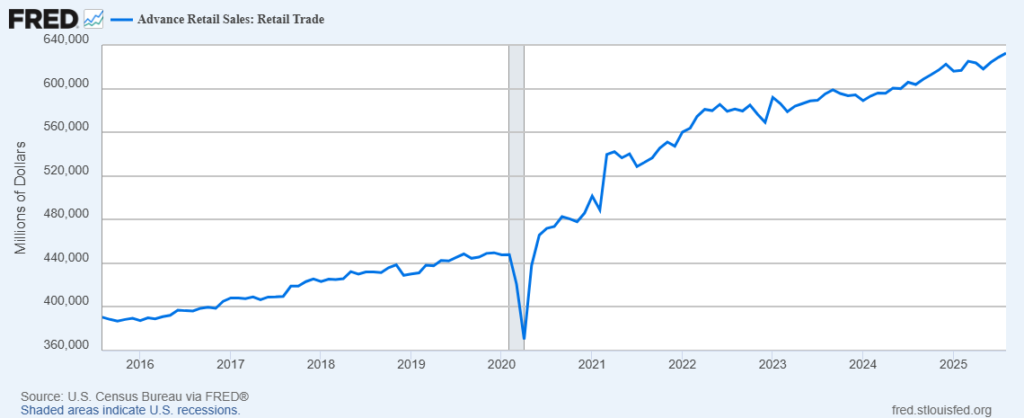
There are — and have been — indicators of lower spending ahead (here and here). But, so far, actual consumer behavior has earned the adverbs used above. The soon-to-be-upon-us holiday season should be informative. Tariff related price increases seem to be trickling into retail prices. Credit card spending is down from last December (if still historically high). Since the pandemic, consumption by the upper one-fifth of US income earners has seldom shown much sustained restraint. If restraint surfaces the economic reaction — perhaps over-reaction — could be considerable.

+++

At about the same time I posted what’s above, Bloomberg published a very helpful overview of the global context for August PCE. As I wonder and worry about how long US consumers can continue their recent spending habits, the authors of the Bloomberg report see continued positive potential. “The US economy grew in the second quarter at the fastest pace in nearly two years as the government revised up its previous estimate of consumer spending. The third quarter is also looking solid, with recent reports illustrating resilient consumer spending and business outlays for equipment…” especially in comparison with other major economies.

Coming shifts in food demand

In 2024 a bit more than twelve percent of US residents — roughly 42 million Americans — received benefits from the Supplemental Nutrition Assistance Program or SNAP. Last year close to $100 billion in federal funding was spent on SNAP.

Policy adjustments in the One Big Beautiful Bill, passed by Congress and signed by the President on Independence Day, seek to reduce SNAP expenditures, potentially twenty-five to thirty percent.

SNAP beneficiaries are not evenly distributed geographically or as demographic proportions. According to the US Department of Agriculture, in 2024, “the share of residents receiving SNAP benefits in each State ranged from as high as 21.2 percent in New Mexico to as low as 4.8 percent in Utah. In 36 States, the share was between 8 and 16 percent” (more). Eligibility and participation rates vary considerably by population area. The new policies are aimed especially at tightening eligibility. More rigorous eligibility requirements also tend to reduce participations rates — even among those who are eligible.

SNAP beneficiaries can be a crucial slice of the consumer market for many grocery retailers. While low-income urban neighborhoods have concentrated populations of SNAP beneficiaries, whole counties with high proportions of SNAP beneficiaries is mostly a rural characteristic. Please see the map below (this map depends on decade-old data, but changes in population proportions have not been dramatic). According to Grocery Dive, “Some grocers will face harder hits from the SNAP changes than others. While SNAP accounts for roughly 12% of grocery sales in the U.S., it can account for less than 1% of sales at a higher-end grocer and more than 60% at a grocer serving low-income urban or rural areas…” Many of the retail locations most dependent on SNAP consumers are already among those with the lowest margins and most vulnerable to failing. Many of these retail outlets serve expansive rural areas.

States have various options for how new SNAP eligibility requirements will be implemented and measured (here and here and here). Results will vary and so will market (and presumably political) responses. The longer-term impact on grocery demand and related implications for supply will not be clear for another six to nine months — and even then, this is not a closed system where SNAP variables can be cleanly separated from other demand factors.

Still, the forthcoming SNAP reductions will further complicate food access by the most financially constrained US households. Food banks and other sources of local emergency assistance are already unable to fulfill current demand (here and here and here and here). Wage growth among the lowest paid quarter of workers is falling (see second chart below and more) even as grocery prices have continued to increase.

But the intention is to reduce SNAP-supported demand, reduce government expenses, and encourage greater self-reliance. All else being equal (which will not be the case), more rigorous eligibility requirements will incrementally reduce grocery demand overall and dramatically reduce effectual demand by the most vulnerable (both vulnerable consumers and vulnerable retailers). In high volume, high velocity demand and supply networks it is the peripheries — geographic and proportional — that are most likely to be shed. The more streamlined supply chains that emerge are usually marginally more resilient. But already underserved communities and individuals are often left profoundly less resilient.

Strong August Retail

US retail sales increased in August, even more than expected. See chart below. Bloomberg initially characterized the outcomes with, “consumers are still spending even as tariffs boost the cost of some goods, sentiment remains subdued and the labor market shows signs of faltering. Though wage growth has cooled, many workers’ pay gains continue to outpace inflation, and others, particularly the wealthy, are benefiting from a stock market rally.” This sort of demand velocity should be sufficient to continue recent high volume flows.

Flows Fluctuate

First half 2025 US import volumes were choppy but higher overall (see green line on the chart below through end of July). Since a record-setting March, inbound flows have slowed but remain at historically high levels. According to the global shipping analyst Descartes, “In August 2025, U.S. container imports reached 2,519,722 twenty-foot equivalent units (TEUs)—the second-highest monthly total this year. Volumes were 3.9% below July but 1.6% above August 2024.”

The first half surge has been reasonably explained as importers attempting to build inventory before increased tariff rates hit hardest. A second half trough in imports is predicted — and may have started. Descartes observes that in August, “China-origin imports eased to 869,523 TEUs, down 5.8% from July and 10.8% below August 2024.” Seven out of the top ten US ports experienced July to August declines in container volumes unloaded, with an overall national slowdown of just over four percent month to month.

Prices being paid for imports have increased. But so far prices have lagged tariff-related cost increases. According to the Yale Budget Lab as of early September the average effective tariff rate had reached 17.4 percent. But average end-user prices for these imports have increased at something closer to four percent (here). Given the size of these flows, rapidly shifting action/reaction, and policy volatility precise measures should not be expected. But the direction of travel is clear enough and the longer average tariff rates remain this high the more likely price increases will accelerate. In some cases — examples include coffee and some car parts — prices are already up by double digits (more and more and more and more).

While long-duration increased costs will eventually be followed by increased prices, the full impact on demand is difficult to anticipate. For price sensitive consumers spending will obviously be further constrained. But almost half of US consumption is generated by the wealthiest ten percent (here and here). How will those with the most discretionary income shift their purchasing patterns?

In the chart below the red line is the import price index since the Great Recession. Between 2011 and 2014 significant price increases did not significantly reduce demand. But most of this price increase was for fuel-related imports, then even more essential than today for meaningful participation in earning or spending. The post-pandemic price increase for imports shown was much more broad-based, but accompanied by temporary increases in incomes and savings. Will a broad-based increase in 2025-2026 import prices — without significant increases in discretionary incomes — suppress purchases of imports and overall US consumption?

The demand response depends on how high the price goes on which products for how long. For a quarter-century I have been an enthusiastic fan of Starbucks green tea Frappuccinos: “non-fat, no whip, no classic, ten scoops of matcha” (instead of the normal five). I considered the large size (venti) an expensive indulgence at $5, but I still bought it about once a week, sometimes more. Recently Starbucks began charging a dollar for each extra scoop (here and here). I have exercised my discretion. I no longer buy it. I have not found a replacement product. My credit score recently dropped one point because of a sustained decline in spending (not just at Starbucks). How much is matcha a metaphor for other discretionary consumption expenses? We are about to find out.

In my experience high volume, high velocity supply chains are resilient to most disruptions and even considerable destruction, except for sustained destruction of demand — whatever the cause.

Tariffs: Three Microeconomic Analogies

Several recent tariff-related conversations have ended-up mostly focused on presumptive motivations for radical shifts in US tariff policy. Supply chain executives want to discern the why behind the what to better frame their own tariff-related decisions. If they can better understand where these tariffs are trying to take us, these executives hope they can develop more resilient supply chain strategies.

I have offered previous explanations of the still emergent tariff policies (here and here and here). But in recent weeks I found supply chain executives much more receptive to a microeconomic framing of these policies.

While President Trump’s approach to tariffs is informed and executed by many others, it is his personal understanding, vision, and enthusiasms that deliver the most reliable “motivational framework” for this administration’s tariff policy. The President’s particular experience in real estate development, branding, and measuring success have significant influence on how much higher baseline tariffs are being conceived and deployed. Three sources of microeconomic leverage are key: 1) product differentiation, 2) premium pricing, and 3) cash flow. Here’s the gist of each:

Product Differentiation: President Trump’s father, Fred, was a successful housing developer in Brooklyn, Queens, Staten Island, Norfolk (Virginia), and elsewhere. Fred’s company constructed, sold, and rented thousands of homes and apartments subsidized by the Federal Housing Administration. Late in the Depression a Brooklyn newspaper called Fred Trump, “the Henry Ford of the home building industry,” developing mass market products at mass market pricing. Over time Fred Trump owned and operated sufficient low and middle income housing and related commercial properties to generate many millions in cash flow. Donald Trump perceived that even better profit margins and more cash flow could be generated serving the aspirations of higher income consumers with real estate that reflected those aspirations. While the father continued to operate in the outer boroughs, his son focused on developing upscale hotels, residences, and offices in Manhattan and diverse formats worldwide. In Midas Touch (2011), Mr. Trump wrote, “building a brand may be more important than building a business.”

Premium Pricing: A luxury brand effectively tethered to the aspirations of a sufficient number of affluent consumers can command profound pricing power. The average purchase price per square foot in Manhattan is roughly $1600, while in Staten Island the average is under $500. A prestige residence in the right Manhattan neighborhood can be priced at $4000 SF and much more. Why build Ford Model A’s when you can sell Pierce-Arrows? The investment costs may be double or triple, but the return on investment can be ten-times or better. In 2024 a $1 million initiation fee was charged for membership in the Mar-a-Lago Club. The Trump Organization has developed nineteen golf properties with similar business models.

Cash Flow: Positive cash flow is a fundamental measure of financial health for any person or enterprise. The more cash flow, the more opportunity for debt-financed growth , self-financed growth, and/or profit taking. In mid-August 2025 President Trump emphasized, “They found last month, as you saw, $25 billion of excess cash flow. They say, where did it come from? I said, I’ll tell you where it came from. It came from a place called tariffs…” (more and more).

In many ways President Trump views baseline tariffs as initiation fees for outsiders to “join” the US economy. (The reciprocal and sectoral tariffs involve additional motivations.) The United States is the ultimate high-end retail destination. US consumers have more and consistently spend more of their disposable income compared to any other large economy (here and here and here). For those with something to sell, the United States is a good place to operate. Charging this “non-resident membership fee” improves US government cash-flows — at a time when the US government’s debt load needs the extra cash. Mr. Trump also tends to view trade deficits as the macroeconomic equivalent of microeconomic negative cash flow. Adam Smith and David Ricardo would disagree. This worldview has nothing in common with what motivated the Bretton Woods system of international trade emerging from the second world war.

President Trump’s motivations for baseline tariffs are much more consistent with mercantilist worldviews of 16th Century Venetians or Queen Elizabeth I of the not-yet-United Kingdom or even of her successor King George III. This original mercantilism could never have nurtured the sort of economic growth experienced over the last two centuries. It is, however, possible — risky but not unreasonable — to deploy the comparative advantage of US consumption patterns in an effort to improve US government revenues and even reclaim some domestic manufacturing capacity and jobs. Pay the non-resident membership fee or buy a residence (i.e., build a US factory) to set up your sales table in this very rich bazaar. (President Trump is also inclined to use reciprocal tariffs as a means of sanctioning “members” that he perceives are behaving unclubbably; see India.)

Will this comparative advantage survive this sort of deployment? So far, higher-income US consumers are continuing to spend (here and here and here). Middle and lower income consumer spending has become more constrained, but not yet enough to tarnish the transactional glitter. Current comparative advantage in large part depends on continued spending by, at least, the top one-fifth of US households. The top quintile’s capacity and confidence to spend is not unrelated to the economic health of the remaining 80 percent. Staples inflation, the dollar’s exchange rate, wage increases, and job stability will all have an influence on that “excess cash flow” celebrated by the President . The 2025 end of the year holiday season will be a significant test of how well US consumer spending persists. Will the US economy’s “product differentiation” remain sufficiently exceptional to justify premium pricing and maximize positive cashflow? If so, supply chain executives should treat this as their strategic context for most of 2026 and well-beyond. If not, I have no predictions (yet) for what is most likely to come next.

+++

On August 29 the US Court of Appeals for the Federal Circuit found that current baseline tariffs and some reciprocal tariffs are illegal (here and here and here and here). If this decision is not overturned by the Supreme Court, current policy and processes are likely to become even more complicated. But I perceive the President’s existing motivations will persist as long as he views tariff revenue as positive cashflow. As a result, other methods will be found to charge similar and related “membership fees”.