Author: Philip J Palin

Vigilance

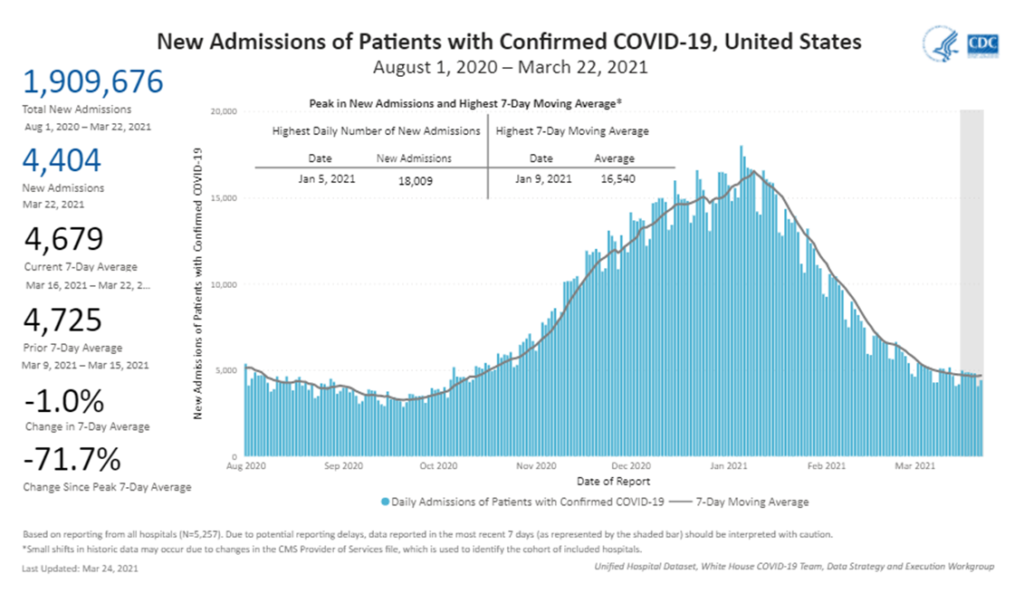
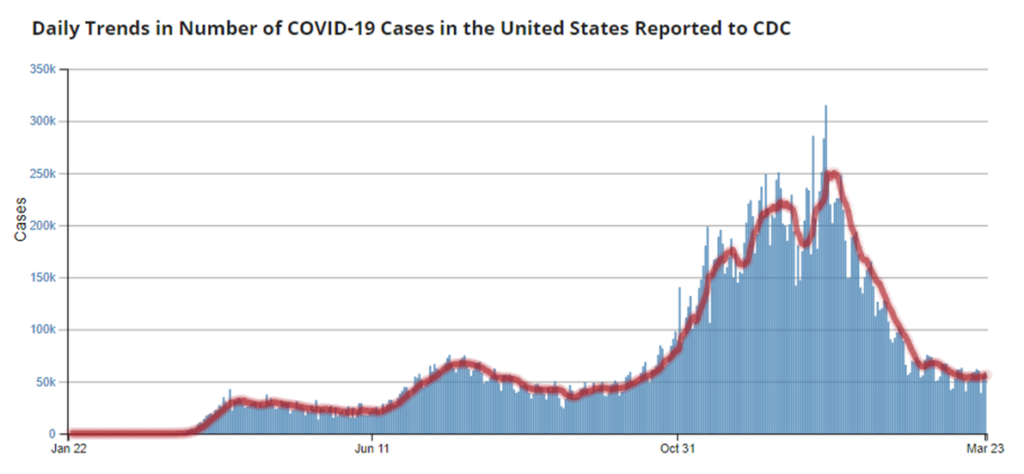
Italy has toughened Non-Pharmaceutical Interventions as infection rates increased ten-percent over last week. A sharp increase in German case counts has also been seen. ICU beds are close to full in Brazil. US coronavirus daily case counts and covid-19 death-rates continue to decline. (Hospitalizations are now more difficult to track). Variants are more prevalent in the United States, but not — yet — the source of a significant surge in disease and related demands on the US healthcare system.

Better Days?

As far as I can tell, the current context for covid-19 in the United States is constrained and becoming more constrained. Our current condition is better than I expected eight weeks ago or even two weeks ago.

Given the current status of virus mutations, reasonable projections for vaccination rates, and continued Non-Pharmaceutical Interventions, it now appears likely most of the US can avoid another deadly contagious spike. Each additional day that covid deaths and hospitalizations decline, the less risk of resurgence.

Given past behavior by the coronavirus, my concern was not misplaced — and vigilance is justified. The virus will continue to evolve and will exploit any openings we provide.

But here’s an assessment of what has happened (and not happened) since late 2020.

The variants appearing in the United States have — so far — not been as virulent as I feared. While the variants are certainly spreading, there has not (yet) been the rapid increase in disease seen in other places. There is also accumulating evidence that current vaccines are largely effective suppressing transmission of known variants. So, as the number of Americans vaccinated continues to advance, the variant risk should decline. Well into late February I was worried that the US coronavirus testing process might be too weak to recognize a variant take-over and warn us of threats to the healthcare system. But given the continued decline in hospitalizations (more), I have finally decided that — until data demonstrate otherwise — it is reasonable to give at least as much attention to optimistic options as other options.

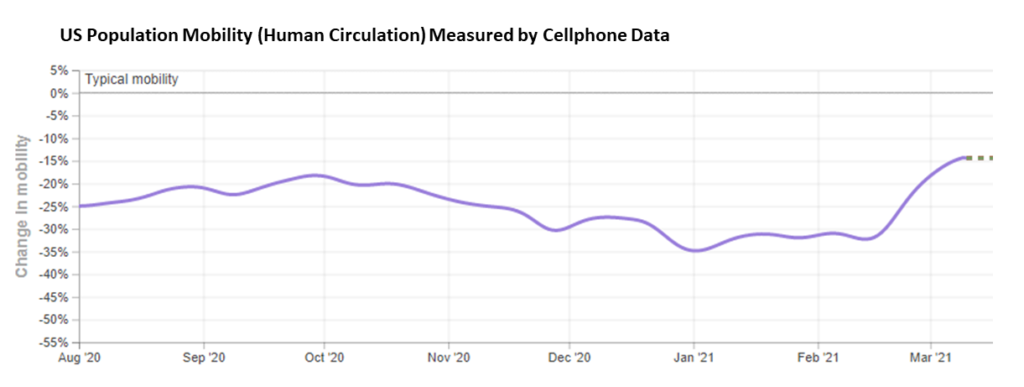
Further, the US population has been more self-restrained than I perceived early in the New Year. In late September US mobility was about 18 percent less than pre-pandemic. Over the final three months of 2020, mobility decreased to about one-third less than pre-pandemic — despite Halloween, Thanksgiving, and Christmas comings and goings. Over the same 90-some days use of facial coverings is estimated to have increased from about 64 percent to about 76 percent. There is now evidence that as more Americans suffered confirmed cases of covid-19, related hospitalizations, and death, millions of Americans responded by reducing their circulation and increasing prophylactic behavior. Even edging into mid-March, mobility statistics appear to be holding at about one-quarter below pre-pandemic levels.

The risk persists.  We absolutely should continue to look for hot spots, especially of vaccine-resistant variants. But with reduced population circulation, individual face-to-face restraint, and with each additional vaccination, the United States is giving the virus less opportunity… and improving our future opportunities.

Answering Vaccine Distribution Questions

In preparation for a March 4 interview the following questions were sent ahead.  To organize my own thinking, here is my written “homework.” 

What does the vaccine distribution strategy look like from a supply chain perspective? i.e., How does it differ from other types of supply chains?

The US vaccine distribution strategy has been — basically still is — very supply-oriented, not demand-oriented.  It is as supply-oriented as many pre-1970 wholesale markets. This is dramatically different from contemporary high volume, high velocity supply chains.  Where today the biggest players compete over who can best understand — and even own — demand. US vaccine distribution has been, at best, a Sears distribution strategy… and Sears before Walmart was recognized to be an existential threat.  Today supply chains are demand-driven, data-driven, fluid-dynamic networks.  Vaccine distribution, in contrast, has divied up available supply and pushed it out  toward counties, cities, and towns, depending on excess demand to do the rest.

In some ways this makes sense. Less than nine months ago there was no scalable production capacity for these vaccines.  It was obvious initial demand was going to far exceed supply well into 2021.  But as supplies have continued to expand we are beginning to see the limitations of this supply-oriented approach.  By the end of June I bet we will be worried about lack of demand for available supply because of various kinds of vaccine hesitancy.

What are some of the challenges identified at the beginning of the process, for example in late 2020, before vaccines started shipping? How has the industry tackled some of these complications? For example, the low temperatures required by the Pfizer vaccine.

On August 27 the CDC asked states and others to begin planning for vaccine distribution as early as November 2020.  Planning scenarios and guidance were provided, including the potential need for double-doses and ultra-cold storage.  The planning scenarios were obviously, if implicitly, based on the possibility of early approvals for Moderna and Pfizer products.  As it turned out, these products were the first to receive Emergency Use Authorizations, but not until mid-December.

Pfizer — already one of the most capable pharma distributors on the planet — decided to deploy its own distribution capabilities.  Moderna — a much less mature enterprise — is more dependent on the US Government distribution network managed by McKesson.  Both the Pfizer and Moderna distribution efforts involved a number of sub-contractors, including usual suspects like UPS and Fedex, that were involved in detailed preparations since this summer.

At the distribution level — let’s say from the filling/finishing facilities to a hand-off to each of the States — the cold-chain and other novel constraints were expensive and logistically non-trivial, but clearly within the capacity of the contractors and the US national freight network.  Vaccine packages are small and uniform. Flow has increased gradually.  Certainly distribution has required significant upfront investments, there have been some serious hiccups, and no doubt there have been late nights and urgent interventions. But outputs — outcomes — have largely been as planned and projected at the distribution level.

Then at the wholesale level (retrieving that pre-1970s paradigm), once the handoff to the states happened. outcomes have varied dramatically.  The Pfizer vaccine began to ship on December 13Moderna began shipping seven days later.  Three weeks after flows started, we had a national Vaccine Utilization Rate of about 30 percent (more).  Some states, localities, and hospital systems were moving inventory much more quickly and others were much slower.  Very high demand, but only about 30 percent of available inventory was being consumed.  Since mid-February our national Vaccine Utilization Rates have been above 75 percent.  But variation is still significant.  During the first week in March the National Vaccine Utilization Rate was over 75 percent while one state was at 68 percent and two others had broken 90 percent.

What is needed to ensure the most reliable vaccine distribution? 

There are a whole host of requirements for reliable vaccine distribution, just as with any pharmaceutical product and many perishable products of all sorts. But fundamental to reliable vaccine distribution are reliable projections of demand and supply.  With reliable projections of demand and supply then the other supply chain inputs can be appropriately secured and sequenced.  Without substantial confidence relating to supply and demand, the vaccination network has sputtered and stalled in ways that tend to be amplified across the network.  There has been a major effort made to provide states a three-week sure-thing window on forthcoming flows.  That was supposed to begin on Valentines Day, but the Polar Vortex had other plans. It is, however, my impression that by late February “guaranteed minimums” were being regularly delivered and, in fact, our “wholesalers” at the state and local level have had challenges because in early March some deliveries exceeded those minimums.

What is Operation Warp Speed and how is it involved in vaccine distribution?

Operation Warp Speed was the name for a public-private effort to accelerate development, testing, and mass production of effective coronavirus vaccines.  Many elements of the program are still operating, but Warp Speed is no longer referenced. The recent addition of the J&J single-jab vaccine is another output of the newest incarnation of this effort.  I have been told that this effort has also been instrumental in bringing Merck’s vaccination production capacity into the mix to increase flows of the J&J product.

Beyond high-velocity vaccine development, testing, and mass production, OWS also developed a national distribution capacity and capability that has been used to distribute the Moderna product to the states and track all vaccine distribution.

I could, perhaps should, leave your question there, but I predict distribution will be the focus of a great deal of after-action analysis.  From where I have sat, from what I have been able to see, it seems to me that the McKesson-plus-Many-Others capability that was put together was successful moving product from filling/finishing to the states.  Pfizer did a good job of this too.  We should not underestimate the value of this achievement.  But after product handoffs to what I have called the wholesale level, Vaccine Utilization Rates have varied dramatically.  Should federal, state, and local players — not just OWS — have done more?  How could what I call the wholesale level have been better prepared to play a more demand-oriented role in distribution? 

For your audience of supply chain professionals, I will share this observation — to which I hope the after-actions will give attention:  Contemporary demand-oriented, data-driven, just-in-time supply chains work hard to squeeze out uncertainty, but every new product introduction, every holiday season, every hurricane season generates profound uncertainties to effectively manage.  Uncertainty is, in some ways, the reason supply chain professionals exist.  You plan and execute to minimize uncertainty.  You demonstrate your capacity to respond to uncertainty under duress.  You compete with each other on how well you can both minimize and exploit uncertainty.  I don’t perceive that this self-definition, this professional discipline, this embrace of uncertainty, this career-experience with uncertainty has characterized the first ten weeks of the vaccine rollout.

How has the distribution strategy evolved since late 2020?

What I am calling the wholesale level — states, localities, public health agencies, hospital systems — have become much more proficient at last-mile supply chain operations and last-inch procedures. More access points are being set up: many more temporary vaccination venues and an increasing number of retail pharmacies are now delivering vaccinations to consumers.  The supply chain is not yet demand-driven, but as supplies increase and points of access become more convenient it is much more demand-friendly, like Sears on some sunny day in June, 1971.

How do you think the arrival of new COVID-19 variants will affect current distribution plans?

The increasing prevalence of more contagious variants — and in some cases, potentially more lethal variants — lends even greater urgency to distributing as much vaccine volume as possible and pushing Vaccine Utilization Rates as high as possible. In early March, US data are mostly moving in the right direction.  Confirmed coronavirus cases, hospitalizations, and deaths are all down from early January peaks. Most measures of US population mobility — human circulation — continue to be down about 25 percent. Vaccination rates are increasing.  But what we have also seen in other places, especially in Brazil, is that the variants can seriously — and very suddenly — disrupt progress.  The virus is evolving to outrun our constraints. During the last week in February and first week in March improving US data stalled. Is this a blip, a plateau, or the start of a variant-fueled resurgence?  We don’t know.  So, given the risk, our best bet is to keep building and using transmission roadblocks — vaccinate faster, reduce population circulation, avoid crowded interior spaces, continue face coverings,  and so on — to keep cases and hospitalizations as low as possible until roughly seventy to eighty percent of the population is vaccinated. 

On a more recent subject, how has the polar vortex impacted supply chains in the US? Has there been any major outlying impact on the distribution of vaccines?

Many, many supply chain impacts.  For example, major disruptions of fresh produce and fuel refining; amazing fluctuations in the natural gas market, and significant shifts in the freight market for several days across several lanes.  Vaccine distribution was considerably reduced on February 16, 17, and 18 and then bounced back much higher the next week to make up for what had been lost.  This is not a system well-suited for volatility. So yes, there were enormous gyrations in local vaccination flows caused by the Polar Vortex.

So far, we’ve been focusing on vaccine distribution in the US, is there anything you can add about distribution in other parts of the world? i.e. do the strategies differ, how so, etc.

Among the most populous players the United States is well ahead on the vaccination front.  As we speak in early March, the United States is administering about 1.9 million shots per day.   That’s more than twice the number of vaccinations per day in the European Union, more than three-times the number of vaccinations per day in China, and almost 4 times the number of vaccinations per day so far in India.  Israel has done a fabulous job of vaccinating its much smaller population (less than 10 million people).  I do not want to claim any special insight on Israel’s distribution strategy.  But it is well-known that one of the reasons Pfizer was motivated to maximize flow to Israel was an agreement with the Government of Israel to get fine-grained population health data back on those vaccinated.  This benefit is possible because Israel has one of the most sophisticated digitally-facilitated population-health systems on the planet.  In other words, Israel has been able to blend demand-oriented, data-driven processes with vaccine distribution.

What do we take away from this for future vaccine distribution strategies? 

I take away that demand matters most.  Of course there must be supply.  But whether supply is insufficient, perfectly aligned, or over-abundant, how that supply is effectively distributed depends on demand-oriented decisions.  This is especially the case when what is distributed can mean the difference between life and death.  But as supply chain professionals know, this is equally true for any high-volume, high-velocity product: hamburger meat on July 2 and 3 or that fuschia shirt that just sold out in Barcelona, Paris, and New York.  The better we understand demand, the more effectively we are able to target whatever volume and velocity is available.  The better you understand human need, the more likely you are able to fulfill that need.

Supply Chain Executive Order

On February 24 President Biden signed an Executive Order aimed at encouraging Supply Chain Resilience. There are two parts, first, a 100-day Supply Chain Review focused on semiconductors, batteries, rare earths, active pharmaceutical ingredients, and closely related flows. Then, second, a set of six Sectoral Supply Chain Assessments: defense Industrial Base, public health and biological preparedness, information and communications technology, energy, transportation, and agriculture/food. These six assessments are to be completed by next February.

As with any significant Executive Order there are several motivations playing out and a variety of purposes being pursued. There has been plenty of insightful commentary. There have already been several efforts to influence how the EO will be implemented. There will be more.

Indirectly, the Executive Order calls-out several conundrums that challenge effective policy-making related to supply chains.

Four urgent vulnerabilities are plucked from six very full baskets of strategic risk. These four have been recognized (by some) as urgent for a few years. The 100-day window suggests some solution paths have been conceived. The tasks between now and Memorial Day are to confirm or deny (and refine) what has been conceived. If confirmed, this window in time will also be used to gin-up support for moving forward.

The one year schedule for the six assessments is, almost certainly, an initial down-payment that, if successful, will start a multi-year process of sustained strategic engagement in crafting meaningful Supply Chain Resilience. In Washington DC a one-year schedule for anything is generous. But tension persists between the real need (practically and politically) to do-something-soon and the temporal components to do-something-substantive.

The Executive Order gives diversity and security equal — uneasy — equivalence in its recipe for resilience. Diversity innately resists being secured. Security and resilience are often in tension precisely because systemic diversification and independent self-organization makes securing much tougher. Too much security results in rigidity instead of resilience.

Authentic sources of dissonance between national security and economic vitality are another uneasy (and inescapable) relationship baked into the Executive Order. The national security shop and the economic policy shop are given co-ownership of the whole Supply Chain Resilience process. Similar dual touch-points persist across the effort, for example when the Department of Homeland Security and the Department of Commerce are given joint custody of the Information and Communication Technology (ICT) industrial base.

Does anyone know if President Biden is a fan of Arnold Schoenberg? Or maybe Stravinsky? Some say dissonance is as All-American as Gershwin and jazz. Whatever the sound-track, this Executive Order explicitly embraces persistent tensions involving time, turf, technique, targets, interdependencies, freedom, risk, and how the real world works, especially at global scale. The Executive Order leans into these tensions, but it is not yet clear how — if — they will be resolved. Schoenberg’s stubborn non-resolutions are very different from Miles Davis.

Over the next year each of the big six or seven players will have the chance to strut their stuff. I expect a policy line-up that ranges from Sousa marches to the coolest jazz. Then the EO outlines how, “as soon as practicable following the submission of the reports required,” the national security and economic policy shops will provide to the President recommendations to “strengthen the resilience of America’s supply chains.”

I’m guessing that the President’s senior folks are guessing — even depending upon — that six honest assessments will (despite dramatic differences) unveil a Venn diagram where — miracle of miracles — all the essential “industrial base” supply chains share about 80 percent of the same problems (and opportunities?) that can be strategically addressed as a network-of-networks. I’m guessing they are correct. For this fusion to be practically reflected in policy and strategy, I am betting on — hoping for — something more jazz-like than march-like.

Late in his career Miles Davis put aside raw improvisation. But even his most composed performances preserve tensions purposefully deployed as creative strength. Herbie Hancock remembers, “What I realize now is that Miles didn’t hear it as a mistake. He heard it as something that happened. As an event. And so that was part of the reality of what was happening at that moment. And he dealt with it…. Since he didn’t hear it as a mistake, he thought it was his responsibility to find something that fit.”

Great attitude — the only realistic attitude — for engaging the dynamic realities of contemporary demand and supply networks. In Kind of Blue and much more, the great jazz trumpeter resolves tension by embracing dissonance. Not easy to do, but possible.

Fresh Vaccine Production Forecasts

Later today the House Energy and Commerce Committee will conduct a hearing on vaccination progress. Following are excerpts from prepared testimony. You can watch/listen to the actual hearing starting at 10:30 Eastern.

According to John Young with Pfizer, “We expect to increase the number of doses we make available for shipment from approximately 4 to 5 million doses per week at the beginning of February to more than 13 million doses per week by the middle of March. We are on track to make 120 million doses available for shipment by the end of March and an additional 80 million doses by the end of May. And, we anticipate all 300 million contracted doses will be made available for shipment by the end of July, enabling the vaccination of up to 150 million Americans.”

According to Stephen Hoge with Moderna, “We are on track to meet our commitment to deliver 100 million doses by the end of March. We have doubled our monthly deliveries since late 2020, and we are aiming to double them again by April to more than 40 million doses per month. Based on this progress scaling up manufacturing, we recently agreed to move up our delivery timeline: we now are aiming to deliver a second hundred million doses by the end of May and a third hundred million doses by the end of July.” (There is a nice overview of the actually production flow on page 6 of Hoge’s prepared testimony.)

According to Richard Nettles with Johnson & Johnson, “Assuming necessary regulatory approvals relating to our manufacturing processes, our plan is to begin shipping immediately upon emergency use authorization, and deliver enough single-doses by the end of March to enable the vaccination of more than 20 million Americans. We are confident in our plans to deliver 100 million single-dose vaccines to the United States during the first half of 2021…”

Representatives of AstraZeneca and Novavax are also scheduled to testify.

Late Spring and early summer continue to be our best bets for matching supply velocity with existing demand velocity. Then we are likely to become increasingly concerned by the thirty-to-forty percent of vaccine “consumers” who are reluctant to consume. It is worth not waiting to work on that predictable problem.

UPDATE: Bloomberg provides a summary of the Tuesday hearing.

Confirming Causes (and Mitigation)

Here’s a brief new synthesis of which non-pharmaceutical interventions work best and why (sometimes, where) they work. It was published on February 22 in the Journal of the American Medical Association.

Investigations of COVID-19 outbreaks have shown that the factors influencing the risk of transmission vary across settings. However, these local factors occur in several well-established patterns that can be prevented when identified. For example, compared with well-ventilated outdoor spaces, the risk of infection is higher in poorly ventilated indoor spaces when there is prolonged duration of close contact (within 6 feet of someone for ≥15 minutes over a 24-hour period coupled with limited physical barrier to viral transmission because of inconsistent use of masks. The context and intensity of exposure are key in the spread of SARS-CoV-2. Large outbreaks or superspreader events have generally been characterized by a confluence of these factors, such as crowded indoor spaces combined with lack of mask use.4 Living and working environments that are characterized by such factors may also contribute to the greater incidence of COVID-19 associated with race/ethnicity, poverty, and zip code.

Nothing new.  But a helpful integration of findings and research citations.  Just to be explicit: from a Supply Chain Resilience perspective, viral transmission is an important element of demand dynamics.  Non-pharmaceutical interventions are a form of demand management.   We want to avoid excess demand for services by hospitals and, especially, intensive care units.  Sudden and sustained demand beyond existing capacity is one of the most dangerous threats to any supply chain.

Lagging or Leading Indicators?

At the end of January the seven-day US national average for covid deaths was still over 3000 per day (down from more than 4000 in mid-January). As of February 21, the average daily death count was under 2000 and falling. Hospitalizations have declined by more than 50 percent since early January.

Some have credibly suggested that given our high incidence of disease and related death that the US could be approaching herd immunity. With more than 500,000 confirmed deaths, the United States has one of the highest per capita death rates and related pandemic disease profiles on the planet.

Given an almost year-long burnt-earth (prairie fire?) strategy — sometimes intentional , sometimes not —  I concur that, first, the United States has had many more mild covid cases than confirmed by our anemic testing capacity and, second, this has reduced the proportion of non-infected persons available to facilitate virus transmission. As a result, there are now some inherent transmission curbs and guard-rails that were not in place one year ago. Vaccinations are adding more, even stronger Jersey barriers.

It is also interesting that since Halloween mask-use in the United States has increased from about 70 percent of the population to about 80 percent of the population. Since late October cellphone data suggest that US residents have noticeably reduced our circulation. Over most of the autumn we had reduced circulation by between one-fifth and one-quarter of typical. But since Thanksgiving we have reduced our circulation by closer to one-third. There are some significant regional differences, but I am — pleasantly — surprised. Less traffic, less opportunity for viral velocity.

Even more surprising, in some places where more contagious variants are prevalent, hospitalizations and fatalities have also started to decline.  Late January peaks in the United Kingdom and South Africa have fallen fast. During this same period, British mobility has been reduced by half. For a few weeks South Africa reduced mobility by over 35 percent.  South Africans allegedly use face coverings more than Americans. The Brits use face coverings a bit less. The health data in Brazil is much more treacherous and both mobility-reduction and mask use are anemic. Human circulation is clearly very influential in virus circulation.

One more comparison: When case counts began spiking in Denmark the government reacted quickly (more). Only about twenty percent of Danes practice masking, but there is rigorous testing, tracing, and public health interventions to contain outbreaks. When the more contagious B117 variant began surging, public actions and private cooperation reduced observed cell phone mobility from a meager 17-percent-of-typical in early December to a 56-percent-reduction by the end of December.  Hospitalization and death rates began dropping in response. Still, and worth emphasizing, the variant continues to find ways to infect an increasing proportion of the population.

Uncertainty has often been the most honest response to the coronavirus. There is, however, plenty of evidence that when more of us spend more time inside in close proximity to each other, the virus finds a way to use this against us.  This is apparently what recently happened at the University of Virginia (more).  This will continue to be a very real risk for at least several more months. When there is much we do not know, it is usually prudent to behave cautiously in accordance with what we do know.

UPDATE: On February 25, the Financial Times reported on these issues, concluding, “Despite recent success in tackling the virus, scientists emphasised that all countries remained vulnerable to surges in new cases. “Any rapid relaxation of protective measures could produce spikes in infection rates,” said Ted Cohen, professor of infectious disease epidemiology at Yale University. “There are large pools of susceptible individuals still at risk.”

Restarting the Conversation

To converse is to turn-with or turn-over. Gently, warmly going back and forth together can open a topic, might open a mind (or two), and may even open conversationalists to each other. I once spent more than two-hours with my mother’s father saying, perhaps, a dozen sentences altogether. He reported to his daughter, “Phil is a marvelous conversationalist.” Well, questions and listening can unlock conversations. Conversation can unlock mysteries.

Over the last few months I have mostly focused on vaccination issues. Below are some of the issues that emerged. As I write this post I am finishing five very full days working issues related to the impact of the polar vortex on a whole range of demand and supply networks. Topics abound. Mysteries abound. Opportunities for conversation abound.

With the online publication of He Looks at the Earth, I will from time to time post on Supply Chain Resilience. I welcome your questions, suggestions, commentary, and more. I hope that from time to time we may end up in real conversations.

Vaccine Production Forecast

Bloomberg has a new report out on how vaccine flow should build over the next few months. For what it is worth, Bloomberg provides evidentiary detail very similar to what I have been scribbling on the back of an envelope. Their projection is both plausible and consistent with serious plans and specific efforts. Their final counts also depend on all the production puzzle pieces to be put in place on time and over time. This is possible too, but some delays and problems are even more likely (e.g. this and this) says me. But flows of about this size on about this schedule can be reasonably anticipated.

According to Bloomberg, “Currently, the U.S. is administering 1.6 million doses a day, constrained by the recent supply of about 10 million to 15 million doses a week. But Covid-19 vaccine manufacturers and U.S. officials have accelerated their production timelines and signaled that the spigots are about to open, providing hundreds of millions of doses to match the growing capacity to immunize people at pharmacies and mass-vaccination sites. A review of drugmakers’ public statements and their supply deals suggests that the number of vaccines delivered should rise to almost 20 million a week in March, more than 25 million a week in April and May, and over 30 million a week June. By summer, it would be enough to give 4.5 million shots a day.”

UPDATE: On February 19 Pfizer revealed it is only weeks away from opening a second filling and finishing plant in McPherson, Kansas. This could double current US throughputs of Pfizer’s vaccine by the end of March.