Author: Philip J Palin

One in 884 million

I received my first dose of the Moderna vaccine on April 17. With this jab I joined just over 131 million residents of the United States — and 884 million fellow humans — who have been vaccinated against covid in the last five months. Among my U.S. age cohort (over 65) about 80 percent have now received at least one dose. My second dose is scheduled for May 15.

On January 18, 2021 I registered with my regional (multi-county) public health agency to be vaccinated. Two weeks after this initial online sign-up I was asked to complete a survey to assess my vulnerability and priority. Other than being over 65, my risk of contagion was low. I have been largely self-isolating since early March 2020.

On March 7 my registration information was transferred from the regional public health agency’s database to the state parent-agency. The transition was not complicated. I was asked to complete a more detailed online vulnerability survey. I began receiving weekly “updates” basically confirming I was registered and warning of an extended wait.

On April 12 I received an email from the Centers for Disease Control asking me to register with the Vaccine Administration Management System (VAMS). After doing so I was able to view vaccination venues within 10, 20, and 50 miles of my zip code. For the first two days the only open slots “available” were May and June clinics scheduled to be hosted in Tajikistan, China, and Japan. It is my impression that personnel associated with my state (e.g., National Guard units) are deployed in these locations. I did not book a flight to Shanghai.

On the third morning after registering with VAMS I logged on, checked availability, and found many slots available for a nearby vaccination clinic to be hosted in two days. I chose a 10:10 to 10:20 appointment. I arrived at about 9:40 passed a temperature check and was given a number. There were four others in front of me. After my jab I waited 15 minutes. No after-effects, not even a sore arm. I departed the venue about 10:10. I was a bit more tired than usual that afternoon, but cause was unclear.

I have been self-consciously compliant, but passive seeking vaccination. I assisted my wife to be more proactive. She received her two vaccinations from a local chain pharmacy in late February and March. She now has maximum immunity, estimated at over 90 percent. But given my minimal vulnerability — and my professional roles — I have been curious to see when and how the public health system would get to me.

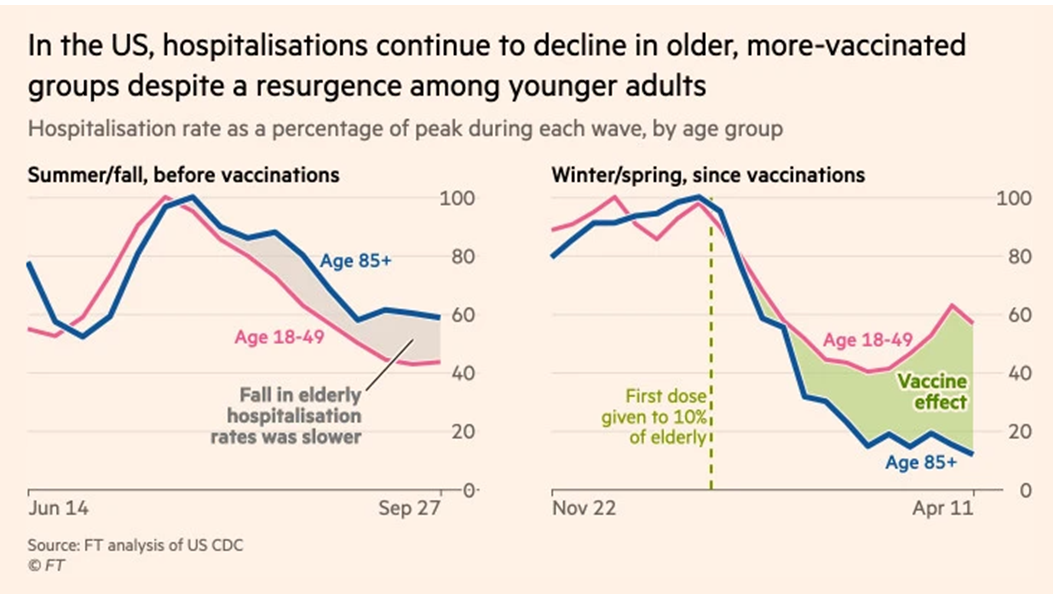
In early January I perceived that by the end of April or early May it would be possible to begin vaccinating the general population. In many ways that threshold is already being crossed. In early January I was also concerned that variants would accelerate disease and death by mid-March. The variants have increased hospitalization rates, but later and — so far — less precipitously than I expected. Meanwhile U.S. vaccination rates have been a bit faster than I expected.

I am happy that variants have been three or more weeks slower to dominate than I expected, while the pace of vaccinations is at least two weeks faster than I expected. In something as dynamic as this pandemic, such marginal differences can have magnified outcomes.

Near-term Vaccine Flows

The recommended pause in administering the Johnson & Johnson vaccine will have modest near-term network-level impacts. For a host of reasons, J&J has not been expected to begin releasing large numbers of doses until late April and May. This week (April 12-17) the J&J allocation for states was sized — pre-pause — at about 700,000 doses compared with almost twenty million doses for the combined Moderna and Pfizer vaccine flows. Below is how Bloomberg has estimated production outputs. J&J is continuing vaccine production. If and when J&J is un-paused total flows will catch up.

Michigan’s Message?

As U.S. covid cases, hospitalizations, and deaths continue to climb, the situation in Michigan is cause for particular concern. Michigan hospitalizations have surged sharply since mid-March. Michigan has a higher proportion of the B.1.1.7 variant circulating than any other state. Early observations have found that B.1.1.7 and two other variants are more easily transmissible. Some credible early studies have found an increased probability of death as B.1.1.7 circulates more widely. There may be indications that younger people are more susceptible to contagion and disease from B.1.1.7 than earlier versions of the virus, but the most rigorous studies so far available do not confirm such observations. While the ambiguity is real (a persistent feature of this novel coronavirus), from the perspective of demand and supply networks, the variants might be said to have new “features” that are more engaging to a wider demographic. The result, unfortunately, is increasing hospital traffic and demand for clinical care. This is happening even though nearly one-fifth of Michigan residents — and nearly one-third of adults — have been vaccinated. Demand management is in a race with demand velocity.

Source: Michigan Department of Health and Human Services

Vigilance Perceives a Vector

US case counts are increasing in more places than not, with double-digit increases in Delaware, Pennsylvania, North Carolina, and Michigan. The national average for hospitalizations has, according to some sources, reversed its recent declines. The number of deaths-per-day has increased by more than ten percent in Delaware, Pennsylvania, North Carolina, Colorado, Virginia, New York, Connecticut, and Tennessee. Since mid- February, Americans are circulating more widely and with more people. This gives the virus more opportunities. The virus has no self-restraint. Most humans can choose to be self-restrained. Our actual behavior is too often the result of not choosing.

Learning (Re-learning?)

A journalist has asked several to write — in 300 words or less — what the pandemic has taught us about supply chains. Here is how I responded:

What did the pandemic teach you about supply chains?

The pandemic has (so far) mostly emphasized essential characteristics that tend to be taken for granted in less challenging contexts.

The pandemic taught me that organizing around demand is fundamental. Where and when manufacturers, carriers, customers, and even competitors collaborate to calibrate around demand, flows can adjust to new needs much more quickly.  Where demand is neglected or miscalculated or just not known, supply misses the mark more and more, troubles accumulate, velocity is reduced, so volumes are not maximized to fulfill demand.

The pandemic taught me that where the scope and scale of demand can be confirmed (and effectual demand continued over time), extraordinary creativity is possible in terms of streamlining and maximizing existing production capacity (much more than I expected). But I also was reminded that production capacity is constrained by access to capital, stubborn issues of time, and — especially –perceptions of sustained future demand.  

The pandemic taught me that robust, diverse, agile freight systems can multiply and divide every other supply chain capacity. When freight assets — surface or maritime or air in whatever mode — are most flexible, then the whole supply chain is more resilient. Persistent freight problems will undo every other advantage and double any other disadvantage. When and where freight channels are flowing, problems with production or demand or whatever can usually be mitigated.

The pandemic taught me that humans — even smart, self-aware, and alert humans — tend to discount the likelihood of any major shift in prior experience, even when the evidence is obvious and racing toward us.  Probably related: the pandemic taught me that smart, self-aware, and alert humans tend to focus on well-defined problems or opportunities and tend to discount ill-defined issues, no matter how potentially consequential. (Yikes!)

The Ever Given Analogy

The huge container ship blocking the busy Suez Canal is, perhaps, the best analogy ever given for innate tensions — and potential frictions — at the core of contemporary demand and supply networks.

Ever Given was enroute from Tanjung Pelebas, Malaysia to Rotterdam carrying about 20,000 TEU. Not long after entering the Suez Canal high winds drove the ship’s bow into the east side of the canal. It has now been stuck for five days. “Each day of blockage disrupts more than $9 billion worth of goods, according to Lloyd’s List, which translates to about $400 million per hour” (more).

The ship’s beam (width) is precisely as big as possible to still use the canal. This maximizes potential volume for the highest seaborne velocity between East Asia and Western Europe. A large load allows maritime carriers to prorate their costs (and profits) over more units of throughput. This is usually a win-win for shipper, carrier, and consumer. Except when a pandemic shuts down most flows. Except later in the same pandemic when surging consumer demand exceeds current shipping capacity. Except when shipping capacity is compromised by too many containers being left outside current circulation.

Concentrations typically speed and smooth exchange within and between concentrations, allowing more to be done with less more quickly. Supply optimized to demand reduces waste, costs, and can allow lower prices.

Concentrations also aggregate risk, especially when and where multiple concentrations intersect, as at the Suez Canal where twelve percent of planetary trade and thirty percent of global container flows line-up to be threaded between the Red Sea and the Mediterranean. Concentrations of production, demand, and conveyance coincide in a single thin, shallow trench. For the moment these concentrations have collided and highly optimized flow is paused.

Not all flows have stopped. There are alternative routes that require more time and cost. But already congested ports are more crowded. Insufficient maritime capacity is further constrained. Fulfilling late-stage pandemic demand will be delayed. Post-pandemic economic recovery is further complicated. Friction accrues. Flows slow. The frenetic energies of optimized demand and supply networks reverse into an increased incidence of commercial failure. Networks furiously adapt to resist this conflation of negative feedbacks becoming a conflagration of economic collapse.

UPDATE ON MONDAY, MARCH 29: The Ever Given has been freed

Maxar Technologies, Agence France-Press, and The Financial Times

Has anybody ever given the ocean a medal?
Who of the poets equals the music of the sea?
And where is a symbol of the people
unless it is the sea?

From The People, Yes! by Carl Sandberg

Three Data Indicators

The current situation in Europe, India, and Brazil each (and all) demonstrate the continuing risk of another surge in disease.

US hospital admissions related to covid continue to ease. This indicator is our most rigorous signal of covid’s “demand-pull” on the healthcare system. In my judgment fatalities, while even more rigorous, signal demand cessation or, perhaps, demand intensity.

US case counts are suggestive and worth watching, but substantially undercount actual “consumption” of covid.

Especially in comparison with much of Europe, India, and Brazil, these US data indicators are clearly more positive. But current case counts (at least in the US with its anemic testing/tracing system) typically lag viral flows by a matter of several days. New hospital admissions typically reflect disease conditions two or three weeks prior. In either case, once case counts and hospitalizations are surging it is too late to stop the surge. Post-hoc we can only contain.

Searching for an ex ante indicator, my best — if very rough — tool has been cell phone mobility data. It has seemed to me (but much more diligent data analysis is needed) that when and where human circulation has remained at three-quarters pre-pandemic levels, covid has been much more effectively demand-managed (two-thirds is even better, the ROI beyond 2/3s has, so far, seemed negligible).

So… from a supply chain perspective, US behavior over the last three weeks is cause for concern. Can US vaccination rates mitigate the risk resulting from this increased circulation? I am much more confident that vaccinations combined with ten percent less human circulation (or even less) than shown below would avoid another demand-surge on the healthcare system in mid-to-late April.

More Vigilance

According to the Los Angeles Times, recent CDC analyses assessed two contending variants of the coronavirus. The B.1.427./B.1.429 variant, first identified in California, is now prevalent in that state and spreading further. But outside California, the B.1.1.7 variant, first identified in the United Kingdom, is claiming a much higher percentage of new transmissions.

A study published on March 15 in the British journal Nature concludes, “we estimate a 61% (42–82%) higher hazard of death associated with B.1.1.7. Our analysis suggests that B.1.1.7 is not only more transmissible than preexisting SARS-CoV-2 variants, but may also cause more severe illness.”

While overall US case counts, hospitalizations, and deaths continue to decline, there are places going the opposite direction. In twenty-three states, the one week average of newly reported cases is higher than than the two-week average. As of March 18, Oregon daily case counts are up 8.1 percent, Vermont is up 9.9 percent, and Utah is up 15.4 percent. Daily fatalities have recently increased more than ten percent in both Oregon and Utah. There is concern that as B.1.1.7 claims more “market share”, that the United State could follow Europe into yet another wave of disease (more and more).

Vaccination rates are increasing in most of the US. Roughly three-quarters of US residents are regularly using face-coverings in public. According to credible indicators, however, US population mobility has substantially increased since mid-February. On Valentines Day Americans were circulating about one-third less than usual. By March 10 we were only 14 percent below pre-pandemic travel patterns. This is much more than just Spring Break trips. This suggests a change in behavior by millions.

Vigilance requires using every tool we’ve got. One-quarter to one-third self-restraint now will avoid thousands of hospitalizations — and two-thirds to three-quarters enforced restraint — later.

Resilience Principles and Practice

A recent White House Executive Order notes, “The United States needs resilient, diverse, and secure supply chains to ensure our economic prosperity and national security.”

Supply chain risks can be reduced or transferred, but many risks cannot be avoided. For demand and supply networks to fulfill their purposes, a wide range of insecurities are innate to purpose and function.  Supply chains cannot be fully secured and remain supply chains.

For some purposes it is possible to create highly secure manufacturing capacity, transportation modalities, and effective deployment of technologies and related services. But this process is unlikely to benefit from high velocity, cost-amortized-over-volume, self-actualizing, demand-fulfilling networks, which are among the key characteristics that differentiate “supply chains” from other less efficient forms of supplying demand.

In many ways, supply chains can be resilient and diverse or we can create secure means of supply. When we create secure processes, we should explicitly recognize related constraints. In some contexts, more security is entirely justified, but it will always travel with higher costs, less agility, and usually with reduced speed.  

We should also explicitly acknowledge implications of insecurity in demand and supply networks. Given the innate insecurity of supply chains, systemic resilience is an essential characteristic for the most human-critical and nation-critical supply chains. Supply Chain Risk Management, strategically conceived, is primarily the cultivation of Supply Chain Resilience. There will be failures.  Recurring, relatively small failures typically characterize the most resilient networks. As high volume, high velocity networks are optimized, the circuit-breaking characteristics of small failures can often be squeezed out. Over time an increased risk of cascading, large-scale failures can be — unintentionally — built-into demand and supply networks.

Supply Chain Risk Management is aware of this tendency, actively monitors flows for fitness and systemic risk, takes action to mitigate risk in advance, and prepares to effectively contain and recover from catastrophic cascades.

Five Core Principles of Supply Chain Resilience

Supply Chain Risk Management advances Supply Chain Resilience by cultivating five core principles:

Principle: Resilient demand and supply networks are diverse, involving many different places, people, processes, forms of competition, forms of collaboration, varied conveyances, widely distributed sources, multiple pathways for demand and supply.  Concentrations (hourglass structures) facilitate volume, velocity, and therefore robustness (see below) but over-concentration can amplify systemic vulnerability. Practice: Observationidentify and map sources, links, relationships, proportional flows, and current/recent deficiencies. Orientation: Ecosystem flow (more) and fitness (contrasted to any particular species). Decision: Is diversity being fostered or impeded?  Where is diversity most at risk?  Where is less diversity most consequential? Why?  Action: Enhance diversity.

Principle: Resilient demand and supply networks feature abundant feedback. Demand signaling is well-facilitated across the network. Major market conditions (e.g. input costs, supply availability,  freight market performance, transportation conditions, etc.) are known.  Major players know each other and often communicate together either directly or through many trusted intermediaries. PracticeObservationidentify and map feedback loops. Orientation: Ecosystem flow and fitness (contrasted to any particular species). Decision: Is feedback being fostered or impeded?  Where is feedback most anemic?  Why? Where is this anemia most consequential?  Action: Enhance feedback.  

Principle: Resilient demand and supply networks feature wide-spread (diverse and feedback informed) agile self-organization.  A wide-range of individual, largely independent players have easy access to the network, participate in feedback loops, and are able to explore — and exploit — network fluctuations on their own decision and at their own risk.  Practice: Observationidentify and map indicators of self-organization. Orientation: Ecosystem flow and fitness (contrasted to any particular species). Decision: Is self-organization being fostered or impeded?  Where is self-organization least prevalent?  Why? Where is lack of self-organization most consequential?  Action: Enhance self-organization.  

Principle: Resilient demand and supply networks feature agile and effective adaptation.  When many diverse players are constantly signaling each other regarding network shifts and each player has significant freedom to explore and exploit these shifts, then myriad individual choices will filter failures and successes and in this way shift the entire network toward more effective behaviors. Practice: Observationidentify and map adaptive behaviors. Orientation: Ecosystem flow and fitness (contrasted to any particular species). Decision: Is adaptation being fostered or impeded?  Where or when is adaptation less common?  Why? Where or when is lack-of-adaptation most consequential?  Action: Enhance adaptation.  

Principle: Resilient demand and supply networks are robust: Resilience can deeply abide in very small, isolated (secure?) contexts.  But the more connected the context, the more resilience depends on robust scope and scale. Large systems — that are also diverse, feedback abundant, self-organizing, and adapting — will resist fundamental (or catastrophic) change, even while constantly changing through small failures and accumulated innovation. Practice: Observationidentify and map scope and scale. Measure pressure-levels of flow across the network. Orientation: Ecosystem flow and fitness (contrasted to any particular species). Decision: Are scope and scale growing or diminishing?  Integrating or fragmenting?  Are flows being widely facilitated or are some channels and sections being shed?  Why? Where or when does robustness seem to compete with resilience?  Where or when does robustness reinforce resilience?  Action: Enhance resilience.   

Operationalization of Supply Chain Resilience (or Practice Supply Chain Risk Management at the Ecosystem Level)

The matrix suggested by the preceding is so complex and dynamic that it is not currently possible to identify and map anything close to full flows.  Even meaningful snapshots are difficult and treacherous. Given current conceptual and technological capabilities it is helpful to set meaningful boundaries  for engagement. One of the most important outcomes of the six assessments set out in the Executive Order could be specific targets for operational engagement.  While there are clearly better or worse targets, the issue is not so much finding the most consequential target(s) as choosing a plausible set of targets with which to begin data-gathering, relationship-building, analysis, and synthesis consistent with the five core principles.

Several substantive and structural recommendations for follow-on to the EO tasks have emerged.  Here are two: BENS and CBA/CSCMP.  There will be more. Many of these operational recommendations are coherent with the five core principles identified above. Many of the approaches offered so far are government-centric.  Many of these recommendations would assist the US government play a more constructive role in Supply Chain Resilience.  But any government-centric role will, on its own, fail to engage many risks and opportunities for Supply Chain Resilience.  Demand and supply networks are not inherently governmental. In her 2009 Nobel Prize Lecture Elinor Ostrom said:

Most modern economic theory describes a world presided over by a government (not, significantly, by governments), and sees this world through the government’s eyes. The government is supposed to have the responsibility, the will and the power to restructure society in whatever way maximizes social welfare; like the US Cavalry in a good Western, the government stands ready to rush to the rescue whenever the market ‘fails’, and the economist’s job is to advise it on when and how to do so. Private individuals, in contrast, are credited with little or no ability to solve collective problems among themselves. This makes for a distorted view of some important economic and political issues. 

Such a distorted angle on reality will fail to advance Supply Chain Resilience. A stubborn adherence to this distorted angle actively threatens Supply Chain Resilience. In addition to the government reforms outlined by others, there is a need for a whole-of-nation approach to developing Supply Chain Resilience.  This would most likely be achieved through a Congressional chartering of a public-benefit corporation that would, consistent with the five core principles:

  • Conduct data-gathering, relationship-building, analysis, and synthesis focused on the ecosystem level of demand and supply networks.
  • Convene and facilitate meaningful and regular feedback regarding flows and fitness of demand and supply networks.
  • Recommend and when possible facilitate voluntary mitigation and preparedness activities to advance Supply Chain Resilience