Author: Philip J Palin

Hurricanes: Threats, Vulnerabilities, Consequences

THREATS

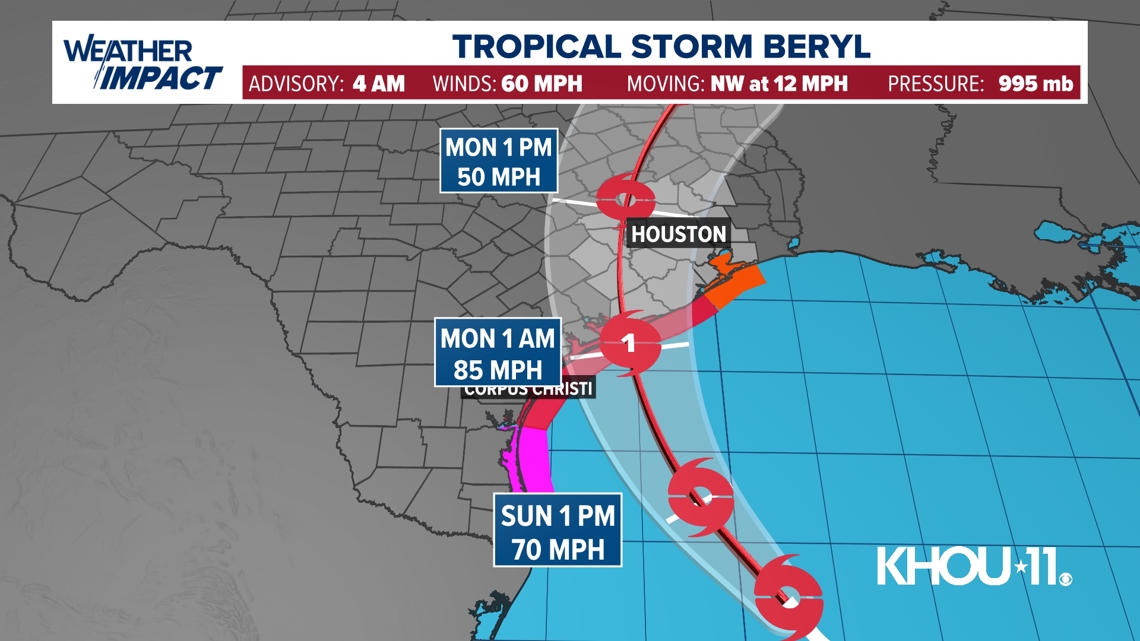
The National Oceanic and Atmospheric Administration forecasts, “a range of 17 to 25 total named storms (winds of 39 mph or higher). Of those, 8 to 13 are forecast to become hurricanes (winds of 74 mph or higher), including 4 to 7 major hurricanes (category 3, 4 or 5; with winds of 111 mph or higher). Forecasters have a 70% confidence in these ranges. The upcoming Atlantic hurricane season is expected to have above-normal activity due to a confluence of factors, including near-record warm ocean temperatures in the Atlantic Ocean, development of La Nina conditions in the Pacific, reduced Atlantic trade winds and less wind shear, all of which tend to favor tropical storm formation.” A less active season has been forecast for the Central and Eastern Pacific.

More Atlantic hurricanes overall, more hurricanes at Category 3 and above, and an extended season increase the chances for landfalls with significant impacts on people. The risk of serious population impacts is also increasing as hurricanes are more likely to demonstrate rapid intensification. According to a 2023 report in Nature:

Quickly intensifying tropical cyclones (TCs) are exceptionally hazardous for Atlantic coastlines… Mean maximum TC intensification rates are up to 28.7% greater in a modern era (2001–2020) compared to a historical era (1971–1990). In the modern era, it is about as likely for TCs to intensify by at least 50 kts in 24 h, and more likely for TCs to intensify by at least 20 kts within 24 h than it was for TCs to intensify by these amounts in 36 h in the historical era. Finally, the number of TCs that intensify from a Category 1 hurricane (or weaker) into a major hurricane within 36 h has more than doubled in the modern era relative to the historical era. (More and more.)

Rapid intensification — especially near-shore intensification — can subvert evacuation plans and timing, potentially leaving more people in harms way. Many of the atmospheric factors that result in rapid intensification can also challenge the accuracy of forecast tracks (here and here and here). Threat assessment mostly tries to measure what will be hit when and how hard. Hurricane targets and intensities can be reasonably anticipated, but are tough to precisely predict.

Secondary effects of hurricane impacts — such as storm surge, flooding, and grid outages — interact with network vulnerabilities (see below) to amplify the hurricane threat. The NERC summer reliability assessment for the 2024 grid is a bit more robust, potentially resilient, than in recent years (more). But this summer’s heat forecast is also more robust. National Public Radio reports, “2023 was the hottest year on record for many places in the U.S., and by far the hottest year for the planet as a whole… It’s already been so hot that 2024 is guaranteed to be one of the five hottest years ever recorded.” One nightmare scenario is a hurricane-related grid loss followed by extended extreme heat descending on hard-hit survivors.

VULNERABILITIES

Despite recurring and increasing threats, the population growth of coastal communities has accelerated. Over 60 million people reside in Atlantic and Gulf Coast areas with hurricane histories. In recent years the population growth rate of these areas has often been more than ten percent higher than the national average (here).

Fixed assets are more vulnerable than mobile assets. Surface freight capacity is structurally and spatially diversified. Many freight assets — both drivers and trucks — are proactively relocated out of the way of hurricanes. Concentrated fuel capacity, such as refineries, pipelines, ports, and fuel racks stay put (see map below and here). As long as hurricanes stay away, fixed fuel capacity is okay. But if hurricanes hit fuel capacity concentrations hard enough to cause time-extended disruption or serious destruction, the network consequences can quickly cascade. Surface freight capacity depends on refueling. No fuel, no freight. In case of hurricane related grid loss many key supply chain components — such as public water systems and grocery distribution centers — depend on diesel-fueled emergency generators. No fuel = no emergency power = suddenly diminished flows of water and food = thirst and hunger.

This morning FreightWaves gives us a meaningful snapshot of current national freight capacity (see chart below):

Outbound tender volumes (OTVI) surged over 7.1% from May 26 to June 3, marking one of the strongest demand increases to start the summer shipping season since 2019. The spike in tender volume appears to have helped sustain spot rates, excluding estimated fuel costs (NTIL) at relatively elevated levels beyond the Memorial Day holiday period. Volumes tend to jump this time of the year, increasing between 0.3% and 6.8% over the past four years, but they jumped 8.8% in 2019, a time of a historically down market.  So while the tender volume jump was the largest in several years, it has not pushed rates higher proportionally — it has sustained the level. The reason for this lack of rate jump is largely that there is still enough capacity to handle it.

During the second half of 2023 US trucking capacity experienced a considerable contraction (here and here) adjusting to post-pandemic demand patterns. Still, freight capacity for the 2024 hurricane season is roughly the same as last year. In terms of truck transportation employee counts May 2024 is a bit higher than May 2019 or any prior May in the census records (more and more). As of the beginning of hurricane season, diesel fuel stocks are higher than the last two years. East Coast (PADD-1) diesel inventories are at least one-fifth higher than May 2022 or 2023. Gulf Coast (PADD-3) diesel stocks are also within or slightly above seasonal averages.

CONSEQUENCES

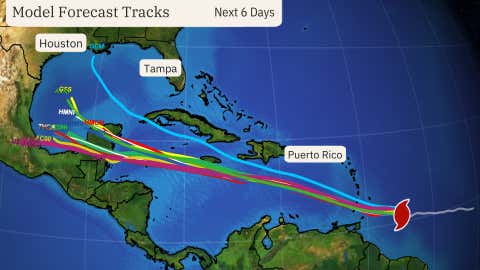
Risk is a function of what and how many are hit when (and again) and how hard. In the last week of September 2022 Hurricane Ian presented a serious threat to the Gulf Coast of Florida. Even one day before landfall Tampa Bay seemed to be the target. But instead, the high end CAT4 storm came ashore just north of Fort Myers (about 100 miles south of Tampa). Death and destruction was horrible. But this late right hand swerve saved the Tampa port, racks, and pipelines to fuel the response for Fort Myers, Cape Coral, and nearby. The cluster of food distribution centers between Tampa and Orlando (and near Miami) continued to direct flow into Southwest Florida. Because the midstream capacity concentrations were not hit, flow continued downstream to concentrations of demand. The harder the hit upstream the more disruption (or worse) downstream. Two years later I start this hurricane season especially attentive to threats that may unfold to food, fuel, and freight capacities concentrated near Tampa, Miami, Jacksonville/San Juan, and then near New Orleans, and then between Beaumont and Houston. If these capacity concentrations survive, consequences can be mitigated. The harder these critical nodes are hit, the more risk is amplified.

Resilience depends on effectual demand

It has been my experience that where and when there is effectual demand — in other words, needs or desires with resources to cover the costs of supply plus a reasonable margin — there is a substantive basis for Supply Chain Resilience. There can still be plenty of troubles, but where there is meaningful pull there will — eventually — be close to calibrated push.

According to this morning’s release by the Bureau of Economic Analysis, during April the growth rate of American consumption increased more slowly than in recent months (here and here). But the overall level of effectual demand remains quite robust when compared to pre-pandemic patterns. Please see the chart below. Inflation-adjusted spending on goods (blue line) has essentially been flat for nearly three years. Spending on services (red line) flattened some in April. Services spending continues to be stronger than ever before and goods spending is within a conversational range of its strongest pull. (More)

According to the BEA, “Within services, the largest contributors to the increase were housing and utilities (led by housing), health care (both outpatient services and hospitals), and financial services and insurance (led by financial service charges, fees, and commissions). These increases were partly offset by a decrease in transportation services (led by air transportation). Within goods, the largest contributors to the decrease were spending for recreational goods and vehicles (led by information processing equipment) and other nondurable goods (led by recreational items).”

May Big flows

Food Flows

As the planting season is underway across the Northern Hemisphere, the US Department of Agriculture reports:

The global wheat outlook for 2024/25 is for slightly lower supplies, increased consumption, modestly higher trade, and reduced stocks. Supplies are projected to decrease 2.2 million tons to 1,056.0 million with production projected at a record 798.2 million tons, but lower carry-in stocks for several countries, most notably China and Russia, more than offset higher global production. Increased output for India, China, Australia, Kazakhstan, Canada, and the United States is expected to more than offset reductions for Russia, the United Kingdom, the EU, and Ukraine. Projected 2024/25 world consumption is raised 2.0 million tons to a record 802.4 million… The global rice outlook for 2024/25 is for rising supplies, trade, consumption, and ending stocks. Supplies increase year to year on record production at 527.6 million tons that more than offsets lower beginning stocks. The record global crop is primarily driven by increases for India, China, Bangladesh, and Indonesia. Global consumption is projected at a record 526.4 million tons, mostly on higher use by India, the Philippines, Indonesia, and Bangladesh offsetting a reduction for China. With production and consumption gains projected in many of the same countries, global trade is forecast up only slightly at 53.8 million tons, still lower than levels of trade before India first imposed restrictions on rice exports in 2022. India remains the leading exporter at 18.0 million tons, 2.0 million higher than in 2023/24 but below its record volume of 22.0 million tons in 2021/22, as ongoing export restrictions are expected to limit shipments. Projected 2024/25 world ending stocks are 176.1 million tons, up 1.2 million from a year earlier and would be the first increase in global stocks since 2020/21.

The transition from El Nino to La Nina weather patterns is expected to impact agricultural outputs (here and here). Agweb asked Eric Snodgrass, science fellow and principal atmospheric scientist for Nutrien Ag Solutions to forecast US outcomes: “… I’m expecting warmer than average temperatures,” Snodgrass says. “Most of that coming in warmer overnight lows though, based on what I know now. And a lot of that is predicated on the collapse of El Niño to neutral conditions and eventually into La Niña.” Whether it turns into a hot and dry summer or a much wetter forecast than some are anticipating, Snodgrass says he was burned by weather prediction models last growing season, so he’s skeptical to rely on those again. However, he does think La Niña could open the door for a very active hurricane season this year.”

Energy Flows

For reasons related to both supply and demand, according to Bloomberg’s CL1 Index global price patterns for crude oil remain toward the bottom of the range at play since Russia invaded Ukraine (here) despite plenty of middle east turmoil. See first chart below. For the last six years the United States has been the largest petroleum producer. US fossil fuel flows are, however, vulnerable to hurricane hits (here and here). “NOAA is forecasting a range of 17 to 25 total named storms (winds of 39 mph or higher). Of those, 8 to 13 are forecast to become hurricanes (winds of 74 mph or higher), including 4 to 7 major hurricanes (category 3, 4 or 5; with winds of 111 mph or higher). Forecasters have a 70% confidence in these ranges.” Both the European TTF (more) and US Henry Hub benchmark prices for natural gas futures are quivering about lower end levels (TTF slightly higher while US prices remain well below $3.00 per MBTU for now).

The recently released summer reliability report for the North American grid highlights “strong supplies of natural gas” as reinforcing significant increases in renewable generation of electricity. The most troublesome challenges for grid reliability relate to an even faster increase in demand. According to the NERC assessment, “Most areas are forecasting increases in peak demand compared to last summer. The extent that demand forecasts have increased and the drivers affecting growth vary by area. In ERCOT, SPP, and British Columbia, the increases are among the highest and build on similar growth from the prior year. New data centers and cryptocurrency mining facilities are contributing to higher demand forecasts in ERCOT this summer… While resource additions in Texas, primarily solar PV, are outpacing demand increases, energy risks are growing during the hours when solar output is diminished. Further, transmission development is straining to connect new resources and deliver electricity supplies to growing load areas.”

Freight Flows

In late April port congestion increased across East Asia. S&P Global reported:

Market participants have reported congestion at China-based ports, Singapore, Port Klang, Jebel Ali and Columbo — with the last three being key transshipment and intermodal hubs in light of the Red Sea crisis — leading to carriers also dumping containers at Singapore in an attempt to catch up with and meet schedules.” The main port giving us issues is Ningbo as one of our main transshipment ports in China is only releasing bookings that have historically been supported at origin, making it difficult for new customers to secure shipments,” a carrier source said. Sources reported a two-to-three day delay in berthing at Port Klang and Singapore and a five-to-six day delay at Jebel Ali. During normal circumstances the same ports see berthing on arrival or delays of up to only half a day.

These and other upstream patterns have now predictably moved downstream, especially into the Western Mediterranean. In mid-May Loadstar reported:

“If we focus on the first 14 weeks of 2024, capacity on Asia-Med is up by 8% year on year already, whereas it’s down 3.1% on Asia-North Europe,” Xeneta’s Peter Sand told The Loadstar recently. “West Med transhipment ports are as busy as ever, and may already be exceeding peak productivity levels,” he continued. “The port of Barcelona handled 48% more transhipment teu in Q1 24 than last year. According to Xeneta data, we can clearly see the attractiveness of this trade, from a carrier perspective.” The additional attention is having a knock-on effect on wait times, which at Barcelona have increased to 3.53 days. According to Xeneta’s short-term market averages, rates from Singapore to Barcelona were climbing again, from a lull in March, up 10% at the beginning of this month, close to levels last seen at the outset of Red Sea diversions in January.” (More and more and more.)

While shipments between East Asia and Europe have usually seen the highest relative impacts (more), all ocean shipping prices have increased as more ships have longer sailings and experience more port congestion on both ends of shipping routes. See second chart below. The Wall Street Journal recently reported, “We expect the Red Sea diversions to continue for the rest of the year and volumes are coming in stronger than anticipated,” Vincent Clerc, chief executive of Danish-shipping major A.P. Moller-Maersk, said in an interview. “All shipping lines have adjusted their networks around Africa more or less permanently.” The WSJ also noted, “…with U.S. consumer demand staying strong and the Red Sea remaining inaccessible, transport costs with retailers no doubt continue going up.” The National Retail Federation said earlier this month that America’s top dozen ports handled 1.96 million containers in April, up 10% compared with a year ago and 2% from March, pointing to a strong trend for imports in the third quarter, the busiest season for shipping as retailers stock up for the year-end holidays.”

As recently noted, demand will ultimately decide how much push-capacity remains strained (and premium priced). The Cape Route is plenty wide. Panama Canal flows are beginning to recover. Without the Red Sea crisis, ocean carriers would have had excess capacity. The no-Suez delays are now almost business-as-usual for carriers, even as port operators and land-side carriers scurry to catch up. Other than a big slice of Germans, many more Europeans are edging toward spending more. (More and more and more.) If record-breaking Memorial Day air travel is a leading indicator, US consumers are still in the mood to buy. This week’s April PCE will be especially interesting and the May number even more.

Generic 1st ‘CL’ FutureCL1:COM (USD/bbl.)

+++

May 28 Update: Less than 24 hours after my post above, the FT published a Deep Dive headlined: “The Mounting Strains on Global Shipping”. It is well written. Data is coherently organized + information is given context = knowledge abounds. The author concludes, “Kuehne + Nagel’s Aldwell warns that this year’s peak shipping season could prove very difficult if it arrives without a resolution to the Red Sea issues. That is particularly the case, he says, if European consumer demand revives as inflation falls back, interest rates are cut and cost of living pressures ease. “If we’ve got these long transit times and we see the consumer come out and start buying again, I think we have opportunities for some challenges there,” Aldwell says. “That’s for sure.”

Demand decides

In January 2016 real — inflation adjusted — Personal Consumption Expenditure in the United States was $12,799 billion. Four years later in January 2020 real PCE was $14,185 billion, very close to a ten percent increase. Early in the Pandemic PCE cratered (see first chart below). But by March 2021 PCE had recovered to $14,269 billion. In the three years since, real PCE has increased to $15,762 billion, again about a ten percent increase — but over 36 months instead of 48.

Between first quarter 2016 and first quarter 2020 US Gross Domestic Product increased just a tad under ten percent. In the three years since first quarter 2021, US GDP has grown about eight percent. (See second chart below) So, US consumers’ pace of post-pandemic spending is higher than our pace of economic growth over the last three years. Again these are inflation-adjusted numbers. Americans are spending a bit more, a bit faster in real terms. Given the inflation rate — especially between March 2021 and March 2022 — spending can feel even faster.

But since March 2021 real consumer expenditure on goods — food, cloths, furniture, etc. — has been flat. Meanwhile real PCE for services has increased roughly ten percent (see third chart below). We are spending more on medical care, eating out, traveling, etc. Supply chains certainly enable the service economy, but supply chains per se are mostly focused on fulfilling demand for physical stuff. Ergo the so-called “Freight Recession” (here and here and here). Given volatile fuel costs and increased labor costs (more) and debt costs (more) this can sometimes feel like a freight depression. Todd Davis at FreightWaves points out, “Active truckload operating authorities are 39% higher than in 2019, while tender volumes are just 12% above May 2019 levels. The national Outbound Tender Volume Index (OTVI) shows an 8%-9% increase in truckload demand over the past year, with local haul freight (under 100 miles) driving annualized growth.” Since late winter US rail traffic seems to be heading lower. Freight capacity was insufficient to fulfill demand for much of late 2020 to early 2022. Carriers then over-compensated a bit. The system is now in the process of adjusting to the no-growth, slow-growth shipment pattern. There continues to be excess-capacity among carriers. But there is also enough persisting demand — and the prospects of just a little bit more — that capacity has not collapsed. It is not always pretty, but this is how a resilient system behaves.

+++

Personal Note: Other work is keeping me away from this blog and distracting me from the sort of large scale network behaviors that I usually try to make sense of here. I am past-due for a monthly update on big flows. The attention to US demand set out above is an effort to set the stage for this update. As always (I argue), demand decides.

Amalthea again

On Saturday shipments from Cyprus to Gaza resumed. According to CNN, “The ship, called “Jennifer,” departed Larnaca Port in Cyprus at 9 a.m. local (2 a.m. ET) and will take around 25 to 30 hours to arrive at Israel’s Ashdod port, according to ANERA’s (American Near East Refugee Aid) emergency response team lead in the West Bank, Mohenad Itayam. Itayam told CNN the 400 tons of aid would undergo Israeli security clearance upon arrival. From there, it will be loaded onto trucks that will then go south to the Kerem Shalom border crossing before entering Gaza.” (More)

The Amalthea maritime corridor was originally conceived as opening a new gateway directly into hardest hit Northern Gaza. This opportunity was being piloted by World Central Kitchen and others when IDF action on April 1 killed seven WCF staff (here). There have been no further maritime deliveries from Cyprus until this last weekend. Please notice that while goods are transferred to trucks at Ashdod, north of Gaza, the trucks are then squeezed through the Kerem Shalom border crossing adjacent to southern Gaza.

World Central Kitchen has announced it will resume operations in Gaza, including possible use of the maritime channel from Cyprus. “We have been forced to make a decision: stop feeding altogether during one of the worst hunger crises ever, ending our operation that accounted for 62% of all International NGO aid, or keep feeding knowing that aid, aid workers, and civilians are being intimidated and killed. These are the hardest conversations and we have considered all perspectives when deliberating. Ultimately, we decided that we must keep feeding, continuing our mission of showing up to provide food to people during the toughest of times.”

The US Department of Defense has announced that near-shore construction has begun of the the floating pier and causeway off Gaza that is expected to receive flows from Cyprus (and elsewhere). According to CNN, “A senior military official said last week the US is “on track to begin delivery of humanitarian assistance to Gaza from the sea in early May,” which will begin at the equivalent of 90 trucks per day of aid and then “quickly scale up” to 150 trucks per day once full operational capacity is reached.” (More and more.)

More aid is arriving in Gaza, see chart below. This is much better than the deep drought experienced most of February. But inbound deliveries remain well-below the average of 500 trucks per day received prior to October 7 — and even then, sixty percent of Gazans were “food insecure” (here and here). From a supply chain point-of-view, there is no flow. There are sporadic spurts, some shallow pooling, even a few sudden sprays, but mostly it is only a trickle compared to what is desperately needed. The New York Times has a helpful operational overview of how inbound to the DOD floating pier will be discharged into Gaza. Rather than intermodal efficiency, it is a collection of multi-modal hurdles unfolding into a last mile shooting war.

+++

May 6 Update: Rocket and mortar fire near the Kerem Shalom crossing has disrupted deliveries into Gaza. Rough seas have complicated completion of the of the near-shore pier to serve Gaza. This morning Reuters is reporting, “Israel’s military said on Monday it had begun encouraging residents of Rafah to evacuate the southern Gazan city as part of a ‘limited scope’ operation, but did not immediately confirm media reports this was part of preparation for a ground assault.”

May 8 Update: Several reports suggest the Kerem Shalom crossing has reopened today (here and here). The Rafah gateway is the site of ongoing military operations (here and here).

The Financial Times reports, “The flow of crucial food and medicine into the Gaza Strip — already severely constricted by eight months of war — has slowed to a trickle after Israeli troops moved into Rafah this week and halted traffic at two major border crossings. The UN has only 15,000 litres of fuel left for generators — including those in hospitals — and vehicles in southern Gaza, less than 10 per cent of daily demand, said Scott Anderson, senior deputy director at the UNRWA, the UN agency for Palestinians in Gaza. After nearly three days of disrupted humanitarian aid convoys, warehouses will run out of flour and ready-to-eat meals within days, he said.” (More and more and more.)

“Construction of the floating pier and causeway has now been “completed”, according to the Department of Defense. Near-shore and on-shore anchoring is dependent on weather conditions which are forecast to improve through Saturday (here and here).

May 11 Update: The original post above was published on April 30. April was the best month for inbound volumes to Gaza since October. May will almost certainly be the worst. The IDF (COGAT) reports some continued deliveries. The United Nations reports that the last truck entered Gaza on May 5 (more). This morning, the Independent (UK) reports, “… the United Nations warned that food supplies in the southern Gaza region where Israel intends to conduct another ground attack “will run out tomorrow”. The shortages have been caused by Israel’s closure of two crossings in the south through which humanitarian aid was being moved into Gaza. They are currently being blocked by Israeli forces ahead of a ground offensive in Rafah.” According to Reuters and several others, “the military is pressing ahead with its plans for a ground attack on Rafah… Israel has said it will proceed with an incursion into Rafah, where more than 1 million displaced people have sought refuge during the seven-month-old war.” (More and more.)

The Merchant Vessel Sagamore has departed Cyprus for northern Gaza near where floating piers have been constructed (more). According to the US Department of Defense, “One floating pier will be deployed several miles offshore outside Gaza, while the other, called the Trident pier, or “causeway,” will be pushed onto and attached to the Gazan shore. Together they will be used to move humanitarian aid into Gaza.  Both of the floating piers, along with the MV Roy P. Benavidez — a large, medium-speed, roll-on, roll-off ship — are off the coast of Israel near the Port of Ashdod, about 18 miles north of Gaza. Unfavorable sea conditions prevent movement of the piers to their final location. In the meantime, the MV Sagamore — a commercial cargo ship — has been loaded with humanitarian aid in Cyprus and has made its way to Ashdod. Instead of waiting for the piers to be deployed, humanitarian aid on the Sagamore will be moved to the Benavidez so that the Sagamore can go back to Cyprus to get more aid supplies.” I have received conflicting reports on the off-loading of the Sagamore and sea conditions off Gaza.

May 13 Update: The New York Times is reporting, “Six trucks of flour arrived through the Kerem Shalom crossing on Saturday, and on Friday, some fuel also came through the same crossing point, according to Juliette Touma, the communications director for the main U.N. agency that aids Palestinians, UNRWA. She said that no other supplies arrived through Kerem Shalom this past week and that the Rafah crossing remained closed… COGAT said on Sunday that it had opened a new “Western Erez” crossing to allow for more aid to northern Gaza, and that it had coordinated “dozens” of World Food Program trucks carrying flour from the Israeli port of Ashdod. But COGAT did not say whether the flour trucks had entered northern Gaza…” Maritime conditions are available here and here.

May 14 Update: There are now several independent confirmations that more than 400,000 residents of Gaza have relocated since May 6. (here and here). Haaretz reports, “After nearly 100 Israelis blocked and damaged an aid convoy en route to Gaza on Monday, two trucks from the convoy were set ablaze Monday evening in the West Bank. The Israel Police and IDF traded accusations of blame regarding whose responsibility it was to guard the convoy.” (More and more.)

May 16 Update: US Central Command reports that its personnel have, “anchored a temporary pier to the beach in Gaza. As part of this effort, no U.S. troops entered Gaza. Trucks carrying humanitarian assistance are expected to begin moving ashore in the coming days. The United Nations will receive the aid and coordinate its distribution into Gaza.” (More and more.) The BBC reports that, “nearly 100 tonnes of UK aid, consisting of 8,400 “shelter coverage kits” (temporary shelters make up of plastic sheeting) left Cyprus on Wednesday, bound for the temporary pier.” Reuters reports, “a third party will collect the aid from the pier, drive it a short distance and then offload it for U.N. collection. The U.N. official said another third party – contracted by the U.N. – will load the aid on to trucks and take it to distribution points across Gaza.” (In late April the NYT provided a helpful overview of the various hand-offs here.) The United Nations is reporting that over the last week at least 600,000 residents of Rafah have self-evacuated to previously unpopulated areas along the Mediterranean. Supporting these ongoing shifts amplifies the most basic logistical challenges.

May 17 Update: The floating pier and causeway are now in place in mid-Gaza (see photo below and here and here and here). The initial discharge into Gaza via this route involved about a dozen trucks and 300 pallets of goods donated by the United Kingdom (here). According to IDF sources, some land routes saw renewed deliveries this week, including 97 trucks so far today (Sunday) and 84 trucks on Friday (more). Until Friday fewer than forty trucks had been received since May 5. The number of newly displaced persons inside Gaza is now estimated at 800,000.

May 21 Update: The US Department of Defense, Central Command indicates that over 569 tons of goods have now been discharged into Gaza (here and here). It is also reported, “but not all the aid has reached warehouses.” There are troublesome reasons for the diversion of aid from the warehouses. It is also true that delivery to warehouses is not the mission. The mission is to feed hungry people. Linear concepts and methods such as warehouses and well-organized feeding centers are needed — and will be insufficient. Many more creative, non-linear, channels and techniques are needed to advance this difficult, treacherous, and urgent mission. (Additional links on this mission-gap: here and here and here and here.)

Soldiers putting in place the pier

May 27 Update: There are reports, rumors, and plenty of recriminations related to what is happening — and not happening — with water, food, and fuel deliveries into Gaza. Here is a New York Times overview that is coherent with what I am otherwise being told. Here is a related, but more narrowly framed report by Deutsche Welle, but I am told this progress has now been overcome by events. (More and more and more.)

Demand marches ahead

Personal Consumption Expenditures for March were a bit higher than expected. It is just a blip, but a boisterous blip. This PCE print signals a continued pattern of rather robust demand, including a significant monthly increase in demand for goods (compared to services). The March economy absolutely had spring in its step. See the first chart below for real — inflation adjusted — consumption of food-at-home.

Reinforcing the PCE indicator is first quarter GDP results for real “final sales”, please see the second chart below. The US consumer is buying. Goods (and services) are being delivered to sell.

Following are several insights cherry-picked from a much more expansive report from FreightWaves.

  • Despite a seasonal dip during the Easter holiday period, freight demand remained consistent in March, outperforming 2023 levels by an average of about 9.5%, reflecting significant growth.
  • National tender rejection rates hovered around 3.5% for most of March, slightly higher than the previous year by approximately 70 bps, with reefer rejection rates being the main reason for the increase.
  • Contract rates, while still falling slowly, have decelerated significantly over the past seven months, suggesting a potential upward trend by the end of the year. Carrier active operating authorities continued to contract in March, although at a slower pace, indicating a potential turnaround in the market in the near future.
  • Easier year-over-year comparisons and a strong economic foundation have guided double-digit import TEU growth in Q1 of 2024, with bookings and daily TEUs returning from the Lunar New Year holding 10%-12% above 2023 levels.
  • Overall U.S. containerized intermodal volume remains significantly higher than the previous year, driven primarily by the international segment, indicating strong import volume and the availability of oceangoing containers in the global marketplace.

What I perceive is a US freight network that still has “excess capacity”, but given persistent demand, carriers are being persistent too… so supply is delivered at what might even be considered deflationary rates.

Upstream flows for the Grid

Below is yesterday’s (April 22, 2024) full-day fuel mix for the Texas grid. Proportions change seasonally and (obviously) by the time of day. But the major contributors remain the same: solar, wind, natural gas, coal/lignite, and nuclear. Other sources are very marginal, but can be vital when the grid is teetering on the edge. The proportions at play in Texas ought not be generalized. For example, in Washington State hydropower delivers almost 65 percent of electricity generation.

Let’s try to quickly trace some individual links in the Texas grid supply chain. Wires and transformers are early steps upstream from electricity consumption. We all know about wires (at least in general). Transformers are less well known. PV magazine explains, “Transformers are a necessary piece of the energy puzzle, as they manage the flow of electricity along the power grid by changing high-voltage electricity from transmission lines into low-voltage electricity before it reaches consumers.” There is currently a “shortage” of both electrical cables and transformers.

The scare quotes are meant to suggest that while there are current supply-side constraints (here and here), this is less a matter of reduced supply and much more a matter of increasing demand. A recent study by the National Renewable Energy Laboratory (NREL) found that demand is surging because of “aging infrastructure, electrification and massive growth in electricity demand, increased failure due to extreme weather events, and proactive utility resilience replacement programs. NREL preliminary analysis estimates current stock of between 60-80 million distribution transformers with upwards of 3 TW of installed capacity, and estimates the growth in overall stock capacity by 2050 will see up to a 160%–260% increase on 2021 levels.” (More and more and more.)

If we follow the different-capacity wires and transformers further upstream, we are not surprised to find more than 160 natural gas power stations operating in Texas. Texas produces more natural gas than any other state and about a quarter of national output (here). Texans also consume the most natural gas. Roughly 40 percent of electricity consumed in Texas depends on natural gas. Both Texas and the Unites States have very robust proven reserves of natural gas. But during 2021’s Winter Storm Uri natural gas connections froze. The very abundance of natural gas can also contribute to price swings that undermine consistent investment in exploration, drilling, and maintenance. Even with production cuts, recent price action has discouraged producers (more and more). This sort of volatility can narrow resilience investments at every step in the natural gas system.

About sunrise yesterday the wind picked up across Texas and so did the contribution of wind power to the grid (see blue line below). With more than 15,000 wind turbines this sector typically contributes about a quarter of total electricity generation in the state (here). But typically the wind does not blow as much in summer as winter (especially under El Nino effects). This can be a problem when Texas gets very hot (here). And sometimes even winter winds can slow. Lagging transmission network upgrades are also a constraint (here and here). Lack of skilled labor and some parts problems have complicated build-outs (see transformer note above and more and more). China is home for about sixty percent of global wind power parts and supplies. There is some sense that China gets what it can use before selling what’s left to non-domestic customers (here).

Last month Texas surpassed California as the state with the most grid-scale solar capacity. In recent years, about six percent of overall electricity consumed in Texas has originated with solar power. This is growing quickly, just as Texan’s demand for electricity is growing quickly. On some days, solar can be the source for over one-third of Texas grid output. Supply chain resilience for solar is complicated by the turning of the planet, clouds, and lack of storage capacity. But Texas is investing more in grid-related batteries than any other state (here and here). On August 24 last year I watched while a modest blip of “stored power” reinforced a highly stressed Texas grid just as the sun was setting and demand was peaking (more). Given the chart below, “power storage” is now a much more regular contributor to grid management (more and more).

Batteries, solar panels (and related), and wind turbines (and related) all have complicated, long-distance supply chains facing high demand and technological innovation (more and more and more and more). Each of these separate sectors also share a dependence on at least seventeen rare earths. Supply chain resilience is challenged by the innate rarity of these components — and, potentially, by the over-concentration of global capacity for rare earth production in China (roughly 70 percent).

Given supply chain complexities we could clearly go deeper and wider than above. A full forensic assessment of these supply chains could be an evergreen, never-ending task. But just what is outlined above is evidence of an innovative sector that is growing quickly in an ambitious effort to fulfill fast-growing demand. What this also — almost ipso facto — means is that the risk of grid failure is structural, systemic, and likely to be stubborn for the next several years (more).

April 27 Update: Yesterday afternoon “ERCOT issued an AAN (Advance Action Notice) due to a possible future Emergency Condition of reserve capacity deficiency beginning Monday April 29, 2024, HE 2000 through Wednesday May 1, 2024, HE 2100. ERCOT may Delay/Withdraw Approved or Accepted Resource Outages. ERCOT may seek up to 2,832 MW from an OAE (Outage Adjustment Evaluation) and then make the OSA (Outage Schedule Adjustment). On Saturday April 27, 2024, at 14:30 ERCOT will execute an OAE if deemed necessary.” Bloomberg explains, “Grid conditions can be tight this time of the year because early heat can increase demand while supplies are hampered by scheduled maintenance in preparation for the summer air-conditioning season. The evening hours are especially vulnerable to shortages as solar power goes offline and other supply has to ramp up.”

April 30 Update: Hot temperatures in Texas increased power demand even more than originally forecast, first chart below. With wimpy winds, natural gas draws surged — and prices did too. See April 29 fuel mix chart below. Matching supply and demand will continue to be challenging.

April 29 Demand on ERCOT Grid

April 29 Fuel Mix on ERCOT Grid

+++

May 6 Update: The Financial Times has published a “Big Read” on how to pay for the green transition. One of several potential angles reported, “Over the next seven years, capital expenditure on renewables will roughly double while fossil fuel capex will halve, according to research from RMI published earlier this year. Falling fossil fuel capex will therefore provide around half of the growth in renewable capex, it concluded.”

Grid Reliability and Supply Chain Resilience

If the grid stays on or comes back quick, supply chains almost always persist. When and where the grid is gone and not bouncing back anytime soon (or anywhere close), supply chain resilience quickly becomes fundamental.

Where water, food, fuel, and pharmaceuticals are still flowing while the grid is gone, human suffering can be mitigated. Where the grid is gone and flows have seriously slowed or stopped, suffering and death will be amplified.

The global grid — including the US network — has undertaken a significant transition in sources and structure. Last year, 2023, the leading sources of US power generation were roughly: 43 percent natural gas, 18 percent nuclear, 16 percent coal, 10 percent wind, 6 percent hydro, 4 percent solar, 3 percent all other. Several projections anticipate this mix to undergo rapid changes in coming years, see chart below.

The financial and technological challenges involved in this transition are considerable. These supply-oriented challenges are super-charged by sharp increases in baseline demand for electricity in some places and, especially, weather-related demand surges (sometimes in the same places).

For almost two decades US electricity demand has been flat. The Energy Information Administration continues to project overall slow growth of about one percent through 2050. But within this general trend are dramatic local differences. Reuters recently reported:

Southern Co expects data centers to propel its electricity sales growth to 6% each year from 2025 to 2028, up from predicted growth of 1% to 2% annually through next year. Sales from its Georgia Power business unit are seen jumping to an unprecedented 9% a year… Executives from American Electric Power, an electric utility based in Ohio, said the company’s retail customer demand grew 2.5% in 2023, much faster than its earlier 0.7% projection, due primarily to the acceleration of data center power use.

On top of these sort of baseline increases, some regions — especially in the southern and western United States — face prospects of volatile demand related to extreme weather (more and more and more and more). For example, according to the Electric Reliability Council of Texas between June 27 and August 10, 2023 the Texas grid experienced ten successive all-time peak demand records as a result of high heat. The more expansive — and populated — these areas of extreme temperature, the more challenging to deliver reliable supplies. (Cold can also complicate, see here and here.)

NERC Summer Reliability Assessments for 2024 will be available next month (related here and here and here).

Meanwhile we already have several indicators of a significant 2024 Hurricane Season. Last week the Weather Channel projected, “24 named storms, 11 of which will become hurricanes and six of which will reach Category 3 status or stronger. T​hat is well above the 30-year average tally for both hurricanes and storms, and also markedly above the tally of 20 storms, seven hurricanes and three Cat 3-plus hurricanes in 2023.” In a similar season forecast, the well-respected team at Colorado State University “predicts that 2024 hurricane activity will be about 170% of the average season from 1991–2020. By comparison, 2023’s hurricane activity was about 120% of the average season.”

We know how tough grid loss can be as a consequence of hurricanes. Grid failure in the immediate advance of a major hurricane could be even worse, seriously complicating warning, preparation, evacuation, and grid recovery.

The energy transition plus increasing demand plus the increased threat of extreme weather will be a risk multiplier for both the grid and supply chains over the next decade and probably much longer.

Energy Fitness

In my experience supply chain resilience can more-or-less be assumed if the grid persists and fuel is available. It may be difficult and treacherous, but where electricity and fuel can flow, demand and supply will conspire to keep other flows moving too.

I have long argued that Supply Chain Resilience — as strategy and practice — is mostly about how well volumes persist and push fulfills pull when the grid is gone for an extended time over wide areas. In such circumstances, fuel flows and alternative sources of power spike in substantive and financial value.

The world is in the midst of significant, fundamental energy transitions (purposeful plural). A quarter-century from now the grid and other energy sources will be structured and behave very differently than today. The path between now and then is variable, exploratory, and very risky… especially when and where energy demand is surging. (Not making the transition would entail even greater risk.)

Earlier this week I confessed to needing more time before offering anything meaningful about our current energy fitness. I am trying to discern — and accurately condense — how various fossil fuel dependencies and emerging alternative energy sources can (or won’t) play together in case of major hurricanes, earthquakes, cyberattacks, and other very hard hits on people and places.

As my quarter-century framing suggests, there are several longer-term speculative issues to engage. There are also nearer-term issues of grid reliability, natural gas availability, velocity of technological adoption, and many other factors to actively observe and try to anticipate. This morning, though, I am fixated on the following chart of trades on Brent Crude future contracts over the last two years and last few hours.

Given our recent and continuing geopolitical context and as someone who cut-my-teeth on the 1970s oil market, I am amazed — thankful and hopeful — but still amazed and edgy at how this morning’s news is reflected in market expectations. I certainly acknowledge that today’s energy system (and geopolitics) is vastly different from a half-century ago. But in the face of this morning’s price action I should also acknowledge deeply discounting just how different (and what this means for Supply Chain Resilience).

This is not a time to discount risk or reality. This is very much a time to engage reality and risk at full value. Much more to come…

Amplified demand (and supply)

US retail sales growth for March was more than double what many economists expected. The Financial Times reported, “Data from the US Census Bureau published on Monday showed that retail sales, which include spending on food and petrol, rose 0.7 per cent last month. Economists surveyed by Reuters had expected an increase of 0.3 per cent.” It is worth remembering that February US retail sales were not as strong as expected, see chart below. China’s March retail sales were 3.1 percent higher, well below expectations for around a 4.8 percent gain (here and here). EU retail sales data for March are not yet available, but momentum is sluggish (more).

China’s manufacturing output strengthened in March. Export volumes achieved new records, but export values decreased. Some perceive an escalating problem with “over-capacity” characterizing many of China’s key manufacturing sectors (more). Others have argued that China is exporting deflation (here and here). (Might the United States be critiqued for an over-capacity to consume and, thereby, export inflation?) German exports continue below January 2023 levels (more and more). “Total Market Production” in the European Union has basically been flat or falling since the second half of 2022. The data is deeply retrospective, but US real — inflation adjusted — Gross Domestic Product has done very well in the post-pandemic period.

According to the latest US Department of Agriculture’s World Agricultural Supply and Demand Estimate global wheat and rice production is — and is expected to continue to be — abundant for the current year. Soybean production is flat or slightly lower on reduced demand. There is profound hunger in the world, but this reflects insufficient ability to signal demand (e.g. Somalia) and/or distribution problems (e.g., Gaza), not lack of potential supply.

Midstream flows are troubled by volatile — and often higher — fuel prices. Accumulating network friction — such as drought at the Panama Canal and Houthi missiles, drones and more at Red Sea approaches to the Suez Canal — are the cause of cost and delay increases (here and here , but Panama’s precipitation forecast is encouraging). US truck shipments were flat in February (here and here and here). Compared with the last two years and last two months consistently fewer US rail cars are moving. As a result, it makes sense that the supply chain component of core PCE has been increasing (see second chart below). Given continued — even surprising — US consumer demand plus all the midstream pinch points this is healthy adaptation.

You can compare this month’s flow fitness update to last month’s here. I need a bit more time to look at what is happening with both near-term and longer-term energy flows before reaching a fitness judgment regarding those factors.

I worry that the recent pace of US consumer spending is unhealthy. But given weak demand elsewhere, US consumers are arguably the best buddies of the global economy. There are all sorts of potential risks that could suddenly spike (more). But US productivity outputs have continued to be healthy. So… for yet another month pull is motivating push, demand is mostly being supplied. While there is profound uncertainty regarding future trajectories, right now supply chain speed, direction, and resilience are generally positive.

April 18 UPDATE: The Federal Reserve has released its Beige Book for April. After reading the Beige Book reporters at Bloomberg highlighted:

The US economy seems to be weathering the recent spate of supply disruptions with few signs that worrisome inflationary threats or major logistics headaches are returning… Attacks on commercial vessels near the Red Sea and the destruction of Baltimore’s Francis Scott Key Bridge “caused some shipping delays but so far did not lead to widespread price increases,” it said… “Third-party logistics contacts noted that both demand and shipping rates appeared to have bottomed out following what was characterized as an 18-month freight recession.”