The most recent measure of the Global Supply Chain Pressure Index continues at well below the long term average. Despite global inflation, fog and friction of war(s), purposeful production cuts, and increasing complexity of flows, volume is strong. Velocity is much better than two decades ago… or even two years ago.
Agricultural Production: The last several months I have focused on North American output. As Spring begins in the southern hemisphere, I will expand this scope. Wheat and rice are used as indicators. According to USDA, “The outlook for 2023/24 U.S. wheat this month is for higher supplies, increased domestic use, unchanged exports, and higher ending stocks. Supplies are raised 85 million bushels… The global wheat outlook for 2023/24 is for reduced supplies, lower consumption, decreased trade, and lower stocks… Projected 2023/24 global ending stocks are lowered 0.5 million tons to 258.1 million, the lowest since 2015/16.”
“The 2023/24 global rice outlook is for slightly increased supplies, consumption, and trade compared with last month, leaving ending stocks nearly unchanged. With minimal changes to rice production globally, higher beginning stocks for Indonesia explain most of the increase in 2023/24 global supplies. Global trade is raised this month for both 2022/23 and 2023/24 as Indonesia, the fourth-largest rice-consuming country, imports more to replenish government stocks on supply concerns. Global exports are raised slightly on increases for Cambodia and Vietnam. Ending stocks are nearly unchanged from last month at 167.5 million tons, with an offsetting increase to stocks for Indonesia and decreases for China and Colombia, but remain the lowest in six years.”
Global Natural Gas Demand and Supply: Robust production, strong European inventories, and still lack-luster global demand had recently kept prices in check. But the Israel-Hamas conflict — and the risk of wider war — has raised concerns regarding disrupted supplies. Yesterday S&P Global reported, “Gas price benchmark TTF front-month jumped 46% over the course of the week to a Eur52.95/MWh close Oct. 12, the highest in almost eight months… Market participants indicated covering of short positions contributed to the sharp rebound across gas and power markets just ahead of the start of the winter heating season with geopolitical risks trumping supply and demand fundamentals.” US natural gas production, inventories, and flows are healthy.
China Export Volumes and Value: CNBC headlines, China’s exports and imports drop again in September. Bloomberg highlights, “China’s Export Slump Eases as Beijing Works to Bolster Outlook. The South China Morning Post explained, “Exports to the Association of Southeast Asian Nations – China’s largest trading partner – contracted by 15.82 per cent last month, while September’s shipments to the United States fell by 9.34 per cent, year on year, extending a 14-month streak of continuous declines. Exports to the European Union, meanwhile, dropped by 11.61 per cent last month, year on year. “Exports continued to see broad-based weakness across regions and by products,” said economists at HSBC. “Global growth continues to face pressure from tighter monetary conditions while global-goods demand remains weak, relative to services.” (More and more.)
North American Grid Capacity: Wednesday the Energy Information Administration offered:
We forecast that electricity generation from natural gas will account for about 42% of U.S. generation in 2023, an increase from 39% in 2022. This increase is the result of relatively low prices for natural gas; the retirement of 10 gigawatts (GW) of coal-fired generating capacity this year; and 5 GW of new, highly efficient natural gas-turbine capacity entering service. We expect natural gas-fired electricity generation to fall slightly to a 41% share in 2024. Despite a forecast increase in overall electricity generation in 2024, we expect generation from both natural gas and coal will fall next year in part because of increasing generating capacity from renewable sources. Our forecast assumes 40 GW of solar and wind generating capacity will enter service next year, an increase of 16% from this year, leading to the share of electricity provided by renewables rising from 22% in 2023 to 25% in 2024.
This substantive transition is challenging, especially for places with fast-growing demand — like Texas. According to Bloomberg, “The Texas grid operator is seeking to secure an extra 3,000 megawatts of power reserves this winter to avoid an “unacceptable” risk of an emergency in extreme conditions. The Electric Reliability Council of Texas estimates that there is an almost 20% probability that the state grid it manages will enter into an energy emergency alert, or EEA, if there is a repeat of last year’s December storm…” (more and more).
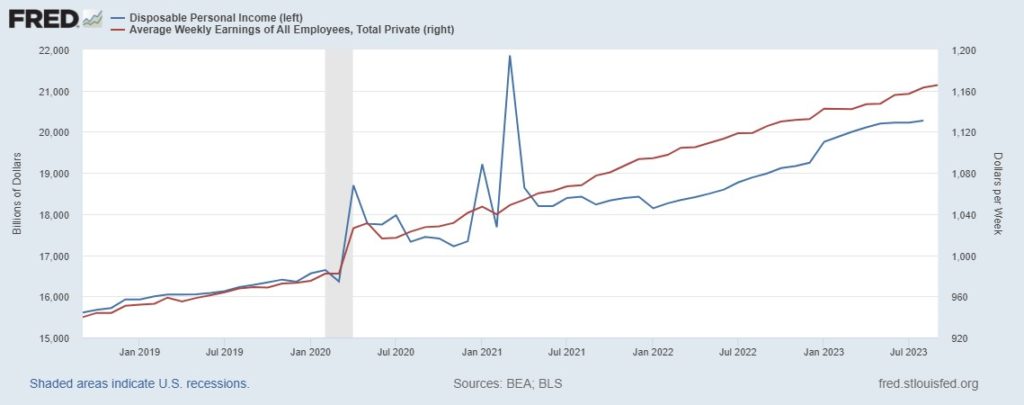
US Personal Consumption Expenditures: Given the stronger than widely anticipated September US Consumer Price Index, the September PCE will probably also show continued resilience. The chart below suggests why. Again I am “hitting the slopes” as well as twinning two distinct measures. The blue line is Disposable Personal Income. The growth rate has slowed, but nominal (not-inflation-adjusted) levels have increased more than 10 percent over the last two years — and by almost one-fifth compared to pre-pandemic. In combination with the red-line’s trajectory (Average Weekly Private Sector Earnings), I don’t see any persuasive reason to anticipate a sudden collapse in US consumer demand, despite marginally reduced personal savings, resumption of student loan payments, rising credit card balances, and more. It is, however, worth noting that US demand has been a persistent outlier among global advanced economies. This week the IMF World Economic Outlook forecast, “global growth to slow from 3.5 percent in 2022 to 3.0 percent in 2023 and 2.9 percent in 2024, well below the historical (2000–19) average of 3.8 percent. Advanced economies are expected to slow from 2.6 percent in 2022 to 1.5 percent in 2023 and 1.4 percent in 2024 as policy tightening starts to bite. Emerging market and developing economies are projected to have a modest decline in growth from 4.1 percent in 2022 to 4.0 percent in both 2023 and 2024.” (More)
There are many mixed measures of supply chains resilience. There are plenty of pinch points and accumulating friction. But given the factors outlined above — and the bounding risks of war and climate disruptions — current conditions in most places are more positive than I often feel should be the case. I am not alone in experiencing some dissonance between what I feel and what I can confirm (see here).
October 18 Update: September retail sales, released yesterday, confirm continued US consumer spending. China’s most recent retail sales report also shows the best improvement since May. Retail consumption in the European Union remains sluggish. Quickly scanning September results for the United States I shave a bit for inflation (your guess is as good as mine until we get the PCE deflator in a couple more weeks). Given the volatility of fuel prices — and last year’s even higher fuel prices — I tend to avoid this teeter-totter as telling me much about the rest of the playground (especially given current geo-politics). I notice that shelter related sales are down about 2 or 3 percent compared to 2022 Year-To-Date. Grocery sales are up over 3 percent for the same period. Eating out is up almost 12 percent. It looks like ecommerce continues to eat up a higher proportion of clothing and general merchandise sales. I am amazed at how much more disposable income is being spent on eating out, otherwise I perceive a demand-and-supply-system behaving more or less at equilibrium. So — if you are a visual thinker — maybe you might imagine a basically healthy, slightly over-weight man walking quickly to make his next appointment while trying to eat an Egg McMuffin (with a hash brown). Unless he trips (or is pushed) he should make his meeting a bit sweaty but okay.