Every four to five weeks I update the following indicators. Here are the July and June updates. These are not comprehensive indicators. For comprehensive please see other sources, such as the Global Supply Chain Pressure Index or the Logistics Managers Index. But combined with more comprehensive measures, these five factors give me a finer sense of overall flow capacity, current discharge, and emerging conditions.
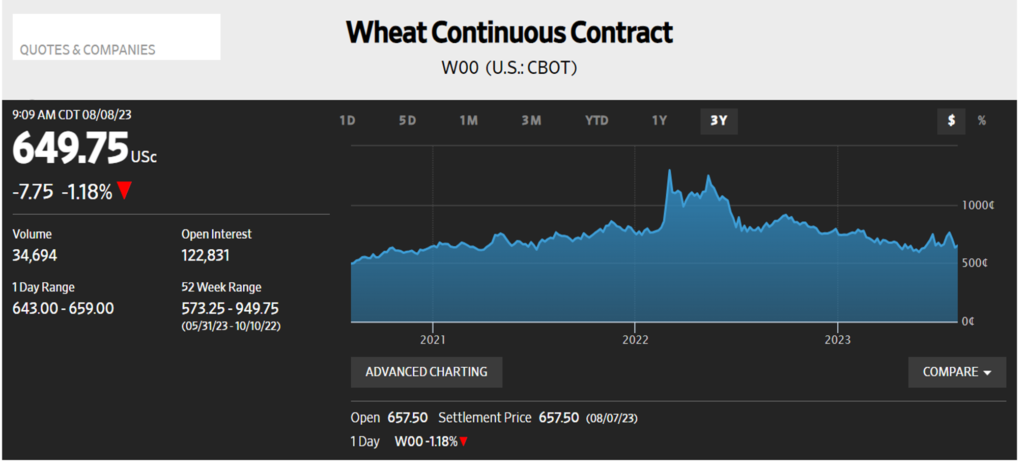
North American Agricultural Production: On August 11 the USDA released its World Agricultural Supply and Demand Estimates. Here are some excerpts:
The outlook for 2023/24 U.S. wheat this month is for decreased supplies, slightly lower domestic use, reduced exports, and higher stocks. Supplies are reduced as wheat production is forecast at 1,734 million bushels, down 5 million from last month… Canada is decreased 2.0 million tons to 33.0 million on worsening drought conditions in the Prairie Provinces… This month’s 2023/24 U.S. corn outlook is for reduced supplies, lower domestic use, smaller exports, and tighter ending stocks… Corn production for 2023/24 is forecast at 15.1 billion bushels, down 209 million from the July projection and if realized, would be the second highest on record behind 2016/17. [Drought has also reduced Canada’s anticipated course grains production.]… The outlook for U.S. rice in 2023/24 is for increased supplies and ending stocks compared with last month and no other changes. The initial survey-based production forecast for the 2023/24 crop increases production from the previous forecast by 2.6 million cwt to 203.6 million, all on higher yields. [Information on crop production outside North America is summarized here, please see updates below the chart.]
[August 17 Update: S&P Global provides a helpful weather watch related to US and global crop conditions.]
Global Natural Gas Demand and Supply: According to most market sources the natural gas market is currently close to a healthy equilibrium. Prices are well-below last year’s war-time premiums. Last week EIA commented, “We expect global liquefied natural gas (LNG) import capacity (also known as regasification capacity) to expand by 16%, or 22.8 billion cubic feet per day (Bcf/d), in 2023‒24 compared with 2022 once all regasification terminals currently under construction are completed.” But some near-term risks to persistent flows are causing some price volatility. S&P Global reports, “Workers at Australia’s Gorgon, Wheatstone and North West Shelf LNG projects are threatening to go on strike due to disagreements over pay and working conditions. Gas companies Woodside and Chevron have been in talks with the workers unions to address their concerns. The three LNG terminals have a total LNG export capacity of around 41 million mt/year that equals to around 10%-11% of global LNG supply. The news has already sent European TTF gas prices and Asian spot LNG prices higher as a disruption could coincide with the early winter restocking season, when Europe competes with Asia for LNG supplies.” (More and more and see chart below.)
China Export Volumes and Value: Reuters reports, “China’s imports and exports fell much faster than expected in July as weaker demand threatens recovery prospects in the world’s second-largest economy… The grim trade numbers reinforce expectations that economic activity could slow further in the third quarter, with construction, manufacturing and services activity, foreign direct investment and industrial profits all weakening… Imports dropped 12.4% in July year-on-year… and off a 6.8% decline in June. Meanwhile, exports contracted 14.5%, steeper than an expected 12.5% decline and the previous month’s 12.4% fall. The pace of export decline was the fastest since the onset of the pandemic in early 2020” (more and more and more). And it should be emphasized, 2022 exports were near record highs, if not quite as high as August and September 2022. Still… the pattern has been persistent and seems unlikely to turn-around soon. China’s exports to the United States are down about one-quarter so far in 2023 (more) and well below pre-pandemic patterns.
North American Grid Capacity: An August 4 post — plus updates on August 10, 12, and 14 — gave considerable attention to this issue. I will add the following blurb from a helpful August 8 EIA report, “In the first half of 2023, developers added 16.8 gigawatts (GW) of new utility-scale electric generating capacity to the U.S. power grid, according to our latest inventory of electric generators. Developers plan to bring an additional 35.2 GW of capacity online in the second half of the year… Solar power accounted for the largest share, 35% (5.9 GW) of the capacity that came online in the first half of 2023. That new capacity is 4.6 GW less than what developers and project planners reported expecting for the period at the beginning of the year. Supply chain constraints were the primary cause for this shortfall.” As the August 4 post note there is a continuing challenge fully connecting and flexibly transmitting this new capacity, especially between major grid regions.
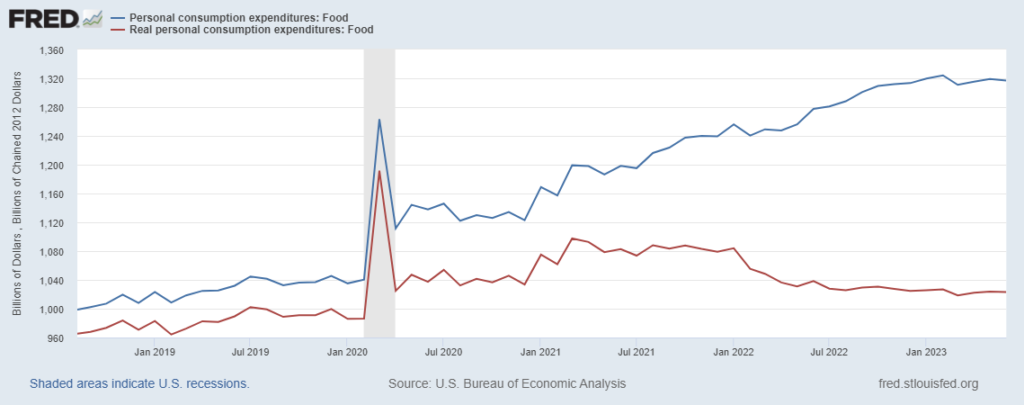
US Personal Consumption Expenditures: Yesterday’s strong July retail sales report suggests that the pattern of Personal Consumption Expenditures for June has persisted (more). I have wanted to see flat, but it is increasingly difficult to obscure the increasing upward slope since March (see second chart below). According to the Census Bureau, “Advance estimates of U.S. retail and food services sales for July 2023, adjusted for seasonal variation and holiday and trading-day differences, but not for price changes, were $696.4 billion, up 0.7 percent (±0.5 percent) from the previous month, and up 3.2 percent (±0.7 percent) above July 2022.”
My read of current vitals: Demand is strong while mostly stable, this facilitates push fulfilling pull. Despite both ordinary — and some extraordinary — threats, North American (and even global) food flows remain sufficient to abundant for those with the ability to pay increasing prices. Global energy supplies, similar to food supplies, are mostly coherent with effectual demand… since demand (especially from China) is not expected to see much near-term growth. Electrical generating capacity is moving in the right direction even if with lagging constraints on transmission/distribution. So… mostly healthy. Threats to all of this are prolific, but barring the hardest hits on the highest proportion concentrations the overall network is demonstrating meaningful capacity, adaptation, and resilience.