[Updates Below] There are several helpful tools to assess the overall health of supply chains, including the Global Supply Chain Pressure Index and the CSCMP Logistics Managers Index. Toward the end of November, I suggested five indicators for fitness of emerging global flows focused on the next six months or so. Here’s an updated assessment:
Southern Hemisphere Agricultural Production: Argentina’s corn crop is forecast to be less than last year’s harvest and at the low end of average production levels (more). Anticipated Brazilian soybean yields have bounced back from last year’s disappointing harvest (more). Australia seems to be on track for a record wheat harvest. Wheat futures have been trending lower since September and are well-below their peaks in May.
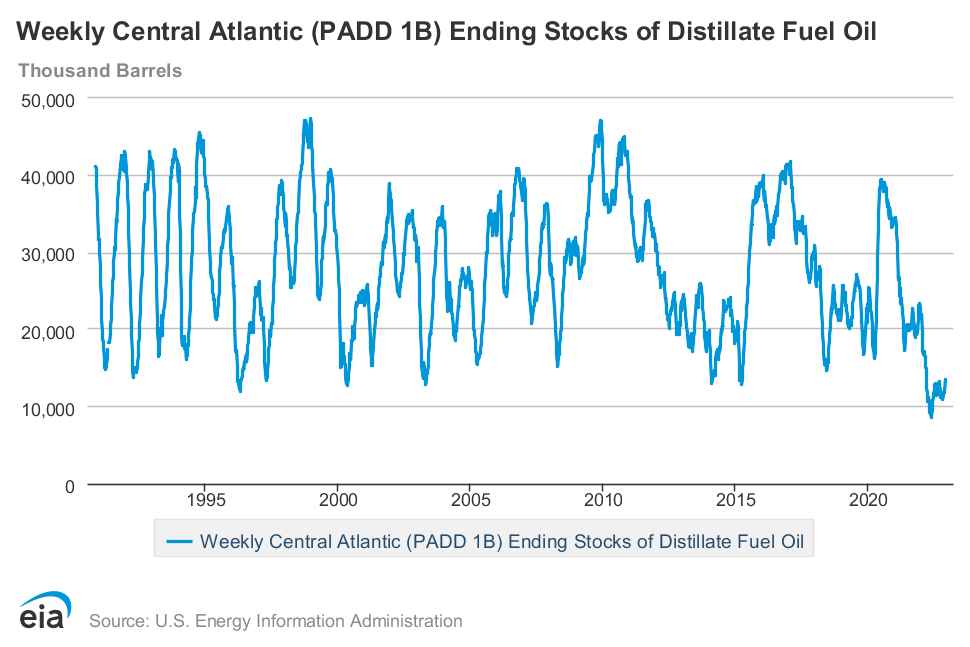
Global Diesel Demand, Production, and Price: The IEA December analysis of November outcomes reported, “Global refinery runs surged by an estimated 2.2 mb/d last month, to 82.3 mb/d, the highest since January 2020. Increased supply of diesel and gasoline coincided with a seasonal lull in transport fuel demand, boosting product stocks which pulled refinery margins lower. In the US and Europe, diesel cracks made record monthly falls from October’s historical peaks, but remain high.” US diesel stocks were up in most US regions for the week ending December 23. US diesel prices were slightly lower. The bomb cyclone that drove south after December 23 has reduced production and increased prices, how high for how long is not yet clear (more and more). Future contracts for January/February New York Harbor deliveries remain off-peak. Same for Amsterdam-Rotterdam-Antwerp diesel futures. (Related)
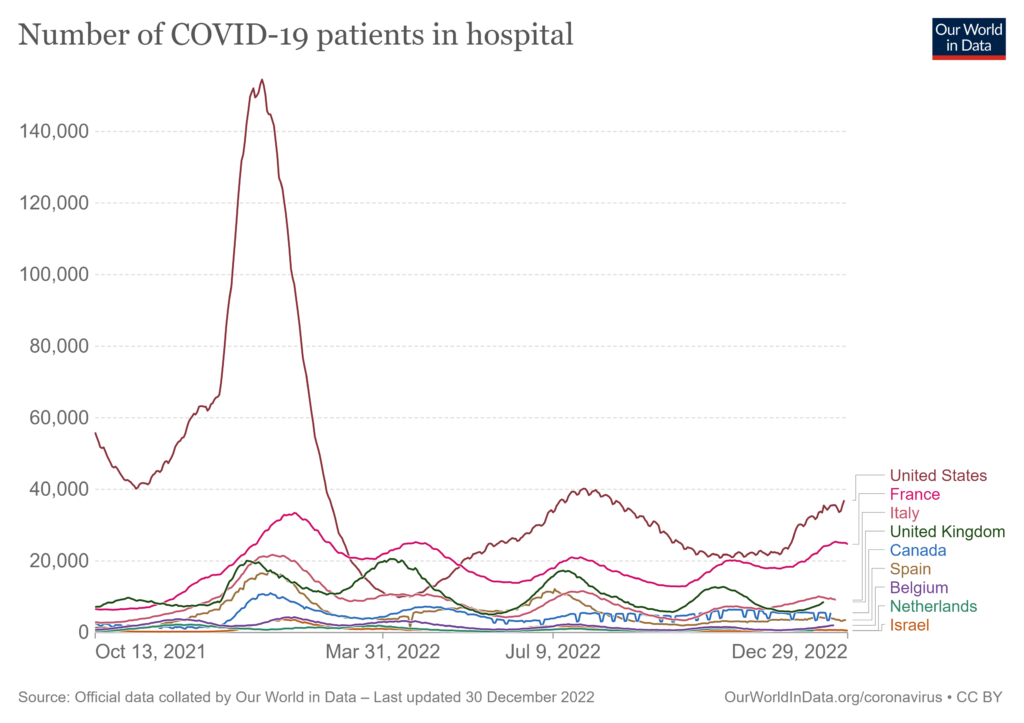
Covid Hospitalizations (and mutations): Transmissions and morbidity are up, especially in the Northern Hemisphere (see chart below). The situation in China is very tough to assess. Since late November public health policy and practice in China has radically changed (more and more and more). There is clearly much more transmission and much more movement of infected people. The virulence associated with this surge — and any related mutation trends — will require a few more weeks to unfold. But, so far, no new variants have been detected (more).
Chinese Export Volumes and Value: According to China’s General Administration for Customs and TradingEconomics, “Exports from China plunged 8.7% yoy in November 2022 to USD 296.1 billion, worse than market consensus of a 3.5% drop and following a 0.3% fall month earlier. This was the second straight month of decline in shipments, and the steepest fall since February 2020, amid weakening global demand due to high inflation and aggressive monetary tightening by major economies and production disruptions lingered.”
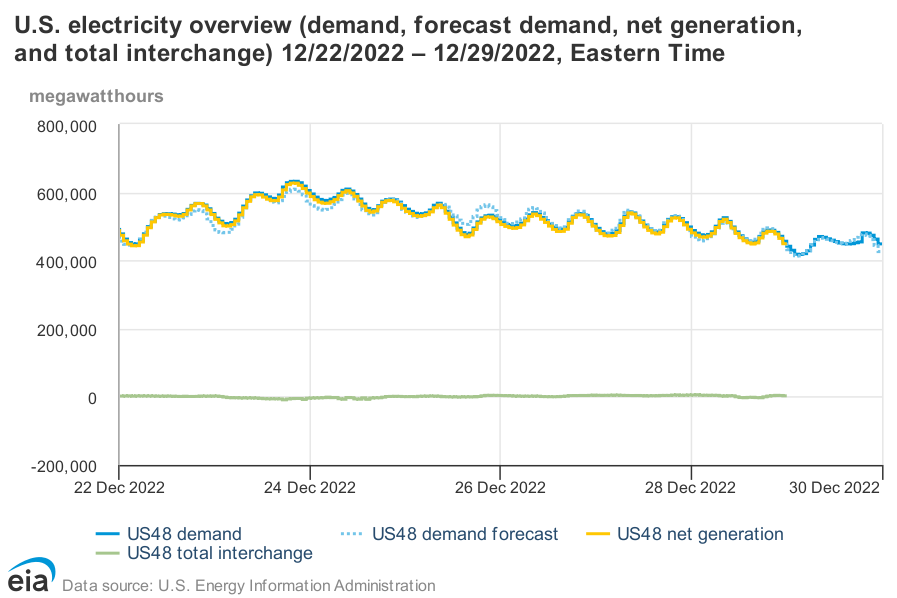
North American Electricity Demand and Supply: The bomb cyclone (more) played havoc with energy demand forecasts, prompting last minute efforts to reduce demand and increase supply across much of North America east of the Rocky Mountains (see chart below, please note divergence between demand forecast, demand, and generation especially on December 23 and 24 ). The Wall Street Journal editorial board commented:
Utilities and grid operators weren’t prepared for the surge in demand for natural gas and electricity to heat homes, which occurred as gas supply shortages and icy temperatures forced many power plants off-line. The PJM Interconnection, which provides electricity to 65 million people across 13 eastern states, usually has surplus power that it exports to neighboring grids experiencing shortages, but this time it was caught short. Gas plants in the region couldn’t get enough fuel, which for public-health reasons is prioritized for heating. Coal and nuclear plants can’t ramp up like gas-fired plants to meet surges in demand, so PJM ordered some businesses to curtail power usage and urged households to do the same through Christmas morning. Rolling blackouts were narrowly averted as some generators switched to burning oil. (More and more and more.)
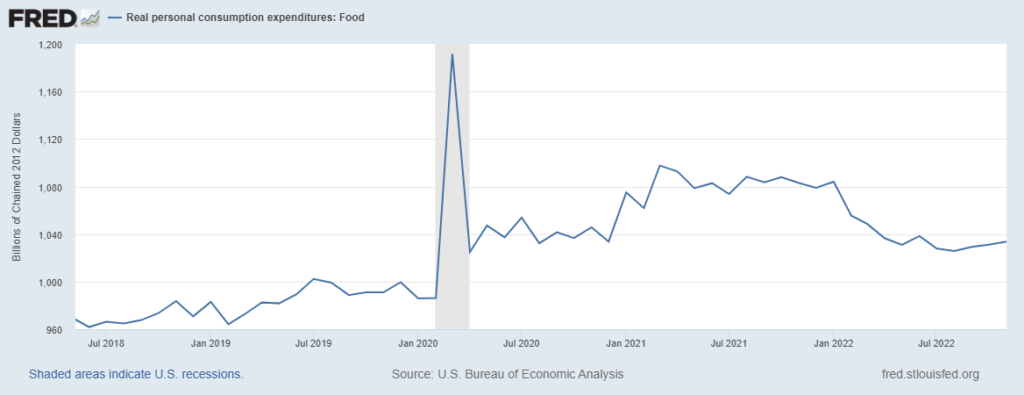
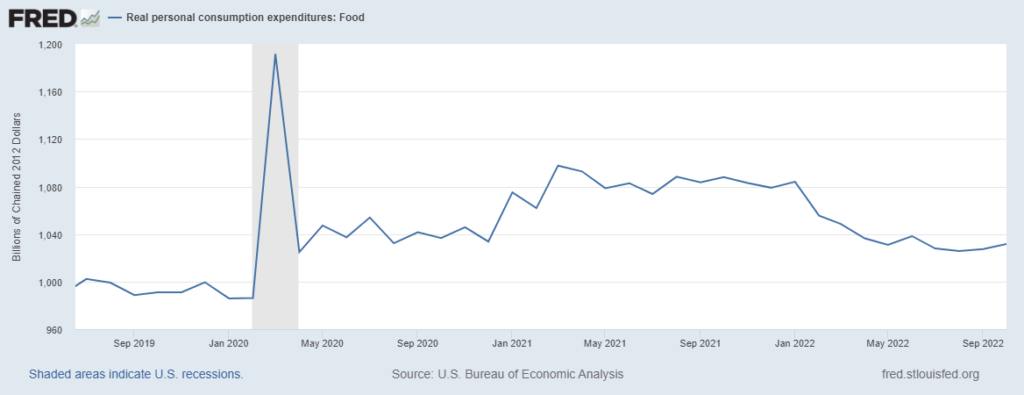
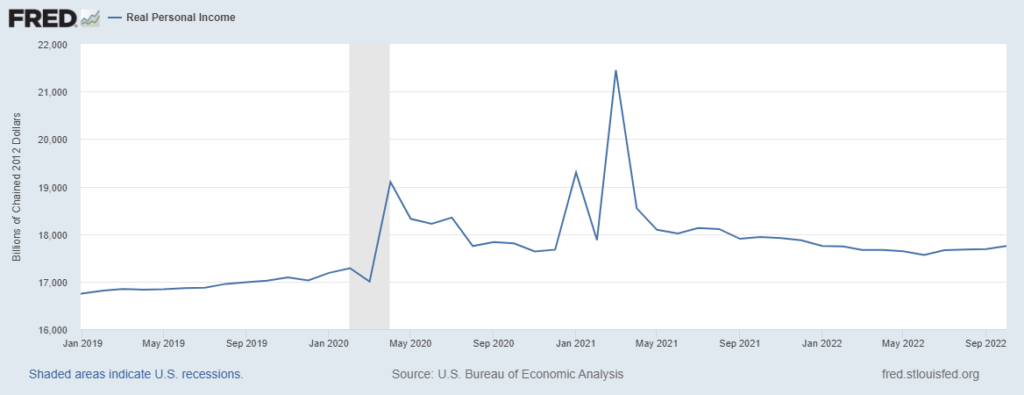
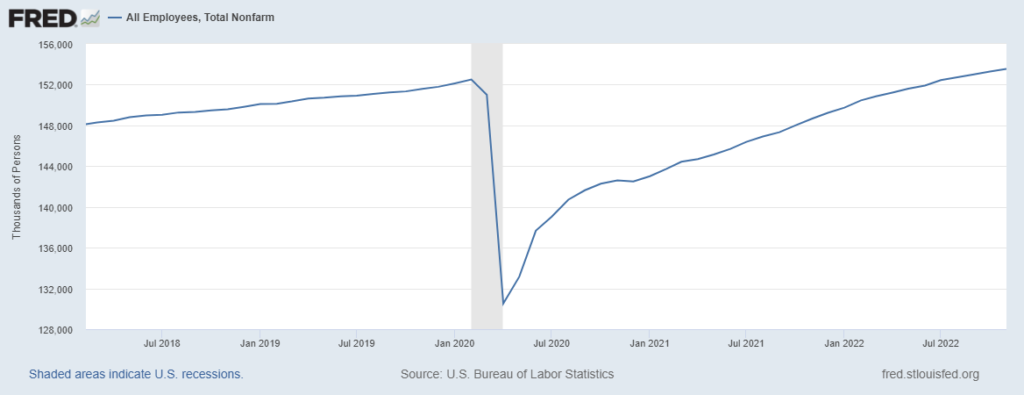
Compared to one year ago, flows have slowed. Given the war in Europe — with direct effects on food and energy flows — this is unsurprising. Reduced demand for China’s output — by both domestic and international customers — is also a factor. Efforts by North American and European Central Bankers to reduce inflation is another constraint. Given the risks, flows are better than many credible mid-summer projections. War is a perpetual wild card. A wider war — and any new wars — could seriously impede flows. Many worst-case and best-case projections now depend a great deal on what happens in China. An invasion of Taiwan would be catastrophic. If the current dismantling of counter-covid constraints unfolds without spawning a surge in global deaths, then a combination of American and Chinese consumer demand could pull enough to substantially increase both volume and speed of global flows… for better and worse.
+++
January 2 Update: Reuters reports, “China’s factory activity shrank for the third straight month in December and at the sharpest pace in nearly three years as COVID infections swept through production lines across the country after Beijing’s abrupt reversal of anti-virus measures.” More context is available in my December 19 post with several updates.
January 3 Update: Bloomberg reports, “Nearly a dozen major Chinese cities are reporting a recovery in subway use, a sign that an ‘exit wave’ of Covid infections may have peaked in some urban areas… The rise is evidence to support an official statement on Sunday that the Covid outbreak has peaked in the southern manufacturing hub of Guangzhou, where the number of patients at fever clinics have been declining since Dec. 23. Last week, health authorities said infections have peaked in Beijing, Tianjin and Chongqing.” Meanwhile, the Wall Street Journal reports, “In a Dec. 29 article published in Frontiers of Medicine, a medical journal sponsored by China’s Ministry of Education, a team of researchers warned that some provinces in central and western China and in rural areas would be hit by a wave of infections in mid- to late-January. The duration and magnitude of the coming outbreak “could be dramatically enhanced by the extensive travels” during the Lunar New Year, the researchers wrote.” (More and more.) Based on currently available data, the European Centre for Disease Prevention and Control reports, “The variants circulating in China are already circulating in the EU, and as such are not challenging for the immune response of EU/EEA citizens. In addition, EU/EEA citizens have relatively high immunisation and vaccination levels. Given higher population immunity in the EU/EEA, as well as the prior emergence and subsequent replacement of variants currently circulating in China by other Omicron sub-lineages in the EU/EEA, a surge in cases in China is not expected to impact the COVID-19 epidemiological situation in the EU/EEA.”