Author: Philip J Palin

Hearing does not always mean listening

Yesterday I watched/listened to most of a hearing conducted by the Budget Committee of the United States Senate entitled: Bottlenecks and Backlogs: How Climate Change Threatens Supply Chains. The link provides access to a video of the hearing and separate links to the prepared testimony of five expert witnesses. The testimony of Kathy Fulton and Scott Kelly each offer particular attention to supply chain capacity concentrations, a frequent focus of this blog.

In one way or another, explicitly and not, all five witnesses give attention to capacity concentrations, climate change, and supply chain adaptation. There were five different angles on reality. Each angle is worth your time to scan and consider.

I do not recommend watching the video rehash the hearing’s political theater. I did not hear many — perhaps not any — authentic questions. I heard too much posturing and positioning regarding pre-cooked political/ideological angles. I wish the senators would have listened more carefully to the witnesses and given more time to supply chain related questions.

The hearing began shortly after 10AM Eastern Time. I pulled up the hearing a few hours into watching Hurricane Otis explode into Acapulco (more and more and more and see the NASA time-lapse below). Then just as the hearing opened Hurricane Tammy surprised me. A fresh NHC update for this North Atlantic cyclone noted, “sustained winds have increased to near 105 mph (165 km/h) with higher gusts.” This late-stage rapid intensification is an increasing challenge. Just last week a new study reported, “Mean maximum Tropical Cyclone intensification rates are up to 28.7% greater in a modern era (2001–2020) compared to a historical era (1971–1990).” The last two years I have seen a similar threat spin up too close to Tampa. There are plenty of other crucial capacity concentrations that are as vulnerable.

On two screens I watched weird weather swirling with real-time force, while on a third screen I heard a weird debate regarding climate-related epistemology: What can we know? What do we know? How can we appropriately adapt to what we know?

Especially in terms of supply chain risk there can be a range of plausible answers to these questions. It often depends on the particular network, its innate vulnerabilities, and the specific threat (Force-On-Target) involved… an earthquake is different from a cyclone which is different from a cyber-attack which is not the same as a sudden loss of labor regardless of cause…

But we can know, we do know — as Kathy Fulton and Scott Kelly set out (and at least two other witnesses seemed to agree) — that supply chain capacity is increasingly concentrated. This concentration of demand and supply is often happening in places susceptible to extreme weather (climate change or not), seismic activity, and other aspects of punctuated equilibrium (here and here). This increased exposure to risk (and, plausibly, increased risk frequency and intensity) can have catastrophic consequences when, in Kathy Fulton’s words, “these capacity concentrations are disrupted due to extreme weather events, bottlenecks become chokepoints, and the impacts can ripple far beyond the communities in which they exist.”

Too often the human mind is fixated on the urgency (or not) of a perceived external threat rather than the implications of self-created vulnerabilities. External threats are almost always tough to predict and manage. Many of our vulnerabilities are self-created and, as a result, fully susceptible to self-managed mitigation… if we will accept that reality and our related responsibilities.

“The above animation shows Otis in the eastern Pacific Ocean as it’s making its way northward towards the southwest coast of Mexico.  The animation begins with a 24-hour time loop of surface rainfall estimates from NASA’s IMERG precipitation product starting at 7:11 a.m. CDT (12:11 UTC) Oct. 23 when the center was about 400 miles (640 km) south-southeast of Acapulco…” NASA Global Precipitation Measurement

Bad but getting better?

Below are the USGS water gage outputs for the Mississippi River at Memphis. Last week an all-time recorded low was reported (blue line), even lower than last year’s (brown line). According to Yale Climate Connections:

In Memphis, Tennessee, the river dipped to a new record-low water level of -10.81 feet on Saturday, October 22. The previous record was -10.70 feet, set on July 10 during the notorious summer of 1988. That year had America’s costliest drought since at least 1980, with $51 billion in damages. Data for the Memphis gauge goes back to 1933. (Typically, the zero level on a river gauge is set so that values go negative only during prolonged, intense dry spells.)

Extended drought across much of the great river’s watershed (here and here) has meant reduced agricultural yields in many places. (But as the harvest moves into the second half, I am hearing reports of better yields than expected in some places. A few random showers and better genetics are being credited.) Midstream flows of export crops are being constrained by the reduced stream flows (more and more and more). Further downstream an even more urgent threat has emerged as the reduced flow of fresh water is allowing salt water to move upstream threatening drinking water supplies (more and more).

Fragile and Unstable Equilibrium

That’s an accurate distillation. A whole host of flows demonstrate a rough current balance of demand and supply. There are manifold endogenous and exogenous sources of instability. While many flows are huge, there are so many active sources of instability and potential chokepoints it would be foolish to deny innate fragility.

This helpful phrase is how the International Gas Union describes the 2023 market for natural gas:

Gas prices have cooled in 2023, largely due to demand-side adjustments in Europe and Asia, yet they remain above pre-covid and pre energy crisis levels. The shortage of global supply, which was the key reason behind last year’s shocks, is still there: the market is in a state of a fragile and unstable equilibrium. This cooling has been driven by demand contraction, marginal supply growth and infrastructure debottlenecking. Nonetheless, Europe’s growing dependence on LNG has rendered global gas prices increasingly vulnerable to global LNG supply risk.

Most of the IGU Global Gas Report was completed before the October 7 explosion of conflict between Hamas and Israel — with potential significant repercussions for global energy markets. In a last-minute preface, last week the IGU warned:

While Europe’s commendable rapid development of new infrastructure and efficient utilisation of existing gas networks has been critical in rebalancing the regional situation, we should not forget that it does not eliminate the lingering supply risk, as global gas supply remains just as constrained. Undoubtedly, we saw greater focus on energy security by governments, energy companies, and financial institutions, with investments in infrastructure for source diversification and alternative energy sources. This helped to establish a new equilibrium in the gas market, although it remains unstable and seems already challenged by the new conflict in the Middle East between Israel and Hamas.

“Fragile and unstable equilibrium” can also describe flows for rice, wheat (more), diesel, many semiconductors, whole categories of pharmaceuticals, and much more.

+++

October 24 Update: S&P Global provides the following angle on potential instability in European gas flows — even with winter inventories topped off. “The Platts assessed Dutch TTF front-month contract jumped 45% to a 9-month high of Eur55/MWh Oct.13, despite near full European storage levels. This rally coincided with the start of the Israel-Hamas war, announced industrial action at Chevron’s Australian LNG facilities, alleged “external activity” damaging the Balticconnector pipeline. A series of bullish news over the Oct.7-8 weekend sparked geopolitical and supply uncertainty in an already volatile natural gas market.”

Geopolitics, Energy Transition, and Demographic Change

Yesterday the team at Bloomberg Surveillance interviewed Alex Brazier from BlackRock. It was an often nerdy, but strategically valuable conversation. The Great Moderation is over. Mega forces point to significant regime changes. We are on the edge of a generational re-set. We will experience a series of “negative supply shocks”. Geopolitics, the energy transition, and demographic shifts will be the principal drivers. The discussion begins at about the 57 minute mark, it continues for about seven minutes.

Running loose (into trouble?)

The most recent measure of the Global Supply Chain Pressure Index continues at well below the long term average. Despite global inflation, fog and friction of war(s), purposeful production cuts, and increasing complexity of flows, volume is strong. Velocity is much better than two decades ago… or even two years ago.

Agricultural Production: The last several months I have focused on North American output. As Spring begins in the southern hemisphere, I will expand this scope. Wheat and rice are used as indicators. According to USDA, “The outlook for 2023/24 U.S. wheat this month is for higher supplies, increased domestic use, unchanged exports, and higher ending stocks. Supplies are raised 85 million bushels… The global wheat outlook for 2023/24 is for reduced supplies, lower consumption, decreased trade, and lower stocks… Projected 2023/24 global ending stocks are lowered 0.5 million tons to 258.1 million, the lowest since 2015/16.”

“The 2023/24 global rice outlook is for slightly increased supplies, consumption, and trade compared with last month, leaving ending stocks nearly unchanged. With minimal changes to rice production globally, higher beginning stocks for Indonesia explain most of the increase in 2023/24 global supplies. Global trade is raised this month for both 2022/23 and 2023/24 as Indonesia, the fourth-largest rice-consuming country, imports more to replenish government stocks on supply concerns. Global exports are raised slightly on increases for Cambodia and Vietnam. Ending stocks are nearly unchanged from last month at 167.5 million tons, with an offsetting increase to stocks for Indonesia and decreases for China and Colombia, but remain the lowest in six years.”

Global Natural Gas Demand and Supply: Robust production, strong European inventories, and still lack-luster global demand had recently kept prices in check. But the Israel-Hamas conflict — and the risk of wider war — has raised concerns regarding disrupted supplies. Yesterday S&P Global reported, “Gas price benchmark TTF front-month jumped 46% over the course of the week to a Eur52.95/MWh close Oct. 12, the highest in almost eight months… Market participants indicated covering of short positions contributed to the sharp rebound across gas and power markets just ahead of the start of the winter heating season with geopolitical risks trumping supply and demand fundamentals.” US natural gas production, inventories, and flows are healthy.

China Export Volumes and Value: CNBC headlines, China’s exports and imports drop again in September. Bloomberg highlights, “China’s Export Slump Eases as Beijing Works to Bolster Outlook. The South China Morning Post explained, “Exports to the Association of Southeast Asian Nations – China’s largest trading partner – contracted by 15.82 per cent last month, while September’s shipments to the United States fell by 9.34 per cent, year on year, extending a 14-month streak of continuous declines. Exports to the European Union, meanwhile, dropped by 11.61 per cent last month, year on year. “Exports continued to see broad-based weakness across regions and by products,” said economists at HSBC. “Global growth continues to face pressure from tighter monetary conditions while global-goods demand remains weak, relative to services.” (More and more.)

North American Grid Capacity: Wednesday the Energy Information Administration offered:

We forecast that electricity generation from natural gas will account for about 42% of U.S. generation in 2023, an increase from 39% in 2022. This increase is the result of relatively low prices for natural gas; the retirement of 10 gigawatts (GW) of coal-fired generating capacity this year; and 5 GW of new, highly efficient natural gas-turbine capacity entering service. We expect natural gas-fired electricity generation to fall slightly to a 41% share in 2024. Despite a forecast increase in overall electricity generation in 2024, we expect generation from both natural gas and coal will fall next year in part because of increasing generating capacity from renewable sources. Our forecast assumes 40 GW of solar and wind generating capacity will enter service next year, an increase of 16% from this year, leading to the share of electricity provided by renewables rising from 22% in 2023 to 25% in 2024.

This substantive transition is challenging, especially for places with fast-growing demand — like Texas. According to Bloomberg, “The Texas grid operator is seeking to secure an extra 3,000 megawatts of power reserves this winter to avoid an “unacceptable” risk of an emergency in extreme conditions. The Electric Reliability Council of Texas estimates that there is an almost 20% probability that the state grid it manages will enter into an energy emergency alert, or EEA, if there is a repeat of last year’s December storm…” (more and more).

US Personal Consumption Expenditures: Given the stronger than widely anticipated September US Consumer Price Index, the September PCE will probably also show continued resilience. The chart below suggests why. Again I am “hitting the slopes” as well as twinning two distinct measures. The blue line is Disposable Personal Income. The growth rate has slowed, but nominal (not-inflation-adjusted) levels have increased more than 10 percent over the last two years — and by almost one-fifth compared to pre-pandemic. In combination with the red-line’s trajectory (Average Weekly Private Sector Earnings), I don’t see any persuasive reason to anticipate a sudden collapse in US consumer demand, despite marginally reduced personal savings, resumption of student loan payments, rising credit card balances, and more. It is, however, worth noting that US demand has been a persistent outlier among global advanced economies. This week the IMF World Economic Outlook forecast, “global growth to slow from 3.5 percent in 2022 to 3.0 percent in 2023 and 2.9 percent in 2024, well below the historical (2000–19) average of 3.8 percent. Advanced economies are expected to slow from 2.6 percent in 2022 to 1.5 percent in 2023 and 1.4 percent in 2024 as policy tightening starts to bite. Emerging market and developing economies are projected to have a modest decline in growth from 4.1 percent in 2022 to 4.0 percent in both 2023 and 2024.” (More)

There are many mixed measures of supply chains resilience. There are plenty of pinch points and accumulating friction. But given the factors outlined above — and the bounding risks of war and climate disruptions — current conditions in most places are more positive than I often feel should be the case. I am not alone in experiencing some dissonance between what I feel and what I can confirm (see here).

October 18 Update: September retail sales, released yesterday, confirm continued US consumer spending. China’s most recent retail sales report also shows the best improvement since May. Retail consumption in the European Union remains sluggish. Quickly scanning September results for the United States I shave a bit for inflation (your guess is as good as mine until we get the PCE deflator in a couple more weeks). Given the volatility of fuel prices — and last year’s even higher fuel prices — I tend to avoid this teeter-totter as telling me much about the rest of the playground (especially given current geo-politics). I notice that shelter related sales are down about 2 or 3 percent compared to 2022 Year-To-Date. Grocery sales are up over 3 percent for the same period. Eating out is up almost 12 percent. It looks like ecommerce continues to eat up a higher proportion of clothing and general merchandise sales. I am amazed at how much more disposable income is being spent on eating out, otherwise I perceive a demand-and-supply-system behaving more or less at equilibrium. So — if you are a visual thinker — maybe you might imagine a basically healthy, slightly over-weight man walking quickly to make his next appointment while trying to eat an Egg McMuffin (with a hash brown). Unless he trips (or is pushed) he should make his meeting a bit sweaty but okay.

September CPI and supply chain fitness

Yesterday’s Producer Price Index and this morning’s Consumer Price Index (both for September) each confirm robust US demand (more and more and more). Most American consumers remain active and ready to spend.

Pricing trends suggest that demand exceeds current supply in several categories, including shelter, energy, and most energy-related categories such as transportation. This summer prices for used cars and trucks softened considerably, implying a better balance of supply and demand than this Spring or most of last year. Where prices have fallen most (e.g., natural gas), it is often the result of previous price-increases arguably over-shooting any credible mismatch with supply — and/or over-estimating demand.

Over time price increases that maintain or exceed recent profit margins typically attract more reliable supply — at least until prices reach a point of demand destruction. Mature markets sometimes feature disciplined (often dominant) suppliers reluctant to increase costs or reduce margins related to shifts in demand perceived to be ephemeral. Immature markets often do not have the existing capacity to fulfill demand significantly higher than long-expected. Gradually increasing demand is, usually, the most supportive of Supply Chain Resilience.

I expected increased demand for food during the pandemic would prove transitory. Instead it seems to have claimed a new normal, please see chart below. Both Food At Home (blue line) and Food Away From Home (red line) have far outpaced any prior rate of sustained growth. Fulfilling this demand was a challenge between 2020 and early 2022. But this year a healthy equilibrium of demand and supply seems to have been achieved. According to the Bureau of Labor Statistics:

The food index rose 0.2 percent in September, as it did in the previous two months. The index for food at home increased 0.1 percent over the month, after rising 0.2 percent in August. Three of the six major grocery store food group indexes increased over the month. The index for meats, poultry, fish, and eggs rose 0.5 percent in September as the index for pork increased 1.6 percent. The index for other food at home increased 0.3 percent over the month and the index for dairy and related products rose 0.1 percent. The index for cereals and bakery products decreased 0.4 percent in September, the first decline in that index since June 2021. The fruits and vegetables index was unchanged over the month, as was the nonalcoholic beverages index. The food away from home index rose 0.4 percent in September. The index for limited service meals and the index for full service meals each increased 0.4 percent…. The food at home index rose 2.4 percent over the last 12 months… The index for food away from home rose 6.0 percent over the last year.

Food and fuel have often been the most volatile elements in the Consumer Price Index. During 2023 Food At Home has been remarkably stable. This reflects strong upstream capacity, efficient midstream distribution, a competitive downstream retail context, and persistent, consistent consumer demand (more) that has — so far — resisted down-shifting much from the new normal achieved over the last year-plus.

Whither goest demand

Supply tracks demand. Push follows pull. Flow seeks fulfillment — unless demand is silenced, unless push is obstructed, unless flow is drained by extreme upstream drought.

According to the Wall Street Journal, “U.S. hiring surged last month, the latest sign of accelerating economic momentumEmployers added 336,000 jobs in September, the strongest gain since January and up sharply from the prior month’s upwardly revised 227,000 gain… Job growth was also stronger in July than previously estimated.” (See blue line on the chart below.)

The Bureau of Labor Statistics also reports, “In September, average hourly earnings for all employees on private nonfarm payrolls rose by 7 cents, or 0.2 percent, to $33.88. Over the past 12 months, average hourly earnings have increased by 4.2 percent. In September, average hourly earnings of private-sector production and nonsupervisory employees rose by 6 cents, or 0.2 percent, to $29.06.”

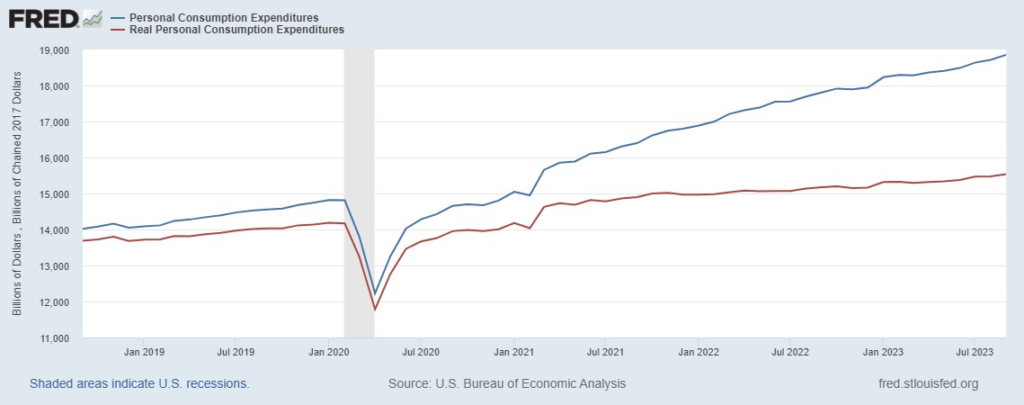
Given these employment outcomes we should not be surprised if September Personal Consumption Expenditures (PCE) show continued strength (see red line below for PCE through August).

Many are very surprised by the September employment numbers. Bloomberg Economics was expecting closer to 173,000 new jobs. I sympathize with this gap. In recent weeks I have blogged less than usual. When I am missing in action here that usually means intense action in non-digital spaces. But this time my quiescence is much more the consequence of stubborn paradox. I am always uncertain. But the last few weeks my best assessments have been self-contradictory. Evidence available to me on the direction, speed, and rate of change related to the resilience of future flows has been especially inconsistent, even antagonistic.

I remain confident in the power of demand. I see where demand has been. I’m especially uncertain where demand is going and how quickly demand will shift — whichever way it goes.

US personal consumption

Here’s the BEA up top summary:

Personal income increased $87.6 billion (0.4 percent at a monthly rate) in August, according to estimates released today by the Bureau of Economic Analysis… Disposable personal income (DPI), personal income less personal current taxes, increased $46.6 billion (0.2 percent) and personal consumption expenditures (PCE) increased $83.6 billion (0.4 percent). The PCE price index increased 0.4 percent. Excluding food and energy, the PCE price index increased 0.1 percent… Real DPI decreased 0.2 percent in August and real PCE increased 0.1 percent; goods decreased 0.2 percent and services increased 0.2 percent…

The Wall Street Journal frames these results with, “Consumer spending, the economy’s main engine, has been strong much of this year. A solid labor market and slower price increases have boosted Americans’ inflation-adjusted incomes, propelling purchases… Some of the factors that helped consumer spending in the past two years are fading and signs of stress are emerging: Many Americans are dipping into savings. The personal saving rate, a measure of how much money people have left each month after outlays and taxes, has trended down.”

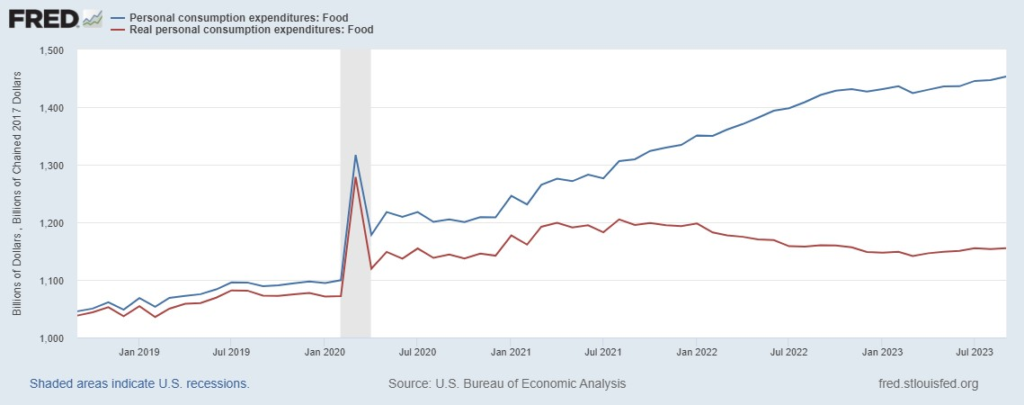
Nominal food consumption increased slightly. Real consumption declined ever so slightly (see chart below) from about 1155 billion 2017 dollars in July to about 1153 billion 2017 dollars in August. Food prices can be volatile. But not this year. Demand and supply have found a working balance.

EU Natgas flows

Price is lower than last year, but high enough that EU demand for natural gas continues much lower than two years ago– yet is sufficient to pull LNG flows from far away to replace Russia’s flows that are now mostly gone. Matching supply and demand depends a great deal on winter weather. Temperatures are forecast to be normal to slightly above normal and even “winter as a whole is predicted likely to be warmer than average…” Below is a very helpful pipeline flow map from S&P Global with further information on floating and other flows (access link for more details).

Infographic: European gas, power demand set for first gains since crisis

Midstream constraints

Trucks, pipelines, barges, and ports get most of my attention. Railways and ocean-going vessels are crucial to discharging upstream capacity and long-distance volumes, but not as vital to the flows I most often follow: consumer-facing food and fuel. Air freight — belly cargo and more — is important to some flows (e.g., fresh fruit, flowers, pharmaceuticals), but my focus is usually on higher volume, lower per-unit-value flows.

Freight volumes are seriously difficult to estimate, but according to the US Bureau of Transportation Statistics in recent years trucking has accounted for about 13,000 million-tons (MT) per year of US freight, pipelines carry about 3800 MT per year, rail accounts for 1500 MT, and inland waterways carry a bit more than a 900 MT. Air cargo carries lots of value, but not much volume. Construction material, refined fuel, and food/agriculture products are the largest truck cargo categories. Accordingly, I am usually preoccupied with trucking capacity and capabilities.

If refineries are operating and pipelines are delivering fuel to racks, trucks will usually be able to pickup and deliver food and related products. The pipelines — e.g., Colonial, Central Florida, Olympia, and plenty more — are fundamental. For Florida (especially in hurricane season) if barges are able to deliver fuel to Tampa, Port Everglades (Ft. Lauderdale), Jacksonville, and Port Canaveral then trucks should be able to keep coming and going. Barges and other vessels need working ports. In addition to Florida’s ports, the inbound ports at San Juan, Honolulu, and Anchorage are key to feeding hundreds-of-thousands, so I am attentive to what is happening (or not) at outbound facilities for Jacksonville, Oakland, Long Beach, and Seattle/Tacoma.

My choices inevitably exclude. This does not mean other places are unimportant. For example, the Mississippi River and the Port of New Orleans are the principal routes for US agricultural exports. I try to be aware of what I am excluding. I want to be able to quickly insert what I have left out. My particular priorities have more to do with my own intellectual and strategic constraints than anything else. Given personal limitations related to available data, time, perceived risks, relationships, understanding, and potential influence, where and how can I be most constructive?

Even after setting boundaries, details can be challenging. For example, consider the map below. According to FreightWaves, “height represents outbound tender lead time. The taller the market, the more advance notice tenders will need to secure reliable capacity. The colors represent the Headhaul Index. The darker red a market turns, the greater the ratio of inbound loads to outbound ones. On the flip side, more vibrant blue markets have higher volumes of outbound freight.”

Each freight market has a different pattern of pull and push. As usual, Central and South Florida — tall and red — are pulling much more inbound freight than they send outbound. Tourism, retirement services, and financial management fees generate lots of income that can pull plenty of volume. But backhaul opportunities are slim. As usual, Eastern Pennsylvania — tall and blue — is pushing lots of volume into mid-Atlantic metro areas. There are also seasonal dynamics at play as implied by the elevations emerging as harvest arrives across the northern tier.

National freight capacity (more) provides important context, but regional variations can be significant especially if a planned bottleneck becomes a chokepoint. The cyberattack and resulting shut down of the Colonial Pipeline is an example. Problems right now on the Mississippi River and Panama Canal are relevant. The George Washington Bridge into New York City or the I-5 serving Seattle or the I-95 umbilical cord for Miami are just a few local examples of highly concentrated localized midstream capacity. Upstream needs midstream to deliver to downstream.