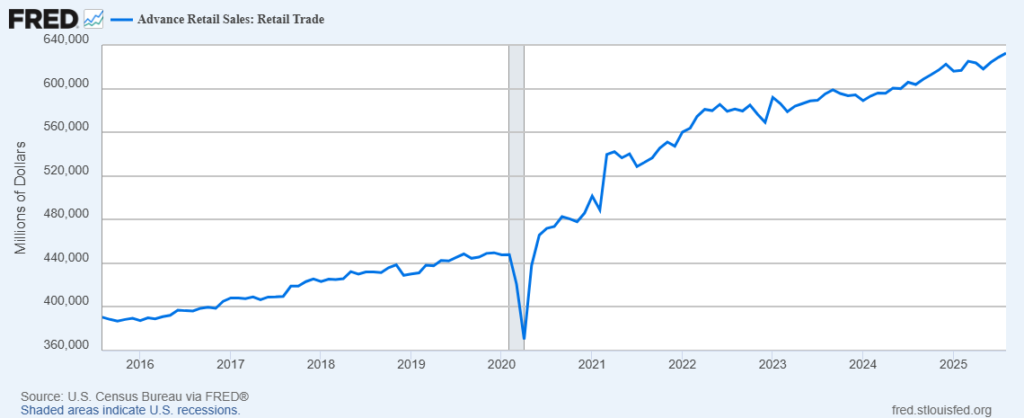
Author: Philip J Palin

Persistent US Pull

On Thursday the US Bureau of Economic Analysis reported, “Personal income increased $233.7 billion (1.0 percent at a monthly rate) in January. Disposable personal income (DPI)—personal income less personal current taxes—increased $67.6 billion (0.3 percent). Personal outlays—the sum of personal consumption expenditures (PCE), personal interest payments, and personal current transfer payments—increased $54.3 billion (0.3 percent) and consumer spending increased $43.9 billion (0.2 percent). Personal saving was $779.3 billion and the personal saving rate—personal saving as a percentage of disposable personal income—was 3.8 percent in January.”

These are all nominal — current dollar — outputs. When reported in constant dollar terms (2017 chained value), the BEA finds, “The PCE price index increased 0.3 percent. Excluding food and energy, the PCE price index increased 0.4 percent… Real DPI decreased less than 0.1 percent in January and real PCE decreased 0.1 percent; goods decreased 1.1 percent and services increased 0.4 percent…”

The economic implications — especially inflation-related implications — were summarized in this Bloomberg report:

The so-called core personal consumption expenditures price index, which strips out the volatile food and energy components, increased 0.4% from December, data out Thursday showed. From a year ago, it advanced 2.8%. Economists consider this to be a better gauge of underlying inflation than the overall index. Inflation-adjusted consumer spending dropped for the first time in five months after a robust holiday shopping season, according to the report from the Bureau of Economic Analysis. Real disposable income, the main supporter of spending, was little changed.

From a supply chain — pull-push — perspective, I tend to give extra attention to housing, food, and fuel consumption. Supply chains are sensitive and can be stressed by significant and, especially, any rapid changes in pull (as seen below in pandemic behavior). These are three categories that provide a snap-shot of supply chain fitness for core human needs.

High volume, high velocity supply chains are better able to ensure demand-fulfilling flow when there is predictably stable or incremental increases in demand. Below are the inflation adjusted personal consumption expenditures for existing housing and utilities (top red line), Food-at-Home (middle blue line) and gasoline and other energy goods (bottom green line). After significant disruptions in the first half of 2020, big picture demand shifts and rate of change have been mostly benign to positive for balancing push and pull for existing housing, food, and fuel. (Not-so-much for new housing, some rents, and eating-out.)

The general strength of consumer demand in the United States is in marked contrast to behavior in China (here and here), much of the European Union (here and here), and Japan (here and here).

Note: Real PCE — inflation adjusted — outcomes for gasoline and housing are only generated on a quarterly basis, hence the unfinished lines above. But there is no reason to expect sudden arcs up or down since the end of the 2023 Fourth Quarter.

133 Days

In this February 16 report, NBC news provides a two-minute summary of causes and consequences of disrupted flows serving the people of Gaza. More detail is available here and here and here and here. Particular midstream logistical complications are outlined in this January 8 report by the World Food Program’s LogCluster.

According to the United Nations Office for the Coordination of Humanitarian Affairs (OCHA), below is inbound freight flow to Gaza since October 7.

The precise number of truckloads received differs by what is counted when and where. For example, below is an accounting of truckloads by Coordination of Government Activities in the Territories  (COGAT). In either case, flows are insufficient to fulfil fundamental human needs of 2.3 million people trapped in the crossfire.

February 22 Update: Yesterday National Public Radio reported on Gaza food flows with details very similar to what this blog has reported since early January. I appreciated the confirmation drawing on alternative sources.

February 24 Update: The Brookings Institution has produced a brief, helpful overview of challenges involved in providing humanitarian support to the people of Gaza. Kevin Huggard interviews Tania Hary, CEO of the Israel-based NGO Gisha – Legal Center for Freedom of Movement. Ms. Hary’s observations are consistent with what has been reported here since December. I agree with her summaries related to context, causes, and effects. Ms. Hary also offers, “Only a cease-fire will allow humanitarian actors to even begin to address people’s needs in the strip.” A sustained ceasefire would clearly support much more effective flows of humanitarian resources . And… in catastrophic contexts — tsunamis, earthquakes, plague, war, and more — there is a need to conceive and commit to doing what can be done here and now to serve survivors. As the inbound flows reported below indicate, there is a desperate and urgent need for much more. But we begin each day with as much as creativity and courage as we can find — many in Gaza and nearby have now been doing this for over 140 days.

Personal Note: Given other commitments, this is likely to be my last post until March 2 or so.

February supply chain fitness update

Reality is superabundant. Where are we looking? Over what time period? To what do we give priority? Lots of different angles to consider. Each month I try to evaluate the current condition of big flows. Here is where I landed in mid-January. Below are three gross indicators. Farther below are are few links to a bit more detail.

One indicator of Upstream Capacity is Gross Domestic Product. According to IMF estimates and projections, global GDP per capita is continuing to gain. The chart below is rendered per current US dollars. The growth trend is even stronger and more evenly distributed on the basis of purchasing power parity. The rate of growth has, however, recently been very uneven and in many places (e.g., EU and China) much slower than pre-pandemic. (More and more.)

Mid-stream Capacity is clearly sub-optimal. Two major global trade channels are currently seriously constrained, even evolving toward chokepoints. According to the Financial Times, “in the week to February 5, arrivals by container ships in the Gulf of Aden [transiting Red Sea] were 92 per cent down on the average for the first half of December.” Throughput for the Panama Canal is roughly one-quarter below historic averages due to low water. Add-in various trade sanctions, simmering trade conflicts, and the occasional large scale labor action and export flows are clearly choppy. There is plenty of potential for improvement (and the opposite). (More and more.) Still… aggregated flows are currently huge and well-above pre-pandemic trends (see IMF chart through, October 2023, immediately below), even with the softer growth rate noted above (more).

Downstream Capacity: While the population growth rate is slowing, everyday there are still more people on the planet. Given economic growth (see above), these people have an increasing ability to purchase more thereby pulling and motivating more upstream capacity. As regular readers know, I consider pull capacity to be the key to healthy high volume, high velocity supply chains. The strength of US personal consumption expenditures has continued to surprise many — and support significant domestic and global flows. This morning’s release of the January Consumer Price Index suggests this support is unlikely to dissipate soon since the gap between pull and push (once again) exceeded expectations (more). The pull capacity — demand activity (expressed potential?) — of China‘s, Europe‘s, and Japan‘s consumers has disappointed many. But from a Supply Chain Resilience perspective, I mostly perceive sustained abundance of both demand and supply. For example, according to China’s National Bureau of Statistics, “In 2023, the nationwide per capita consumption expenditure was 26,796 yuan, a nominal increase of 9.2 percent over the previous year, and the real increase of 9.0 percent after deducting price factor.” 2022 was not a banner year of China and NBS is not always a reliable source, but here’s a positive — if not stellar — growth rate (more). Just in this century the percentage of people living in extreme poverty has fallen from 3-in-10 to a bit less than 1-in-10 (more and more and more). Projections for the future are shown below. Despite — of perhaps, because of — persistent increases in demand, supply has — usually, in most places, for most products — been able to keep up. For example, even with all the midstream constraints noted above, the January FAO Food Price Index fell once again.

Complementing — and mostly reinforcing — these mega-macro indicators, the US Department of Agriculture continues to forecast strong 2024 harvests, especially for global wheat and rice crops. Despite geo-political turmoil and very material flow complications (see above), natural gas and most fossil-fuels continue to be well-supplied at affordable prices. Freight prices are higher, but this has preserved (even reclaimed) freight capacity needed to fulfill the sort of robust demand described above. Where food, fuel, and freight can flow, much more is possible too.

This is not an MRI, but these fitness indicators seem surprisingly good to me. Given very real perils all around, we ought not underestimate systemic risks. But neither should we discount the strength and agility outlined above.

A no-win supply chain scenario?

Please consider this scenario: One-hundred twenty days ago a Magnitude 7-plus earthquake hit a dense urban area. More than 2.3 million people are crowded into a roughly 25 mile by 6 mile matrix between a treacherously rocky littoral and high mountains. Almost everyday since there have been multiple after-shocks, many between M6 and M7. At least 28,000 have been killed, more than 67,000 have been injured. Three-quarters of the population is displaced into tents and other temporary shelters. At least sixty percent of residential housing is now uninhabitable.

The grid is gone. Solar and fossil-fuel emergency generators continue to deliver sparse flows of electricity. The water network has been decimated. Telecommunications is unreliable and from time to time has been mute for several consecutive days. Every hospital has been seriously damaged. Four of five leading grocery distribution centers have been destroyed. Fifteen commercial-scale bakeries have survived or been reopened, but output is sporadic.

Freight routes through the surrounding — still seismically active — approaches are narrow and susceptible to unpredictable landslides. Maritime infrastructure has been destroyed, previous navigational channels are unusable. For four months now inbound flows of water, food, fuel, pharmaceuticals, medical goods, and other essential freight have been about two-thirds below ordinary pre-event volumes. Redistribution of this seriously reduced flow is slowed — often stopped — by recurring aftershocks, disrupted transportation networks, poor communications, lack of local trucking, and other usual suspects.

Significant supplies are now staged outside the impact zone, some as close as thirty miles away. But — so far — there has been no way to sustainably increase inbound capacity. The best available estimates indicate that at least 900,000 residents are “facing extreme food shortages, acute malnutrition and disease levels are excessively high.” Another 400,000 are on the edge of imminent starvation.

This is a dense urban area in an isolated geography that has been — is being — seriously disrupted by seismic activity. Mass evacuation is essentially impossible given currently available transportation/shelter capacity constraints and seismic-related impediments.

Many geologists perceive the seismic activity will continue. There is credible concern regarding the prospect of even more destructive seismic events. Your current strategic context is treacherous. Your strategic options are austere. The context could soon become even worse and your options could be further constrained.

Given this scenario: What is your Supply Chain Resilience strategy? How can you practically engage this intractable problem with creativity and commitment? What is the best you can do? Where and how do you focus? What are your triage principles? To reasonably advance your strategy, what are your minimum operational requirements? Given this scenario’s lack of detail, it is probably premature to outline your tactical priorities and sequence, but please flesh out your minimum operational requirements with concrete examples.

Of course, this scenario — except for cause and topography — mirrors what is happening in Gaza now (more and more and more and more and more and more). Does that change your strategy? Your operational requirements? If so, why? If so, how? Given your “why” answer, what should you — and I — do next?

+++

February 13 Update: Flows go from bad to worse. Below is the OCHA update on truckloads. This contrasts with the COGAT update reporting 174 truckloads for February 12. This data discrepancy is sometimes resolved over a few days (but not always). This data gap is also wider than any I have seen previously. (More and more and more.)

February 14 Update: Today’s Financial Times gives considerable prominence to a so-called “explainer” headlined: Why Desperately Needed Aid is Failing to Reach the People of Gaza. If you have been reading this blog (here and here and here) nothing will be new to you, but it is a concise summary from a credible source. (More and more and more and more.)

February 15 Update: I have received several inquiries related to UNRWA activities in Gaza (and the West Bank and Jordan). Here is some recent background from the Washington Post. I previously addressed this issue in a January 31 Update. But my admittedly technocratic “response” is probably best articulated in the following statement of a core Supply Chain Resilience principle included in a December 9 post (well before the most serious critiques of UNRWA emerged).

Supply Chain Resilience acknowledges that contemporary high volume, high velocity flows of essential human resources serving large populations cannot be replaced, even by the most robust and best-organized relief operations. The only effective and timely way to serve large numbers of survivors is rapid restoration and adaptation of preexisting flows. The current situation in Gaza may be the exception that proves the rule. For sixteen years a huge, dense population has depended on robust, well-organized “relief” operations. Sixteen years of relief operations should have signaled an unsustainable situation requiring fundamental reform. But in the very present crisis, this humanitarian supply chain is the only “preexisting capacity” that has the irreplaceable ability to serve survivors.

For many years UNRWA has been the key source of last mile capacity for a significant proportion of the Gaza population. The middle of a flooding stream is not a propitious moment for changing horses, no matter how troublesome the current mount.

February 17 Update: Is available here.

Noto: Lessons still to be learned

On New Year’s Day the Noto Peninsula on the west coast of Japan experienced a significant earthquake. The US Geological Survey reported a Magnitude 7.5 quake. The main quake has been followed by more than 1500 aftershocks including one M6.4 and more than a dozen between M5 and M6. Today, February 6, for the first time since, all schools in the quake zone have resumed operation.

According to Ishikawa Prefecture, the quake resulted in 240 deaths, more than 1200 injuries, and at least 28,756 residential structures are now uninhabitable. One month after the earthquake more than 14,000 persons remain in 551 evacuation centers. Before the earthquake the population of the Noto Peninsula was estimated at roughly 350,000. (More and more.)

As the current map below indicates, the transportation network — especially on the north end of the peninsula nearest the epicenter — was (and continues to be) seriously disrupted in many places (here and here). Upstream supply chain capacity was not seriously impacted in nearby urban Kanazawa (465,000 persons) or Toyama (418,000 persons). Only about 150 miles away, seismic activity had no impact on the capacity organized around 2.3 million in metro Nagoya. Preexisting south-north flows using the Tōkai-Hokuriku Expressway were increased.

But this robust upstream capacity was detached from downstream demand by midstream transportation constraints. On January 5, I responded to some diagnostic questions with the following:

There are nodes of urgent need and nodes of available supply with very disrupted, diminished links in-between. The situation is mostly explained by damage/destruction of the road network in closest proximity to seismic epicenter(s). Given the innate limitations of the Noto peninsula and its landslide propensity, multiple chokepoints will not be quickly reopened, despite Japan’s well-practiced expertise in post-seismic road repair (here and here). The Asahi Shimbun reports (my rough translation): “Since large trucks cannot enter the Oku-Noto area due to damaged roads, light trucks are using a relay system to transport relief supplies such as water and food. With roads cut off by landslides , marine transportation has begun, but in the case of Suzu, the weather is bad and the water along the coast is shallow, making it difficult for Japan Maritime Self-Defense Force ships to dock.”  Yesterday the military used amphibious landing craft to deploy heavy equipment and some shelf-stable meals into hard-hit Wajima City.  But neither volumes nor velocity are sufficient to fulfill increasingly urgent human needs.  It is very tough to reestablish sufficient flows without the recovery of preexisting flow capacity — which in this case consists of a channel involving surface roads, trucks, and truckers.

While this may sound/seem obvious, there is a persistent tendency to discount how much an effective emergency response depends on commercial flows (almost always involving many trucks) — especially with a six figure population of survivors and even more when dealing with potentially catastrophic impacts. Japan has more experience with this reality than most and there is still a stubborn focus on volume and velocity of relief supplies in place of commercial flows. It is not a competition. Both will always be needed.

Response to the Noto Peninsula earthquake did demonstrate lessons-learned from the 2011 Triple Disaster. Then commercial flows were actively suppressed for at least ten days. Last month commercial trucks — and even mobile retail services — were deployed quickly. Within 72 hours most convenience stores were open and supplies were being surged into the impact area. This included some so-called “Push Mode Support” procured by the national government being delivered by major manufacturers, distributors, and retailers using their own transportation assets (here and here).

Several hot washes on Noto have already been undertaken (here and here). Serious after-actions will eventually be done. One of the most important strategic issues is to consider what our experience in this less populated, rather peripheral place tells us about what will be necessary when a similar force envelops ten-times the population and the high capacity supply chains embedded in and near the very hard-hit place? I expect that what we will see is profound and urgent downstream demand, deeply diminished midstream flow capacity, and upstream push capacity flat on its back — unless we take appropriate action today, tomorrow, and everyday between now and then.

Persistent PCE Pull

Supply chains perceive demand. Supply chains are pulled by demand. Contemporary supply chains organize, size, and time push toward demand. One way to estimate pull in US supply chains is real (inflation-adjusted) Personal Consumption Expenditures (here and here). The chart below provides an overview of pull patterns since 2007 (figured with constant 2017 dollars).

The dramatic variations in pull tracked from March 2020 until, let’s say, May 2022 help explain why push did not always fulfill demand back then. The boring consistency of expenditure on goods (real, physical stuff) since March 2021 suggests when (and why) the US supply chain “crisis” ended. That trembly but nearly straight red line also suggests why so many freight carriers are feeling trapped in a snowy, cold, redux of Groundhog Day (here and here) — without the laughs or romantic fizz of Bill Murray and Andie MacDowell. (But some see early signs of spring.) The second chart below reflects one important component of non-durable goods. In my judgment the slow but steady increase in demand for Food-At-Home is a healthy signal for Supply Chain equilibrium and potential resilience.

With average US wages increasing (here and here) and US consumption expenditures increasing even more (here and here and here) the current rough equilibrium between pull and push is likely to persist. As one freight market researcher recently commented, “Truckload spot rates are 12% above the seasonal pattern in January following the cold snap. While weather effects should revert in the coming months, freight is an outdoor sport, so the cycle will likely find a higher trajectory as the reversion happens amid tightening capacity and recovering demand.” [Or as Bill Murray said, Winter slumbering in the open air, wears on his smiling face a dream of Spring (and here)!]

Deadly Network Friction

According to an update from COGAT, the Israel Defense Forces unit coordinating access to Gaza, 227 humanitarian aid trucks were inspected and transferred to the Gaza Strip on January 15. “This is the highest number of aid trucks being transferred to Gaza in one day since the start of the war. 111 trucks were inspected at Nitzan crossing and transferred to the Gaza strip via the Rafah crossing. 116 trucks were inspected and transferred via Kerem Shalom.” According to the the UN Office for the Coordination of Humanitarian Affairs (OCHA), “On 18 and 19 January, 288 truckloads with food, medicine and other supplies entered the Gaza Strip through Rafah and Kerem Shalom crossings.”

Last week there was more volume discharged into Gaza than most weeks since November’s temporary cease-fire (here). This is, however, less than half the freight volume that Gazans consumed prior to October 7. Below is a chart by a United Nations agency that reports a similar pattern but with different — reduced — numbers. The number of truckloads discharged into Gaza is often inconsistent between reporting agencies and even by the same reporting agency. What is counted, how it is counted, and when it is counted is not well-calibrated. After 100-days plus of war, private stocks and commercial flows are now much reduced. How much is impossible to carefully measure. Eighty percent or more is a reasonable guess.

Early Sunday morning, January 21, the Financial Times reports: “Gaza’s population has become almost completely reliant on external aid brought in via the only two entry points — Rafah on the border with Egypt and Kerem Shalom on the Israeli border. The enclave’s commercial farms have been damaged in the war and are largely out of commission. The aid, which includes flour, oil, rice, legumes and canned foods, is mainly delivered to UN warehouses for distribution to shelters and elsewhere, and people have to queue, sometimes for hours, to get food.” (More and more and more.) Here’s my from-a-distance angle on food-related supply chain implications:

Upstream Capacity of Food Flows (Gaza inbound potential): There is significant preexisting capacity from Port Said (Egypt), about 107 miles west of Rafah (more and more and more). Recently as many as 500 aid trucks were waiting at Port Said. Another 3000 have been reported at al-Arish, less than thirty miles west of Rafah. The trucks at al-Arish have mostly arrived from Port Said or farther west. (According to LogCluster al-Arish currently has ship off-loading capacity for only 25 to 30 truckloads per day.) Efforts are underway to open a “Jordanian Corridor” for trucks from Amman (less than 100 miles to Gaza) or Aqaba (about 130 miles to Gaza). Pilot deliveries have taken place. Scaling up has been delayed for reasons not clear to me. Despite recent transportation improvements in the Taba-Arish corridor (160 miles one way), I have not been able to find any effort to surge maritime-to-rail intermodal flows (and such surge may not be needed given current flow congestion closer to Gaza). Egyptian regulatory and related impediments are non-trivial, but workable. There is the prospect of an additional crossing into Gaza being opened near Ashdod, Israel (more) to facilitate the resupply of flour through Ashdod’s seaport (about 30 miles north of Gaza). In any case, there is already plenty of food ready to be delivered into Gaza. Upstream capacity is not a serious constraint to feeding Gazans.

Midstream Capacity of Food Flows (Rafah and Kerem Shalom crossings): Daily food for more than 2.2 million people currently moves through two “gateways” at Kerem Shalom and Nitzan, where goods carried on 100 to 200-plus trucks per day are inspected before being discharged into Gaza through Rafah. The inspection protocols are rigorous and time-consuming. Here is a summary per LogCluster for truckloads arriving at Kerem Shalom: “Goods arrive from Egypt on Egyptian trucks at the Kerem Shalom checkpoint. These trucks then enter into large walled compounds/rooms where they are offloaded. Once the goods have been offloaded, they are scanned by COGAT using different means. At this point, the goods are inside Israel. Egyptian trucks then return to Egypt. After scanning is complete, the goods are moved from the scanning rooms in Israel into Palestine using sterilized trucks. Once the goods cross to the yards on the Palestine side, they are offloaded again, and the sterilized trucks go back to the scanning rooms to pick up more cargo. Goods from the yards (which are about 2.2 km from the Rafah Transshipment Point) are then brought to the Rafah Transshipment Point using another set of trucks. The goods are offloaded at the Rafah Transshipment Point then loaded onto trucks that will move cargo to various destinations in the Gaza Strip.” Just to restate — with emphasis — while there are two gateways, there is only one truck entrance into Gaza at the Rafah Transshipment Point. Expanded cross-docking facilities at Kerem Shalom are being developed. Additional warehouse space at both Rafah and Kerem Shalom are needed. The current number of cargo “touches” will never facilitate major improvement in velocity, much less result in continuous flow. There have even been situations where Gaza-side recipients request the cessation of inbound freight, mostly at Kerem Shalom, because of the need to decongest received goods at the warehouses. Midstream capacity is seriously rate-limiting for volume and, especially, velocity.

Downstream Capacity of Food Flows (“last mile” inside Gaza): A constantly displaced population and ongoing, intense military operations seriously disrupt, delay, and complicate both pull and push inside Gaza (here and here and here). The government of Israel has asserted that sufficient food is entering Gaza, but not being effectively distributed. Six hour “operational pauses” to allow for transport of food, medical goods, and other aid into specific neighborhoods are announced by the Israel Defense Forces. But deliveries to roughly 300,000 Gazans who still reside in the middle and northern Gaza Strip often fail (many because the IDF disapproves movement requests due to safety concerns). The situation for nearly 2 million in Southern Gaza is not much better. In most neighborhoods designated for an operational pause both delivery routes and receiving facilities are anemic or absent . Since January 12 telecommunications blackouts have seriously complicated tactical coordination. Since October 7 more than 150 United Nations staff involved in relief operations have been killed by military operations in Gaza. There is reluctance to deploy into danger when left logistically deaf and blind. Staged delivery vehicles have been intercepted and emptied by the hungry people in the staging area. There is profound need, but almost no meaningful way of sending pull signals, except by showing up where food might be available. Nothing like a contemporary demand and supply network has survived. Where downstream capacity to deliver relief has survived, it is fragile, fractured, and entirely insufficient.

According to a 2022 United Nations report, roughly 80 percent of Gaza residents depended on humanitarian food assistance before the last three months of hostilities. Despite extensive international relief operations, over sixty percent of Gaza residents were already food insecure before the blockade was further tightened and bombing began. Given these conditions, supply chains serving Gaza have long been much more push-oriented than pull-oriented. The World Food Program estimates that only about one-third of food sector capacity was market-oriented before October 7.

Losing almost all of that preexisting one-third volume has been very difficult. Losing market-oriented velocity and adaptability has been even worse.

On January 18, UNICEF Deputy Executive Director Ted Chaiban said: “Once aid enters the Gaza Strip, our ability to distribute it becomes a matter of life and death. It is essential to lift access restrictions, ensure reliable ground communications, and facilitate the movement of humanitarian supplies to ensure that those who have been without assistance for several days receive much-needed assistance. We have to get commercial traffic flowing in Gaza, so that markets can reopen, and families are less dependent on relief.”

Large-scale, long-term relief operations, such as those operating in Gaza since 2007, tend to be organized around static places and rather stable population requirements. Gaza and Gazans now exemplify the opposite of static or stable. Given current — and anticipated — volume and volatility of demand there is the need for much more systemic flexibility, experimentation, and widely distributed voluntary risk-taking such as more market-oriented behaviors can contribute.

+++

January 28 Update: The recent running average of truckloads received into Gaza is about 168 per day. Once these truckloads enter, they are usually warehoused before being redistributed. According to January 22 meeting minutes, , “The Logistics Cluster conducted a transport assessment in January 2024. Results show that 230 trucks are currently operational in the Gaza Strip. 43 trucks belong to the major transport companies, while others are owned by small companies or individuals. Access to fuel was not reported as an issue currently, as all are able to access it through UNRWA or commercially.” The so-called “Jordanian Corridor” for deliveries into Gaza is getting closer to operational. Two routes have been piloted and are currently anticipated to soon begin recurring operations: 1) Amman – Aqaba – Nuweibaa – Arish – Rafah or Kerem Shalom. WFP and the Logistics Cluster support the coordination, however, partners must provide their own trucks and must be registered in Egypt, following the standard procedures that are used to bring cargos from Arish to Gaza. 2) King Hussein Bridge/Allenby – Nitzana – Kerem Shalom. Organised by WFP and the Logistics Cluster, two convoys are scheduled per week, consisting of 24 trucks each. The Logistics Cluster is advocating to increase the frequency and number of trucks per convoy. WFP has published some detail on its operations in al-Arish to Rafah (more and more and more and more). Minutes of January 25 LogCluster meeting provides more detail on the Jordanian Corridor. A detailed summary of Standard Operating Procedures provides further insight on how potential flow is fractured and slowed.

January 31 Update: The United Nations Relief and Works Agency for Palestinian Refugees (UNRWA) is the principal source of last-mile food deliveries in Gaza. UNRWA personnel and operations in Gaza constitute the principal “preexisting capacity” to feed Gazans before and since October 7. Twelve UNRWA personnel have been credibly accused of participating in the October 7 attack on Israel (here and here and here). According to this morning’s Financial Times, “So far, 15 countries, led by the US, have pulled funding, leaving a $444mn hole in UNRWA’s finances, out of an approximately $1.2bn budget.” (More and more.) Over the last week these issues have added considerable friction to an already wrecked network and threaten an imminent collapse of remaining downstream capacity. Early today the Times of Israel quoted a “senior Israeli official” as saying, “If UNRWA ceases operating on the ground, this could cause a humanitarian catastrophe that would force Israel to halt its fighting against Hamas… This would not be in Israel’s interest and it would not be in the interest of Israel’s allies either.” (More and more and more.) The LogCluster overview for January is available here.

February 5 Update: According to COGAT: “271 trucks carrying humanitarian aid were inspected and transferred to the Gaza Strip yesterday (Feb.4). This marks the highest number of humanitarian aid trucks inspected and transferred in one day since the start of the war. 112 humanitarian aid trucks were inspected at the Nitzana crossing and transferred to the Gaza Strip via the Rafah crossing, and 159 humanitarian aid trucks were inspected and transferred via Kerem Shalom. 180 trucks carried food.”

February 10 Update: Kerem Shalom and Nitzana crossings are closed on Saturdays. On February 9, NBC news reported on the situation in Rafah, “Any attempt to evacuate from the overcrowded city would be neither feasible nor safe, said Andrea De Domenico, who heads the U.N. humanitarian agency responsible for the Palestinian territories. “People are everywhere. This congestion not only makes it difficult for people to move but also hampers any potential evacuation efforts, and humanitarian operations,” she said in a statement from Gaza. Satellite imagery shows the sprawling growth of makeshift shelters and tents that have transformed the enclave’s southernmost city over the past two months.” (More and more and more and more.)

OCHA

The map below reflects conditions prior to October 7. The Gaza Strip is about 25 miles in SW to NE length and roughly 3.5 to 7.5 miles wide.

Big system, big flows, big picture just now

So far, retrospective data and current observations suggest that US demand and supply networks are well-balanced. The Global Supply Chain Pressure Index ended December hovering around its long-term average. The Cass Freight Index is similarly well-behaved if compared to several pre-pandemic year-ends (more and more). The Logistics Managers Index, “moved back into expansion territory in December. This movement back to growth was led by increased activity among the three warehousing metrics. Warehousing Capacity is tighter (-5.5) while Utilization (+7.4) and Prices (+1.2) are both expanding at increasing rates. Inventory Levels continued to decline at a steady pace (although they were breaking even Downstream – likely indicative of JIT practices products selling briskly).” There are credible indicators that strong US consumer demand continues at a less erratic, supply-chain-friendly pace than in recent memory. The December US Personal Consumption Expenditure report is unlikely to dramatically diverge from recent patterns (see second chart below).

Given the global context — featuring economic constraints in China and Europe and expensive chokepoints related to the Suez and Panama canals — benign or better US conditions ought not be taken for granted. How bodes the future?

Last week’s USDA World Agricultural Supply and Demand Estimates projects, “global wheat outlook for 2023/24 is for larger supplies, consumption, trade, and ending stocks compared with last month. Global supplies are raised 3.6 million tons to 1,056.5 million on higher beginning stocks and production. The increase in global beginning stocks is primarily the result of revisions for Ukraine, where beginning stocks are raised 2.2 million tons to 3.5 million on downward revisions to feed and residual use estimates since 2021 /22… Global consumption is raised 1.8 million tons to 796.5 million, mainly on higher feed and residual use for India and the EU.” Corn and other course grains are also expected to be abundant, “Global coarse grain production for 2023/24 is forecast up 11.9 million tons to 1,513.9 million… Global corn stocks, at 325.2 million tons, are up 10.0 million.” Regarding rice: “Supplies are lowered 3.5 million tons to 689.4 million with most of the reduction the result of a lower China production estimate reported by the National Bureau of Statistics. World 2023/24 consumption is lowered 2.9 million tons to 522.1 million, mainly on a reduction for China.” Soybean production is expected to be similar to last year. While production looks good, transportation can be complicated on the Mississippi, in the Black Sea, or through the Panama Canal or Red Sea to Suez. The long-range weather forecast suggests that the Southern Hemisphere’s 2024 harvest season and the Northern Hemisphere’s growing season will unfold into weakening  El Niño affects, with a possible La Niña pattern emerging in September/October/November (more).

US and global petroleum production is strong. Prices have not soared, despite several serious geopolitical challenges. US production is only slightly off record-setting heights (more). Refinery output is robust and consistent with market demand (here and here and here and here). S&P Global reports, “Growing pressure on shipowners to avoid the Red Sea took a toll on European refined product imports in the first half of January… Arrivals from Saudi Arabia, India and Kuwait have already tumbled respectively by 15%, 31% and 43% over Jan. 1-17 from December levels. For Europe, falling import volumes put diesel supplies most at risk. The continent sources about one-third of its diesel supply from the Middle East, and with Insights Global data showing stock levels 257,000 below the five-year average Jan.11, upside risk is significant. Higher imports from the US have provided some buffer. To date 237,000 b/d of diesel/gasoil supply has arrived in Europe from the US in January, down from 246,000 b/d in December but up significantly from an average of 155,000 b/d in 2023…” In a separate report S&P Global explains, “Chinese shipping and trade sources said oil flows into China have not been impacted much by the Red Sea turbulence, as few cargoes were heading to China on that route… On the export front, China’s refined oil primarily heads to the Asia-Pacific region, which implies that Red Sea tensions are having limited impact.”

LNG flows have also been disrupted and delayed by the Houthi’s Red Sea chokepoint. But Reuters reports, “U.S. LNG exports hit a record high of 8.56 million tons in December, according to Kpler, with Europe receiving 5.87 million and Asia 2.2 million, and small volumes heading to the Americas. The United States has the ability to boost shipments to Europe if required, and it may also suit to send less to Asia given the current delays affecting shipping through the Panama Canal, caused by a lack of rain leading to draught restrictions and lower shipping movements. The current situation in the Red Sea has the potential to escalate, but for the moment it’s more of a concern than a factor driving prices.” Indeed, after a brief reaction to the risks of wider war in the Middle East, the European benchmark price for natural gas (now much more dependent on LNG) has continued to fall (see first chart below). On January 8, Javier Blas commented, “Mild weather [in Europe] has induced a massive decrease in gas consumption for heating. That’s on top of greater demand reduction due to energy-intensive companies curbing production. In Germany, for example, output from energy intensive companies, such as chemical plants and metal smelters, is down 20% from before Putin’s invasion of Ukraine. As a result, stockpiles remain well above normal for this time of the winter. Granted, they started the season almost full, compared to the typical 90%. Since then, with consumption lower than normal, they have dropped to about 85%, compared to a 10-year average for early January of about 75%. Under current trends, Europe would reach the spring with more than half its underground gas storage full, versus a 10-year average of just 35%.” Natural Gas takes longer to reach EU pipelines from a different direction, but both supply and price are currently able to support sustained flows.

Where food and fuel can flow, so can much more. Freight carriers are experiencing increased demand for longer sailings, air cargo, and rail delivery (more). Continued friction at Suez and Panama cause increased time-on-task, delayed discharge, and higher costs overall. These factors allow carriers to claim higher rates. So far, higher rates have not substantially reduced demand. UBS Chief Economist Paul Donovan comments, “The additional nine days it takes to ship cargo around the Cape of Good Hope is unlikely to result in shortages, and shipping costs are a tiny part of the price consumers pay for goods.” (More)

But whenever this kind of congestion and rewiring emerges in demand and supply networks, vigilance is valuable (here). Early interventions are helpful to reopen chokepoints, decongest and smooth existing bottlenecks, facilitate alternate routing (important example here), and avoid painful bullwhips prompted by nervous — sometimes insidious — consumers and suppliers. At the start of 2024, I perceive a robust and adaptive global network contending with an amazing array of slings and arrows of outrageous fortune in a raging sea of troubles (look here).

Doubling-down on electric demand

This morning the FT is giving significant attention to the NERC Long-Term Reliability Assessment. The Financial Times summarizes, “Nerc forecasts peak winter electricity demand growth of 11.6 per cent in the decade between 2024 to 2033, compared with growth of 5.4 per cent between 2019 and 2028. Summer peaks over the same time periods are now forecast to rise by 9.2 per cent, compared with 5.2 per cent in the earlier forecast.” North American electric utilities will struggle to meet this demand. This is important news you might have missed during busy December days. So, just in case, I will point you to this blog’s December 19 post on the same issue depending on many of the same sources: Long-term grid reliability (and risk). The principal value-add in the FT coverage is to make explicit the demand implications of data-center requirements to support expanding cloud-based Artificial Intelligence applications.

+++

January 13 Update: There are near-term concerns as well. For today through Tuesday, Severe-Weather-eu forecasts, “an extensive reservoir of frigid cold air mass will begin its progress from Arctic Canada far south and spread into the United States. Temperatures will plunge into deep freeze, reaching more than 50 degrees F below average for the northern countries.” (See map below and more.) In anticipation, “NERC is monitoring the impending extreme cold weather events forecast across much of North America, starting this weekend and expected to continue through next Tuesday. This extreme weather pattern of arctic cold and heavy rain across most of the lower 48 states has the potential to create significant challenges, especially in major metropolitan areas… The MISO grid can be monitored here. The ERCOT grid can be monitored here. The Southwest Power Pool grid can be monitored here and through related links.

arctic-blast-winter-storm-gerri-snow-blizzard-forecast-polar-vortex-united-states-canada

January 18 Update: According to the New York Times, “During the past few days, renewable energy was a small but meaningful part of the energy mix that delivered electricity to Texans. But starting on Sunday, as wind chills dipped below 0 degrees Fahrenheit in some Texas cities and demand surged, especially in morning hours when residents awakened, the grid leaned heavily on gas, according to data from the Electric Reliability Council of Texas, the grid operator… In areas of Texas where temperatures dipped the lowest, it has been frigid but sunny. Solar power performed well and, overall, provided a small share of total electricity generated. In Texas, winds die down in winter and aren’t expected to contribute as much to the energy mix as in the summer, energy experts say. On Monday, for instance, wind at its highest-performing level of the day was about 28 percent of the energy mix, compared with gas at about 48 percent. In the early morning hours, however, wind was barely more than 7 percent.” KVUE explained, “The Electric Reliability Council of Texas (ERCOT) has not issued an energy emergency alert (EEA) this week as freezing weather blankets the state and the demand for power is driving higher than any other winter on record. “You had low thermal power plant outages. You had decent to very good wind depending on the time of the event. You’re looking at solar and storage. So this is where, you know, it’s a system – it’s all kind of working together,” said Doug Lewin, founder of Stoic Energy Consulting.”

Paying to eat

A few factors worth considering: During December the planet’s largest national economy was experiencing a strong labor market with higher wages during an extended holiday season featuring gift-giving, family reunions, and general partying. Weather was certainly variable, but nothing that would seriously constrain overall demand pulling supply (or push toward demand). Without knowing much more, I might guess that demand for food — especially eating-out — would be comparatively higher than just before or after.

Today’s Consumer Price Index for food-at-home and food-away-from home does not directly measure demand or supply. But the CPI does presume to demonstrate — or at least provide a credible indicator of — comparative price behavior. (See chart below.) The Bureau of Labor Statistics finds that during December the price of eating-out increased 0.3 percent from November and over the last twelve months has increased 5.2 percent. I am guessing, not claiming, that service sector wages could be implicated.

Meanwhile at the grocery store (and similar) the MOM change was 0.1 percent and 1.3 percent over the last twelve months. The supply of high volume, high velocity finished foods is, this seems to suggest, pretty much consistent with demand. The supply of more customized, thereby lower volume, lower velocity food ready-to-eat — prepared and served by others rather than self-prepared — is less well-matched with December demand and, probably, charging more to cover the wages needed to close the supply gap with demand.

People worried about inflation are less happy with these outcomes than those who want healthy supply chains for all sorts of foods and eating experiences. Especially in the food-at-home network these are great results compared with the imbalance between demand and supply — and therefore the food inflation rate — during the second half of 2021 and all of 2022.