Author: Philip J Palin

Paying to eat

A few factors worth considering: During December the planet’s largest national economy was experiencing a strong labor market with higher wages during an extended holiday season featuring gift-giving, family reunions, and general partying. Weather was certainly variable, but nothing that would seriously constrain overall demand pulling supply (or push toward demand). Without knowing much more, I might guess that demand for food — especially eating-out — would be comparatively higher than just before or after.

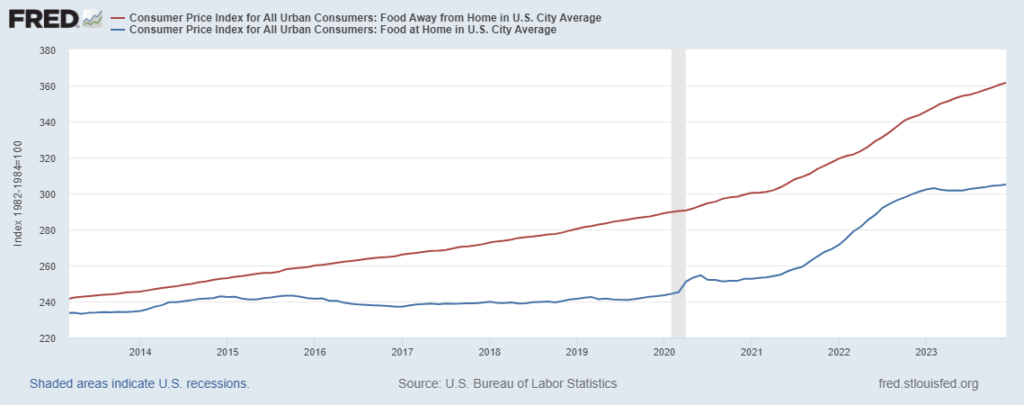
Today’s Consumer Price Index for food-at-home and food-away-from home does not directly measure demand or supply. But the CPI does presume to demonstrate — or at least provide a credible indicator of — comparative price behavior. (See chart below.) The Bureau of Labor Statistics finds that during December the price of eating-out increased 0.3 percent from November and over the last twelve months has increased 5.2 percent. I am guessing, not claiming, that service sector wages could be implicated.

Meanwhile at the grocery store (and similar) the MOM change was 0.1 percent and 1.3 percent over the last twelve months. The supply of high volume, high velocity finished foods is, this seems to suggest, pretty much consistent with demand. The supply of more customized, thereby lower volume, lower velocity food ready-to-eat — prepared and served by others rather than self-prepared — is less well-matched with December demand and, probably, charging more to cover the wages needed to close the supply gap with demand.

People worried about inflation are less happy with these outcomes than those who want healthy supply chains for all sorts of foods and eating experiences. Especially in the food-at-home network these are great results compared with the imbalance between demand and supply — and therefore the food inflation rate — during the second half of 2021 and all of 2022.
Avoiding risk generates friction

According to a January 10 CNN report:

The US Navy shot down 21 Houthi missiles and drones launched from Yemen, according to a statement from US Central Command, in one of the largest Houthi attacks to take place in the Red Sea in recent months. The military called it a “complex attack” carried out by the Iranian-backed militants. It comes amid increasing tensions around Israel’s war against Hamas in Gaza and fears it could spill over into a wider regional conflict. The barrage, launched at about 9:15 p.m. Tuesday in Yemen, included 18 one-way attack drones, two anti-ship cruise missiles and one anti-ship ballistic missile, Central Command said. The attack was launched toward international shipping lanes in the southern Red Sea where “dozens” of merchant vessels were traveling, according to the statement. Two defense officials had earlier told CNN that the barrage included a total of 24 drones and missiles. (More and more)

Even before yesterday’s audacious attacks, increased risk had resulted in significant risk avoidance. Last week the Kiel Institute reported that about 200,000 containers per day have recently been transported via the Red Sea down from some 500,000 per day in November (see chart and infographic below). Further as the Bab al-Mandab Strait is converted from a beneficial bottleneck into a painful chokepoint, Loadstar reports:

Crowd-sourced freight rates platform Xeneta said the Red Sea shipping crisis would get worse before it got better, and shippers needed to “get their act together quickly” to secure capacity in the run-up to Chinese New Year next month.  In its latest analysis, Sea-Intelligence also warned that shippers exporting from Asia would have limited access to capacity in the coming weeks. “On Asia-North Europe, due to a combination of some services being held back in departure from Asia awaiting re-routing, and some services clearly arriving late into Asia, there is a rapid shortfall in the middle weeks of January, with a steep capacity drop expected for the week of 22 January,” explained Alan Murphy, Sea-Intelligence CEO. (More and more.)

There has been excess capacity in ocean shipping. Longer-duration sailings between East Asia and Europe are already starting to claim this capacity. But even as ships continue to go there is concern about other sources of friction emerging as many of the benefits of Suez are lost. For example, S&P Global reports:

Despite the fluidity seen from carriers to amend services, equipment shortages in the form of empty containers are expected in Asia as vessels are scheduled for longer transits on their regular loops due to rerouting around the Cape of Good Hope. According to data from S&P Global Commodities at Sea, the alternative route has increased westbound transit times for Asia-North Europe shipments by 30% and for Asia-West Mediterranean by 60%. As a result of increased fuel consumption and higher bunkering overheads, carriers have been raising charges. “Some carriers are better at managing containers than others, the lead time in getting back to Asia will be an issue as will berthing congestion, the supply chain shortages will cause some pinching to shippers,” a forwarder said. Disruptions in supply chain logistics can therefore be expected and will cause shortages in origin that will impact services. (More and more.)

In high volume, high velocity networks, a sudden slowdown in any high proportion channel will quickly result in various forms of congestion, often emerging in surprising ways and places. It is almost impossible to avoid the congestion and can be very difficult to decongest once it happens… especially if the overall network slowdown persists.

January 12 Update: The US and UK have taken military action against Houthi assets in Yemen. Reuters reports, “The strikes were carried out by aircraft, ship and submarine. A different U.S. official said more than a dozen locations were targeted and the strikes were intended to weaken the Houthis’ military capabilities, as opposed to being just symbolic. “We were going after very specific capability in very specific locations with precision munitions,” a U.S. military official said.” (More and more and more.)

January 16 Update: S&P Global reports, “More commercial shipping avoided transiting the Red Sea Jan. 15 as a Houthi missile hit a US-owned dry bulk carrier in the Gulf of Aden in the first retaliation since US-led forces struck Houthi military sites in Yemen over the weekend. The Gibraltar Eagle was struck by a Houthi anti-ship ballistic missile from Yemen at around 1300 GMT, the US Central Command said in a statement, adding that the ship reported no significant damage or injuries and was continuing its journey.”

January 24 Update: Reuters reports that Hapag-Lloyd is opening a “land-bridge” to try and end-run on the Bab al-Mandab Strait. Bloomberg has published a “Big Read” on the Red Sea crisis. I don’t see anything new or different, but it is a helpful overview with some more recent measures of continuing (growing?) constraints.

Reuters Graphics Reuters Graphics

Bad start for new year

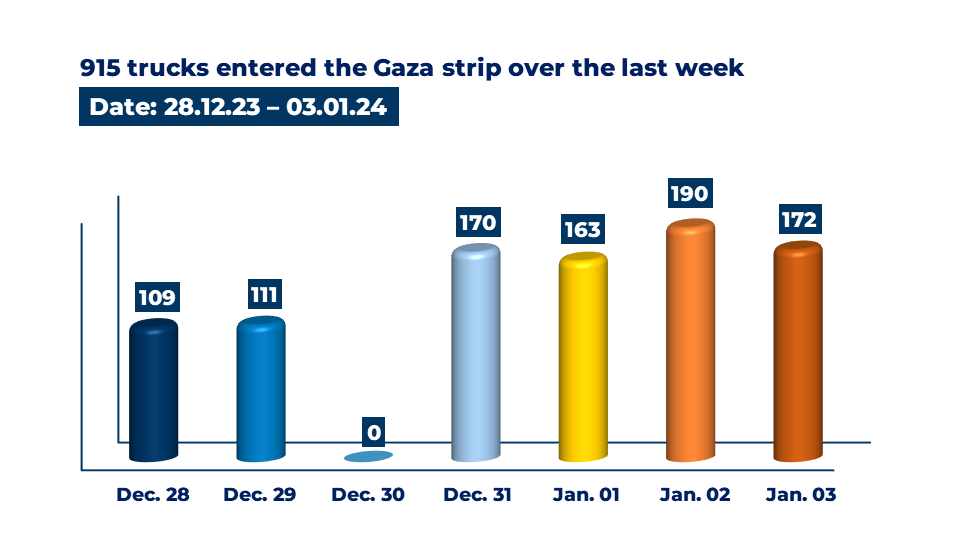
Supply chain outcomes for the residents of Gaza have continued to deteriorate. Volumes discharged into Gaza remain well below the minimum needed 200 truckloads per day. (See chart below).

The Kerem Shalom Crossing has resumed operations. According to COGAT, “A total of 163 trucks carrying humanitarian aid, including food, water, medical supplies, and shelter equipment were inspected and transferred to the Gaza Strip yesterday (Jan. 1). 87 trucks inspected at Nitzana crossing and transferred to the Gaza Strip via the Rafah Crossing, and 76 trucks inspected and transferred to Gaza via Kerem Shalom. “

Delivery velocity inside Gaza is next to nil. According to the most recent LogCluster consultation (December 28), “There is no last mile delivery or transportation to specific locations by the Logistics Cluster as every movement of transport requires deconfliction.” There have been other attempts to make deliveries, these have often failed due to military operations or civil unrest (more and more).

On December 30 CNN reported, “In recent days, crowds of civilians desperate for food have been seen surrounding aid trucks coming into Gaza. The United Nations has warned that the humanitarian situation in southern Gaza is deteriorating and warned that the volume of aid entering the enclave “remains woefully inadequate.”…An IPC report the same week found that approximately all of Gaza’s 2.2 million residents are now facing acute hunger and the entire population of the Gaza Strip is classified in a state of crisis – the highest share of people facing catastrophic levels of acute food insecurity that the IPC initiative has ever classified.” Famine conditions have been predicted by February at the latest.

As previously explained, prior to October 7 food stocks in Gaza were much more robust than is typical of more market-oriented dense urban areas. During the November 24-30 pause in hostilities food flows mostly met the 200 truckload per day minimum. Food stocks have since fallen precipitously and are not being replenished. The opening of the Karem Shalom Crossing on December 16-17 was promising. This was the principal freight entry facility before October 7. But this restored potential has prompted no discernable improvement in either inbound volume or outbound velocity.

Upstream supply is immediately available, according to LogCluster reports 3,000 aid trucks are currently near the Al Arish port (Egypt) waiting to enter Gaza. Another 500 trucks are said to be waiting farther west at Port Said.

In catastrophic contexts supply chains are almost always caught in a narrow place between what is prudent and what is imprudently possible (and failure may be probable). From this distance, I recognize the painful pinch. I am not ready to second-guess decisions made by those whose lives are wedged in this tightly constricted time and space. In any case, each day the deadly consequences sharpen and accumulate.

+++

January 4 Update: LogCluster has posted an overview of Gaza operations through December 18 -31. The New Yorker has interviewed the Chief Economist for the World Food Program (WFP). One summary quote, “Gaza needs more food coming in. On a good day, aid groups are bringing in maybe twenty-five to thirty per cent of what they need. So, obviously, a lot more food, fuel, medicine, water need to come in. But they need to be distributed as well. They need to go to where the people are. And I don’t know how you can do that without a humanitarian ceasefire.” COGAT reports that on January 3, “Flour, sugar, salt and fuel were distributed by WFP to bakeries in the Gaza Strip. As a result, 10 bakeries resumed operations last night. Equipment for 4 WFP warehouses have entered the Gaza Strip. These warehouses are expected to be set up in the coming days and will better the logistic capacity of the organizations receiving the humanitarian aid in the Gaza Strip.”

January 5 Update: 205 truckloads were delivered into Gaza on Thursday, January 4. (More)

January 6 Update: 151 truckloads were delivered into Gaza on Friday, January 5. (More and more and more and more)

January 8 Update: 198 truckloads were delivered into Gaza on Sunday, January 7. 113 of the trucks carried food, the rest carried water, medical supplies and shelter equipment. The Palestine Red Crescent Society provides an updated operational report through January 5. (More and more and more)

January 9 Update: I am receiving conflicting information on the number of truckloads that were delivered yesterday. This has happened once before and was resolved within about one week. LogCluster has provided details on the Kerem Shalom inspection and delivery process. Following is a summary from minutes of a January 4 meeting.

  1. Manifested trucks cross from Egypt to the scanning area at Kerem Shalom. The scanning capacity is still unclear.
  2. Once cargo is scanned, all cargo is offloaded in the designated area and trucks return to Egypt.
  3. A Palestinian private transportation company loads cargo from the offloading area of Kerem Shalom to a designated offloading area for UN and INGO cargo. There is a nearby offloading area for ERC/PRCS and NGO cargo arriving from Nitzana.
  4. When all cargo is offloaded, another truck loads the cargo and transports it to the Rafah transshipment point waiting area with a capacity of 50 trucks.
  5. The convoy of trucks at the Rafah transshipment point is dispatched to various locations (Rafah, Deir al Balah, Khan Yunis, etc.).

Cargo that arrives on one truck from Egypt may be divided into different trucks when transported from Kerem Shalom to the offloading area of UN and INGO cargo. The QR code placed on Egyptian trucks is not accessible once cargo has been offloaded at Kerem Shalom after scanning, as the trucks return to Egypt and cargo is loaded onto Palestinian trucks.

Several why questions are prompted. This process clearly has several internal friction points and tight constraints… even before dealing with the complications of a huge displaced population in a war zone.

January 10 Update: 182 trucks carrying humanitarian aid, including food, water, medical supplies, and shelter equipment were inspected and transferred to the Gaza Strip yesterday (Jan. 9). 80 trucks inspected at Nitzana crossing and transferred to the Gaza Strip via the Rafah Crossing, and 102 trucks inspected and transferred to Gaza via Kerem Shalom. 153 (84%) of the trucks carried food, the rest carried water, medical supplies and shelter equipment. (More)

January 11 Update: 208 trucks carrying humanitarian aid, including food, water, medical supplies, and shelter equipment were inspected and transferred to the Gaza Strip yesterday (Jan. 10). 89 trucks inspected at Nitzana crossing and transferred to the Gaza Strip via the Rafah Crossing, and 119 trucks inspected and transferred to Gaza via Kerem Shalom.144 (70%) of the trucks carried food, the rest carried water, medical supplies and shelter equipment. (More and more and more and more.)

January 12 Update: 201 trucks carrying humanitarian aid, including food, water, medical supplies, and shelter equipment were inspected and transferred to the Gaza Strip yesterday (Jan. 11). 84 trucks inspected at Nitzana crossing and transferred to the Gaza Strip via the Rafah Crossing, and 117 trucks inspected and transferred to Gaza via Kerem Shalom. (More and more and more.)

January 13 Update: According to OCHA: “On 12 January, 178 trucks with food, medicine and other supplies entered the Gaza Strip through the Rafah and Kerem Shalom crossings. Under-Secretary-General for Humanitarian Affairs and Emergency Relief Coordinator Griffith’s stated today that… “We cannot replace Gaza’s commercial sector. Commercial goods must be let in, at scale.” The minutes of the January 11 LogCluster meeting are now available. A few interesting excerpts: “Two additional Mobile Storage Units (MSUs) have been installed in Rafah to augment the storage capacity of the Palestine Red Crescent Society (PRCS). Two MSUs will also be installed in the coming days at Kerem Shalom to increase the offloading capacity. The Logistics Cluster plans to bring in more equipment to Gaza, including MSUs, prefabs, and generators, pending pre-approval from COGAT.” UNRWA is beta testing a new dashboard to track supply flows into Gaza:

Friction slows flows

Houthi forces have continued to attack ships passing through the Bab al-Mandab strait (more). A December 31 attack was repulsed by US Navy assets. A Maersk container ship was the intended Houthi target. In response Maersk has, again, suspended operations in the area (see map below). This will result in much longer sailings between East Asia and Northwest Europe (see second map below). Maersk explains: “Following an incident involving one of our vessels, the A.P. Moller – Maersk group (Maersk) has today decided to pause all transits through the Red Sea / Gulf of Aden until 2 January… Maersk Hangzhou was among the first vessels to go through the Red Sea again following confirmation that the multinational security initiatives, Operation Prosperity Guardia (OPG), had been deployed in the area. Maersk is currently working to ascertain the full details of the incident involving Maersk Hangzhou. We are in close dialogue with the OPG naval operation and authorities to assess the security level in the area and any potential impact to our voyage plans.” (More and more and more). Many ocean carriers have indicated they will take the longer route for the foreseeable future (more). January 2 Update: Some updates from S&P Global, especially related to raw petroleum flows.

+++

January 3 Update: Bloomberg has published an extensive Big Read on the Panama Canal’s long-term options. Now and in the near-term Bloomberg reports, “The constraints have since eased slightly due to a rainier-than-expected November, but at 24 ships a day, the maximum is still well below the pre-drought daily capacity of about 38. As the dry season takes hold, the bottleneck is poised to worsen again.”

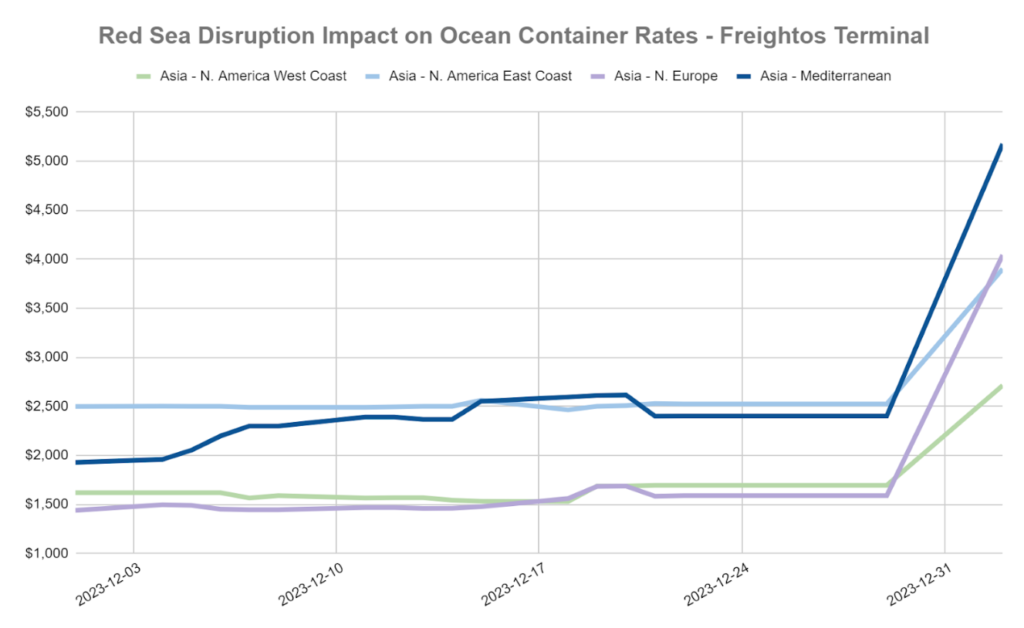
January 4 Update: Freightos is reporting surging spot rates for container shipping. See chart below.

Fundamentals of flow

At the end of November, according the the Global Supply Chain Pressure Index, pull and push were about as balanced as at any time this century. See chart below. Two US-focused measures — the Cass Freight Index and the Logistics Managers Index — can be read (without too much distortion) as coherent with the GSCPI signals.

This balance is never universal or problem-free. There is always friction. Small differences in friction can be decisive to flows. Acceleration or deacceleration and related reaction functions persist, especially at higher scales. Most readers live in places where these dynamics can quickly display dramatic changes — as seen between March 2020 and late 2022.

For the last two years this blog has supplemented GSCPI, LMI, and other more comprehensive measures with monthly snap-shots focused on demand velocity, food volumes, energy supplies, and transnational trade (for example, here and here). I have tried to cherry-pick some sector-specific data to confirm, clarify, or correct the big picture indices.

This monthly discipline has underlined the power of effectual demand. The reaction function related to EU natural gas demand and supply has been fascinating — and mostly very encouraging (see here and here). Similar behavior at somewhat slower speed has been observed in agricultural, other energy, and many other markets.

Despite wars, rumors of war, famines, earthquakes, cyclones, drought, floods, prospect of plague, and other troubles, flows ebb and rise in response to demand. There have been awful exceptions. But even these exceptions have seemed to prove the rule: pull attracts push. To be explicit: need alone does not pull. Push is attracted to credible promises of value greater than value delivered.

Downstream demand attracts upstream supply. Here is how this dynamic is described by the authors of the November LMI:

Downstream respondents… are still seeing some growth. Inventory is contracting slower Downstream (48.8 to 40.8). Downstream firms are seeing Warehousing Utilization growing at a significantly faster rate (59.8 to 48.4), Transportation Price is holding steady rather than contracting (50.0 to 41.5) and Transportation Utilization expanding rather than contracting (55.1 to 47.9). Taken altogether, this suggests that inventories were pushed towards consumers, and last-mile deliveries are ongoing, leading to the higher levels of Transportation Utilization Downstream (despite the higher Transportation Capacity expansion Downstream)… Interestingly, Upstream firms are predicting increases in Inventory Levels going forward, while Downstream is not. If those predictions hold, we may eventually see freight rates increasing Upstream as well as Downstream. 

As we move into 2024 I will adjust my monthly snapshot to focus on downstream demand for food, upstream supply of food (more and more), and channels for food delivery. Fuel and other energy costs are important components of food flows, so there will be continuing attention to these elements. I will give much more attention to freight markets (more and more).

This shift is partly motivated by worry. Global food production is enormous and widely distributed. This robust scale lends innate resilience… as does sustained pull. Food production is also seasonal and vulnerable to factors beyond human control. There is evidence of increasing vulnerability. Reuters recently reported,

The El Nino weather phenomenon, which brought dryness to large parts of Asia this year, is forecast to continue in the first half of 2024, putting at risk supplies of rice, wheat, palm oil and other farm products in some of the world’s top agricultural exporters and importers. Traders and officials expect Asian rice production in the first half of 2024 to drop as dry planting conditions and shrinking reservoirs are likely to cut yields… India’s next wheat crop is also being threatened by lack of moisture, which could force the world’s second-largest wheat consumer to seek imports for the first time in six years as domestic inventories at state warehouses have dropped to their lowest in seven years... Come April, farmers in Australia, the world’s No. 2 wheat exporter, could be planting their crop in dry soils, after months of intense heat curbed yields for this year’s crop… “The (wheat) supply situation in the current 2023/24 crop year is likely to deteriorate compared to last season,” Commerzbank wrote in a note.

Serious, sustained, and widespread upstream constraints will increase the amount of pull needed to attract available supplies (this is often called inflation). Drought-like conditions either upstream or downstream (even more if both) will stress channels in between. And as we have recently seen at the Panama Canal, Suez Canal/Red Sea, Mississippi River, and elsewhere, many channels are having their own systemic problems regardless of supply chain pull or push.

In my experience, the best way to manage worry is to improve observations, preparation, and readiness to creatively respond.

Very best wishes for the New Year.

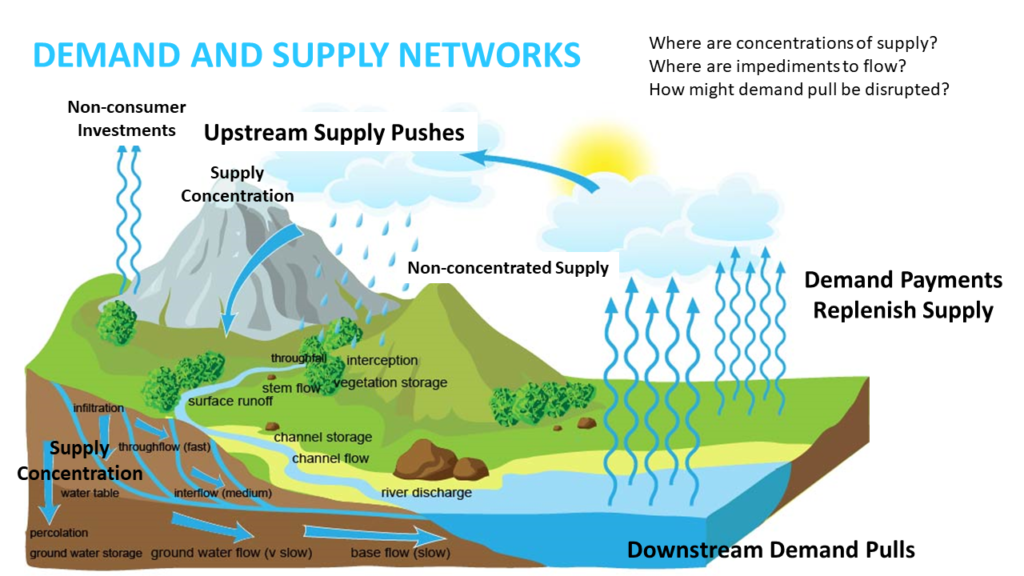
Below is my own mind-map for some key systemic characteristics of demand and supply networks. It works well for me. But I notice it can too often be meaningless — or even misleading — for others. I welcome your critique or questions. I wonder what I have misconceived or how I can more effectively illustrate these dynamics.

2023 Consumption-Demand-Pull

According to the Bureau of Economic Analysis, “Personal income increased $81.6 billion (0.4 percent at a monthly rate) in November. Disposable personal income (DPI)—personal income less personal current taxes—increased $71.9 billion (0.4 percent). Personal outlays—the sum of personal consumption expenditures (PCE), personal interest payments, and personal current transfer payments—increased $47.8 billion (0.2 percent) and consumer spending increased $46.7 billion (0.2 percent). Personal saving was $839.8 billion and the personal saving rate—personal saving as a percentage of disposable personal income—was 4.1 percent in November.”

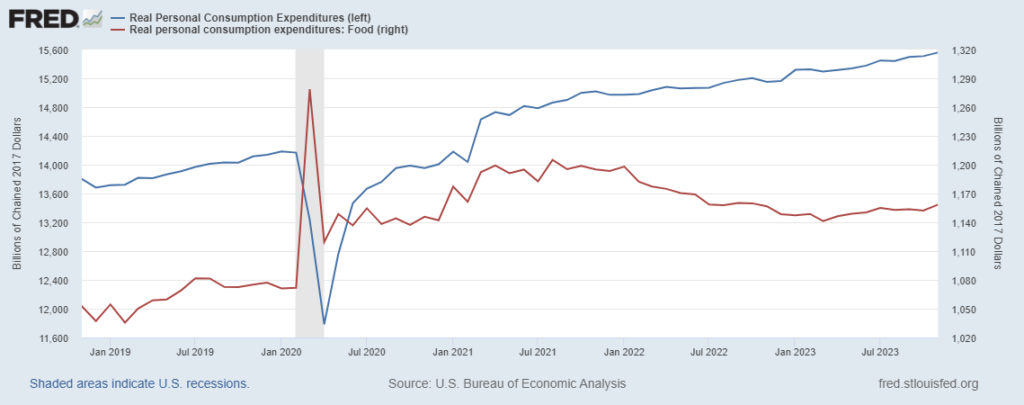
In November 2022 American consumers spent 15,150 billion inflation-adjusted dollars. Last month we spent spent 15,558 billion dollars (see chart below). This is probably about $500 billion more than where pre-pandemic patterns would have brought us. But our rate of change has been coherent with pre-pandemic performance since about October 2021. In any case, healthy, sustainable pull for most push categories — including Food-at-Home as shown below with the red line.

From dark into light

Los puentes colgantes by Federico García Lorca

Oh qué gran muchedumbre,
invisible y renovada,
la que viene a este jardín
a descabsar para siempre!

Cada paso en la Tierra
nos lleva a un mundo nuevo.
Cada pie lo apoyamos
sobre un puente colgante.

Comprendo que no existe
el camino derecho –
Sólo un gran laberinto
de encrucijadas múltiples.

Constantemente crean
nuestros pies al andar
inmensos abanicos
de senderos en germen.

Oh jardín de las blancas
teorías! Oh jardín
de lo que no soy pero
pude y debi haber sido!

 Floating Bridges

Oh what a crush of people
invisible reborn
make their way to into this garden
for their eternal rest!

Every step we take on earth
brings us to a new world.
Every foot supported
on a floating bridge.

I know there is no straight road
no straight road in this world.
Only a giant labyrinth
of intersecting crossroads.

And steadily our feet
keep walking and creating
like enormous fans
these roads in embryo.

Oh garden of white
theories! Oh garden
of all I am not, all I
could & should have been!

The poem is by Federico García Lorca the great Spanish — Andalusian — poet. The photo is of a “floating bridge” over the Almanchares River between Sedella and Canillas de Aceituno, along the ancient spring-fed waterways so crucial to this region. Surely I am not the only Supply Chain or related person who perceives our daily context in these verses. This is where we step. This is why we go. This is how we flow along these intersecting crossroads, giving what we can, making our way in this world, and even unto the next.

כִּי-הִנְנִי מֵבִיא אֶת-עַבְדִּי, צֶמַח.

Kerem Shalom updates

Just in case, updates on humanitarian logistics continue at the December 9 post. Please see chart below. Before October 7 a rough average of 500 trucks per day supplied the residents of Gaza. Two-hundred food and fuel trucks per day has been estimated as minimal to avoid mass starvation. [December 22 Update: Only eighty-eight supply trucks entered Gaza on December 21. Yesterday a new analysis of food insecurity in Gaza reported, “Around 85% of the population (1.9M people) is displaced, with many people having relocated multiple times, and currently concentrated into an increasingly smaller geographic area. There is a risk of Famine and it is increasing each day that the current situation of intense hostilities and restricted humanitarian access persists or worsens.” (More and more.)]

Long-term grid reliability (and risk)

Last week the North American Electric Reliability Corporation (NERC) released its 2023 Long-Term Reliability Assessment (not to be confused with the winter reliability assessment). Here’s the first substantive paragraph in full:

The North American BPS (Bulk Power System) is on the cusp of large-scale growth, bringing reliability challenges and opportunities to a grid that was already amid unprecedented change. Key measures of transmission development and future electricity peak demand and energy needs, which NERC tracks and reports annually in the LTRA, are rising faster than at any time in the past five or more years. New resource projects continue to enter the interconnection planning process at a faster rate than existing projects are concluded; this increases the backlog of resource additions and prompts some Regional Transmission Organizations (RTO) and Independent System Operators (ISO) to adapt their processes to manage expansion. Industry faces mounting pressures to keep pace with accelerating electricity demand, energy needs, and transmission system adequacy as the resource mix transitions.

While not the most elegant set of sentences ever written, this is a reasonable statement of what is happening as the old grid makes a paradigm-shift over the next decade-plus. Following are some choice cherries found in the report. I hope these will mostly motivate you to read the entire report.

Demand-Pull

Electricity peak demand and energy growth forecasts over the 10-year assessment period are higher than at any point in the past decade. The aggregated assessment area summer peak demand forecast is expected to rise by over 79 GW, and aggregated winter peak demand forecasts are increasing by nearly 91 GW. Furthermore, the growth rates of forecasted peak demand and energy have risen sharply since the 2022 LTRA, reversing a decades-long trend of falling or flat growth rates. (See first chart below).

Supply-Push

The total capacity of traditional baseload generation fuel types will continue to decline as older generators retire and are replaced with new generation that has different capacity characteristics. (See second chart below)… The change in resource mix is gradual. Over this 10- year assessment period, Thermal generation, which consists mainly of natural-gas-fired, coal-fired, nuclear plants, and hydroelectric power are projected to continue providing 85% or more of the BPS on-peak generation capacity… The pace of change in the resource mix is likely to be influenced by the addition of more wind, solar PV, battery resources, and the retirement of more fossil-fired generators.

S&P Global reports, “the assessment found a total power capacity increase of 34 GW over the next 10 years, with most incremental capacity coming from solar, while simultaneously new emissions regulations are likely to prompt further resource retirements.”

Channels

The amount of BPS transmission projects reported to NERC as under construction or in planning for construction over the next 10 years has increased, indicating an overall increase in transmission development. Siting and permitting challenges continue to inflict delays in transmission expansion planning. Regional transmission planning processes are adapting to manage energy transition, but impediments to transmission development remain.

S&P Global reports, “Olson (a NERC official) also stressed the importance of expanding the nation’s electric transmission capacity. To that end, NERC has been tasked with conducting a two-year study on the need for more interregional transfer capability with a final report due to the Federal Energy Regulatory Commission by December 2024… As new resources are often in different places than current resources and load behaviors are changing, it’s important that the transmission network is able to adequately serve needs.”

UtilityDive offers a stark summary for a very nuanced report, “Rising peak demand and the planned retirement of 83 GW of fossil fuel and nuclear generation over the next 10 years creates blackout risks for most of the United States… While most regions should have sufficient electricity supply in normal weather, both the Northeast and Western half of the U.S. face an elevated risk of blackouts in extreme conditions. And parts of the Midwest and central South areas could see power supply shortfalls during normal peak operations.”

Houthis hit flows

According to Bloomberg, “A.P. Moller-Maersk A/S, the world’s second-largest owner of container ships, said in a statement on Friday that it has instructed its vessels heading for the southern entrance of the Red Sea to pause their voyages. Its vessel Maersk Gibraltar was attacked. Shortly after Maersk’s announcement, Germany’s Hapag-Lloyd AG announced a halt until Monday…” (More and more.) According to S&P Global these two shipping firms account for a bit more than 21 percent of global container flows. Significant oil and LNG shipments follow the same route. S&P Global also reports, “The Bab al-Mandeb, which lies between the Horn of Africa and the Middle East with a narrow width of 20-mile, connects the Red Sea to the Gulf of Aden and the Arabian Sea. It accounted for 8.8 million b/d of total oil flows in the first half of 2023, according to the US Energy Information Administration. LNG flows through the strait were 4.1 billion cf/d during the same period, EIA data showed.”

December 18 Update: Several more carriers have announced they will avoid the Bab al-Mandeb — and therefore the Suez Canal. Here and here and here. Late Afternoon: Bloomberg reports, “From BP Plc to A.P. Moller-Maersk A/S, companies that transport consumer goods, commodities like coal and corn, and energy supplies face longer journeys. While there’s some slack in global supply lines to absorb the recent capacity strains, the sudden closure of the Suez Canal in 2021 showed how fragile networks are when major links break down.” Reuters reports, “The disruptions would likely affect supply of consumer goods ahead of the Chinese new year in particular, with delays leaving retailers with unsellable stock and ultimately driving up prices for consumers, said Marco Forgione, director general at the Institute of Export and International Trade.” S&P Global reports, “The US is seeking a regional coalition to secure Red Sea navigation, with a summit to be convened virtually Dec. 19, as a series of vessel attacks launched by Iranian-backed Houthi militia in Yemen has already prompted BP and several shipping companies to reroute cargoes.”

Risks associated with Bab al-Mandeb disruptions are amplified by continuing constraints at the Panama Canal.

December 21 Update: S&P Global Reports, “Although selling economics in the recent weeks for LNG was incentivizing supplementary cargoes to move from the Pacific to the Atlantic, heightened global tensions amid the attacks in the Red Sea have subdued redirecting cargoes between basins. Additionally, constraints with the Panama Canal has further worsened trading between basins and market participants battle the uncertainty in both the Panama and Suez canals… With traders now keeping cargoes within their respective basins, and demand still lagging behind, vessel availability has improved significantly since last month. While the number of available spot vessels in the Atlantic was steady week on week, it has nearly tripled since the end of last month till now. In the Pacific, vessel availability has risen slightly on the week and has nearly doubled since the end of November.” (More and more and more.)

December 22 Update: FreightWaves reports, “Current fallout from the Red Sea crisis is focused much more on container shipping than other vessel segments. Virtually all container vessels are rerouting around the Cape of Good Hope. Container ships that had already transited southbound through the Suez but had yet to reach the Bab-el-Mandeb Strait are now turning back, paying another toll to get to the Mediterranean. Numerous bulk commodity ships are heading to the Cape, as well, but not to the extent container ships are. That could change with a military escalation, which could increase reroutings across all shipping sectors.”

Bab al-Mandab strait into and out of the Red Sea (and Suez Canal)

Maritime shipping routes and their main destinations (Heinrich-Böll-Stiftung European Union)