Yesterday the North American Electric Reliability Corporation (NERC) released its 2023-2024 Winter Reliability Assessment for the North American grid. Here’s how NERC summarizes its findings:
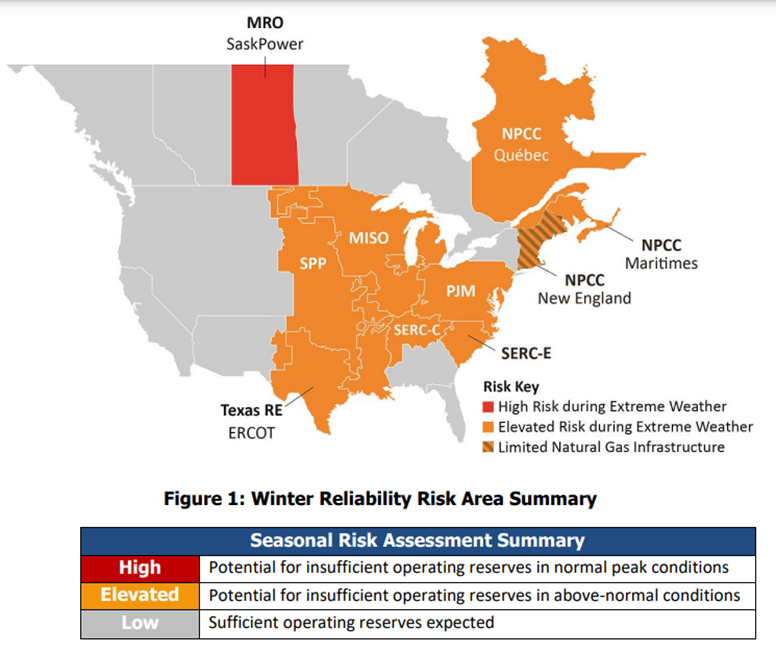
…much of North America is again at an elevated risk of having insufficient energy supplies to meet demand in extreme operating conditions. The areas identified as being at elevated risk extend over much of the eastern two-thirds of the continent. In these areas, although resources are adequate for normal winter peak demand, any prolonged, wide-area cold snaps will be challenging due to generator outages and fuel vulnerability, extreme levels of electricity demand, difficulties in accurate forecasting and the risk of firm electricity transfer curtailments.
Below is a map with risk assessments for each of the regional bulk power networks.
Bloomberg explains, “The grid’s vulnerabilities have been revealed during storms in recent years, notably a 2021 deep freeze in Texas that left more than 200 people dead. While utilities and power generators have made efforts to weather-proof equipment, the NERC report determined that many are still at risk. Gas and coal deliveries can both be hampered during extreme weather and plants can be forced offline, just as cold temperatures drive up power consumption.”
There was also a very close call late last year impacting MISO, PJM, and SERC (both C and E). Here and here are some related reports by this blog. As usual I tend to emphasize demand dynamics. Here is the FERC plus NERC report on that event. Please read this report. It is clear, comprehensive, detailed, and helpfully frames the strategic (architectural?) and tactical (engineering?) challenges for moving forward. Here is a brief example:
From December 21 to 26, 2022, in the Event Area, a total of 1,702 individual generating units—47 percent natural gas-fired, 21 percent wind, 12 percent coal, 3 percent solar, 0.4percent nuclear, 17 percent other (oil, hydroelectric and biomass)—experienced 3,565 outages, derates, or failures to start… Ninety-six percent of all outages, derates, and failures to start were attributed to three causes: Freezing Issues (31 percent), Fuel Issues (24 percent) and Mechanical/Electrical Issues (41 percent). Of those outages, derates, and failures to start, 55 percent were caused by either Freezing Issues or Fuel Issues… Natural Gas Fuel Issues (a subset, but the majority, of Fuel Issues) were 20 percent of all causes, and issues with other fuels were four percent. In addition to the outages, derates, and failures to start caused by Freezing Issues, those caused by Mechanical/Electrical Issues also indicated a clear pattern related to cold temperatures—as temperatures decreased, the number of generating units experiencing an outage, derate or failure to start due to Mechanical/Electrical Issues increased.
Good news: The current long range winter forecast for North America calls for above-average temperatures and extended extreme cold seems to have become less common than extreme heat (not exactly good news in August). Bad news: our temperature averages increasingly include more extreme short-term events — such as Winter storms Uri and Elliott. In the Northern Hemisphere these sudden onset anomalies are often associated with the polar vortex. Halloween weekend much of the United States experienced a rapid cool-down courtesy of polar weather escaping to the south. As winter deepens, these quick holiday flights — Christmas, New Years, Ground Hogs Day — will get even colder.