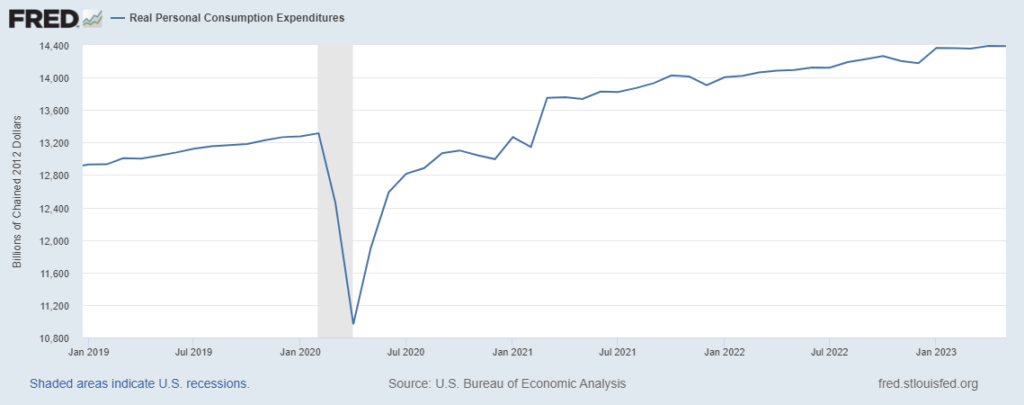
Since January the US economy has been navigating a spending plateau. It is a high plateau. In May Real Personal Consumption Expenditures were measured at $14,386 billion. In May 2019 real PCE was $13,037 billion (see chart below). The most recent PCE strikes me as consistent with the entirely constructive pre-pandemic trendline — disregarding all our turmoil in-between.
This morning’s US Bureau of Labor Statistics‘ Employment Situation Summary for June reports historically low unemployment, continued (if moderating) growth in new jobs, and a slight increase in the labor participation rate among workers age 25-54 (the participation rate is flat as a ratio of total population). A friend told me, “job growth was going too fast for conditions, we are now back to a sustainable safe speed for where we want to go.” According to Bloomberg, “The increase in average hourly earnings followed similar gains in the prior two months, and was up 4.4% from a year earlier. The average workweek edged up.” Recent rates of wage growth exceed the inflation rate.
In addition to a mostly favorable employment context, many US households still enjoy “excess savings” (more and more). This savings buffer is gone for some and much reduced for most. But depending on who’s counting what, the amount of reserve cash still available is between $500 to $900 billion. No wonder the current Personal Savings Rate remains less than the pre-pandemic average. The overall money supply is well-off its late 2021 peak but well above pre-pandemic expectations. In other words, while economic growth is soft, demand capacity is strong… and US consumers are spending.
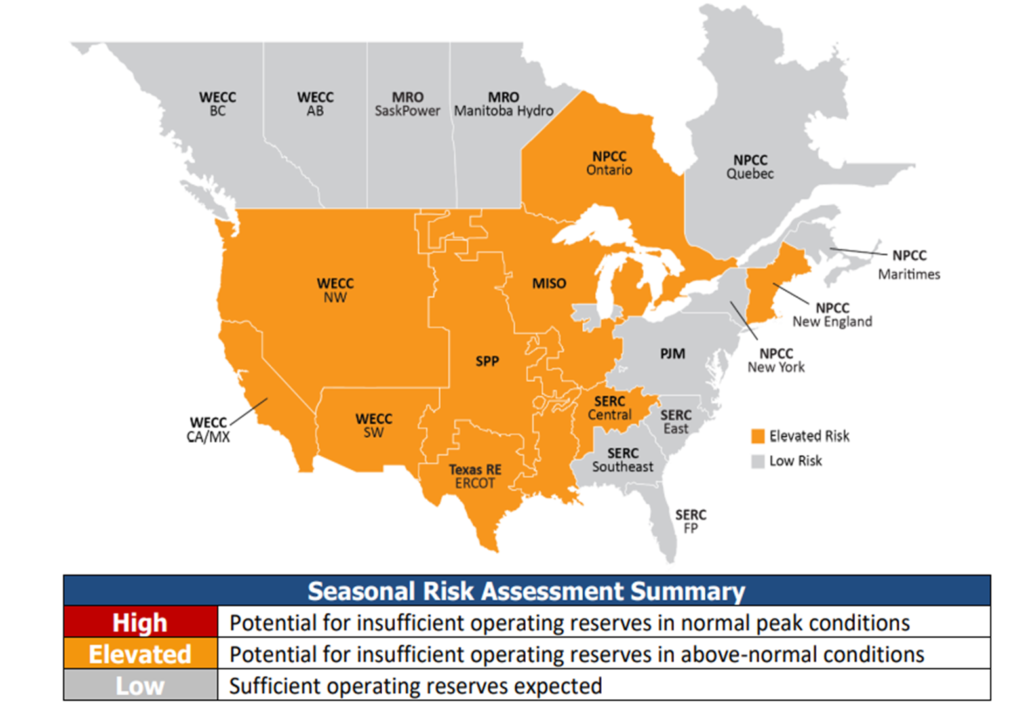
There are admittedly mixed signals regarding fulfillment capacity. Stubborn — and occasional surprise — points of friction can be found. More than normal? More than pre-pandemic? Atypical given level of demand and labor patterns?
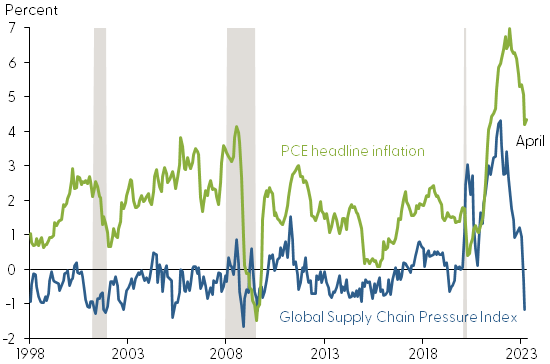
At cruising altitude, the Global Supply Chain Pressure Index suggests helpfully fluid conditions. The Cass Freight Index for May shipments was a comparatively healthy 1.166. Since recovery from the Great Recession, a “healthy” total business inventory to sales ratio has typically ranged between 1.35-to-1.45. Significant supply chain stress was signaled when the 2021 ratio fell below 1.3. So far in 2023, the total business inventory to sales ratio has been flirting with 1.4 to one. According to one Federal Reserve analysis supply constraints are much less likely to be disproportional contributors to PCE inflation than between 2020 and the first half of 2022.
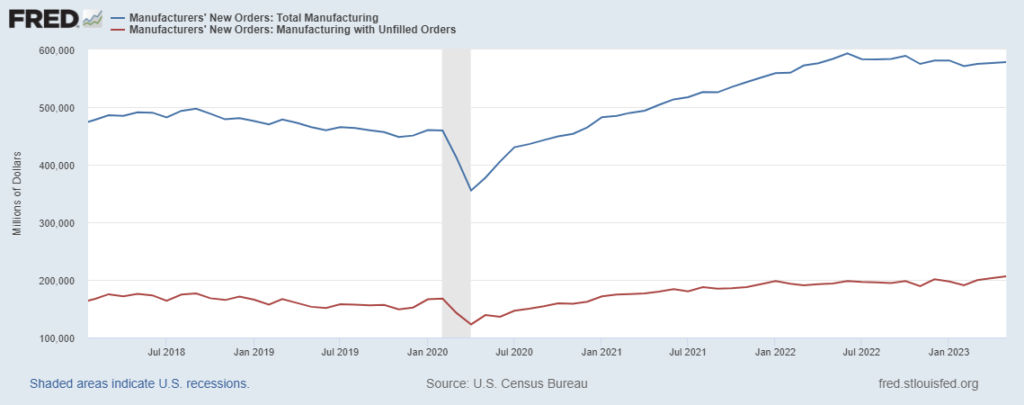
Then consider the second chart below. In May 2019 roughly one-third of new domestic manufacturers orders could not be fulfilled during the survey period. Between May 2019 and May 2023 nominal (not-inflation-adjusted) demand grew by nearly one-fifth, yet the proportion of unfulfilled orders edged up barely two percent.
US consumers are pulling and have the capacity to continue at close to current velocity. Domestic push capacity is about as well-matched to current pull velocity as it was pre-pandemic.


