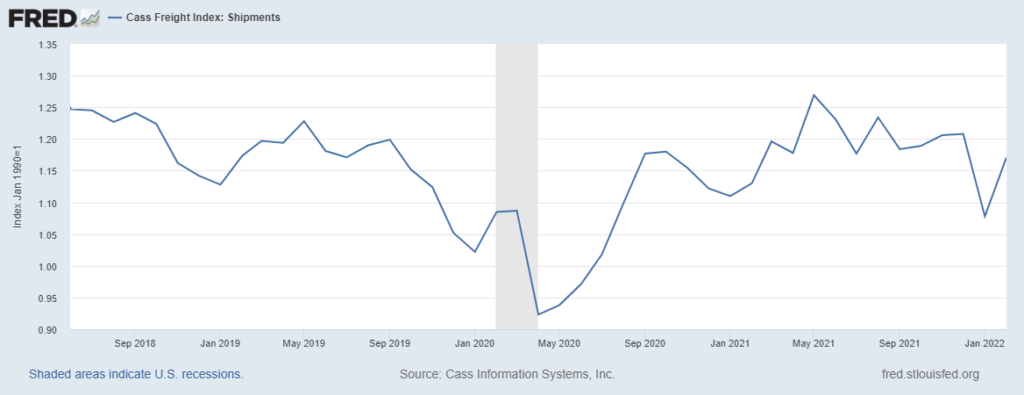
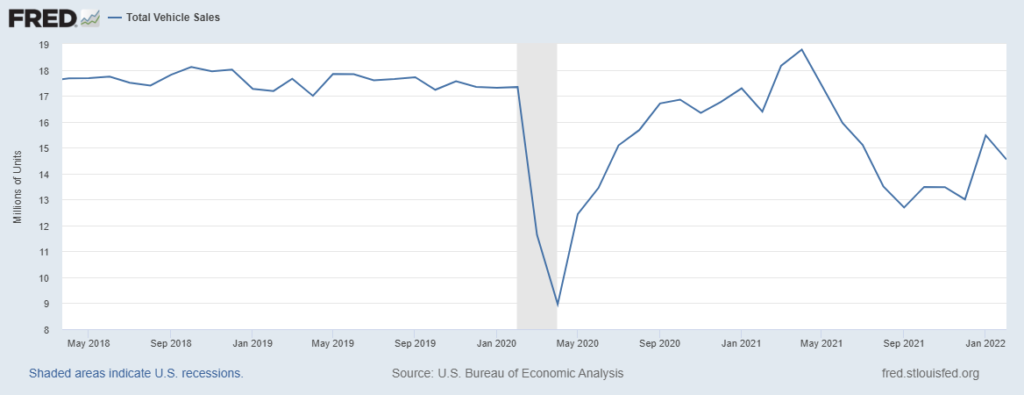
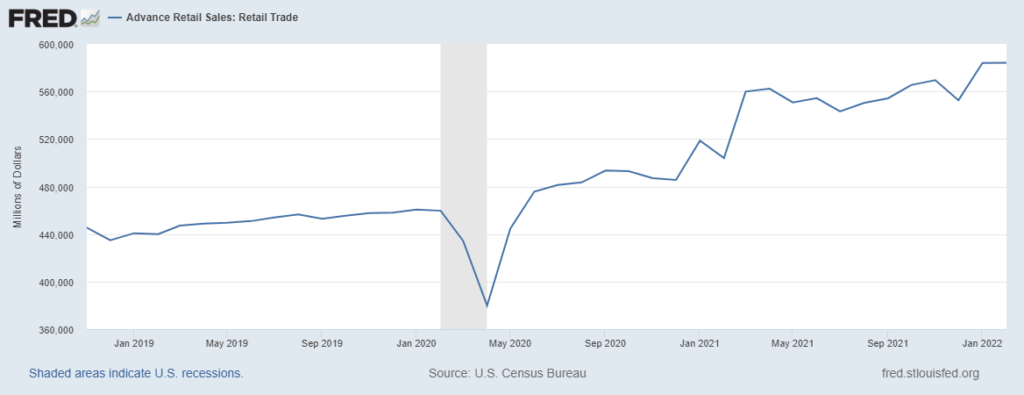
Category: Uncategorized

The China Card

Early this week I was at a meeting where the mostly US crowd seemed mostly unaware of the rising number of covid cases in China and Europe. A few knew about BA.2 in the UK. No one who talked to me was watching China (more and more and more). There seemed to be a consensus that — at least in the United States — covid is contained, even effectively over.

This judgment is premature.

Even if US hospitalization rates can be appropriately demand-managed, the flow consequence of a covid surge in China could make 2021’s global supply chain stress seem like Guns N’ Roses opening for the Rolling Stones. Moreover, viral outbreaks in China will come with a mutation potential that shifts the decibel level (threat level) into KISS, Who, and Deep Purple territory.

In April 2021 this blog identified five strategies for effectively engaging and living fully with covid “for another year — probably two…”: 1) vaccinate, 2) test, trace, and contain, 3) support global mitigation, 4) reduce overall circulation, and 5) avoid interior crowds. This song is still worth singing. Covid continues to dance, even if we are ready to call it a night.

Demand-Supply Dialectics

This is the seventh — and perhaps final — in a series of posts examining supply chain resilience reports released by the White House on February 24.

Most of the “Sectoral Supply Chain Assessments” are grounded in recent challenges, especially pandemic-prompted problems. The energy report is an outlier with much more attention to emerging issues of climate change (more).

Each report tends to be preoccupied with upstream concerns and complications related to sourcing and production capacity.

Each report gives attention (some more, some less) to potential over-concentration of upstream flows. Significant dependence on proportionally few high-volume nodes and channels increases network vulnerability. This could be the most helpful insight identified by the reports — when accurately and meaningfully received.

None of the reports give much attention to the influence of downstream demand on upstream behaviors. Mid-stream is sometimes treated as almost detached from up or down. In my judgment, this tendency fails to reflect fundamental realities.

All of the reports are mostly examples of the public sector — really just the federal sector — talking to itself. This can be helpful, especially if this internal process is conducive to ultimately involving other sectors in well-conceived shared conversations. [Conducive: connect, bring together, collect, join, assemble]

As a collection, the assessments are culturally coherent (reflecting a generally shared understanding of problems and problem-solving-processes), but strategically inconsistent, maybe even strategically incoherent. Key connections between the five policy documents examined here (also see note below) remain obscure or simply absent. This is not uncommon (or even unexpected) from a year-long interagency process. But supply chain practitioners, network scientists, and even some public servants will be annoyed by the interstitial opportunities lost in the process.

I want to avoid damning with faint praise. I recognize earnest, expert effort expended on a very difficult problem-set during a troubled time. I know the challenges of interagency policy-making well-enough to envy no one involved therein.

I also discern in these reports an implicit, fairly consistent operating thesis that would benefit from more explicit consideration. Behind the references to resilience are concerns about scarcity or shortages or insufficiencies. Medical personnel operating without Personal Protective Equipment and car factories closing because of unavailable parts and empty shelves where meat or soup or toilet paper have usually appeared are all recent realities. But in the vast majority of such cases, supply has not been scarce (as in rare, diminished, or poor), rather supply being pushed has often increased, but demand has pulled even faster.

Demand and supply networks (worthy of the designation) organize around demand to achieve a rough equilibrium of pull and push. The give and take of demand and supply is tangibly interdependent (and mirrored in more fungible financial flows). In mature-capitalist high volume, high velocity networks, scarcity is typically more relative than real. A disequilibrium of demand and supply may well reflect a shortage of what is wanted by producers or consumers. But this need not reflect reduced supplies. In early March 2022 grocery stock-outs in the United States are most often the result of reduced capacity to load and drive delivery trucks, not reduced production. In March 2020 grocery stock-outs in the United States were the result of a doubling or more of demand in a two week period. Swift shifts in demand capacity or distribution capacity are much more frequent culprits than lost production capacity.

Disequilibrium can certainly be caused by scarcity. A drought (literal or metaphorical) may unfold into famine for those unable to relocate closer to necessary flows (or attract such flows towards them). But it seriously complicates problem-solving to treat disequilibrium caused by flooding as if it was the result of drought.

Rather than assume scarcity, we should seek to discern disequilibrium as an expression of dynamic interdependencies encompassing both demand and supply, density and distance, differentiated durations, capacity and capability, pull and push. Supply and demand interact to create flow, assimilating aspects of both supply and demand.

On Tuesday a private-public group convened in the Old Executive Office Building. Around the table were enterprises, such as Albertsons, Target, and True Value, that focus on consumer demand. Others, including Land O’Lakes, focus on supply. Several at the table concentrate on moving supply toward demand by water, air, or land. Midstream — long-distance to last mile — was especially well-represented. These organizations have agreed to start-up a “first information exchange that will support a more resilient and fluid supply chain.” The voluntary collaborative effort is branded “Freight Logistics Optimization Works” or (of course) FLOW. According to the White House, the meeting participants discussed,

… greater data transparency across the supply chain and how this would benefit not only their respective companies but also the system more broadly, cutting waste and reducing costs for consumers. Participants acknowledged the current system is underperforming and needs greater investment and more collaboration in creating ship to shelf visibility into the primarily private-sector owned supply chain. A more reliable, predictable, and accurate information exchange about goods movement is the hallmark of a globally competitive 21st century goods movement chain and is especially important for small- and medium-sized businesses who lack visibility into the current system. (More.)

This is an early step to facilitate ongoing communication across the various phases of flow, allowing collaborators to observe and engage a more comprehensive context — something close to the full watershed of flows — not just near-term consequences of near-by discharges. In this way, it is hoped, individual participants will be able to adapt earlier and more effectively — even collaboratively — to factors that could disrupt flow.

There are plenty of reasons for FLOW to fall apart before having a chance to demonstrate value. There are even more reasons to hope the initial participants are soon joined by many others. Enormous value is possible if participants can work through tough technical issues, treacherous competitive dynamics, and complicated regulatory prospects. FLOW is a co-laboratory where all the contending, pending perceptions set out in the supply chain assessments can be empirically and practically engaged — clarified, corrected, and even confirmed.

+++

Still to come is a brief note on the sixth Sectoral Supply Chain Assessment by the Department of Defense. It will appear below at some future date (maybe this weekend).

March 19, 2022 Update:

Among the February 24 Sectoral Supply Chain Assessments is DoD’s “Securing Defense Critical Supply Chains.” Of the six One-Year assessments delivered, this is arguably the most sophisticated with balanced attention to critical needs, systemic capacity, production/ distribution vulnerabilities, and aggregate demand. For those involved in the Defense-Industrial complex, this is a helpful analysis and set of recommendations. In my judgment, however, even with a $700 billion-plus budget and admittedly contentious, complex demand signals, DoD’s planned procurement supply chain is substantively differentiated from demand and supply networks organized around mostly unplanned purchasing decisions by tens-of-millions of independent consumers. For example, Americans spend more than double the Defense budget on Food At Home and another double on Food Away from Home. Supply chain thinking is relevant to military missions — as dramatically demonstrated in Ukraine. But there is a command-orientation to the Defense supply chain that is antithetical to the highly competitive demand-orientation of high-volume, high-velocity commercial ecosystems. This is why I have not given this assessment the same attention as to the other five.

BA.2: Blip or Bigger?

Scotland is experiencing a significant increase in covid cases and related hospitalizations. The BA.2 omicron sub-variant is being blamed (in Denmark as well as elsewhere). Spread to Wales and England is now being observed. For several months this conversation has tracked hospitalization data in Denmark, Israel, UK, and USA (prior example). Below are current demand patterns for hospital-based covid care. It is not yet time to confidently project the scope and scale of another surge here or there, but these shifts are worth close attention.

Information Flows

This is the sixth post in a series examining the supply chain resilience reports released by the White House on Thursday, February 24.

The Departments of Commerce and Homeland Security collaborated on an Assessment of the Critical Supply Chain Supporting the US Information and Communications Technology Industry. Particular attention is given to 1) Printed Circuit Boards (PCB), 2) Fiber Optic Cable, 3) PCB Assemblies and Electronic Assemblies, 4) Routers, Switches, and Servers, and 5) LCDs/Displays.

The report includes this explanation of strategic context:

Over the past 30 years, the ICT [Information and Communications Technology] industrial base has evolved from being vertically integrated to being one that is highly outsourced, with most major brand companies outsourcing nearly every step of and input into the manufacturing process. Beginning in the mid-1980s, original equipment manufacturers (OEMs) in the computer industry, such as IBM and Cisco, that traditionally managed end-to-production services, began outsourcing manufacturing and software development to specialized technology companies, such as Intel (microprocessor chips) and Microsoft (operating software), and to contract manufacturers. Contract manufacturers are companies that perform manufacturing services for other companies on a contractual basis. To produce a computer, these OEM companies could no longer design and manufacture their own computer chips or develop operating system software, but instead, so that their equipment was compatible with everyone else’s, outsourced these needs to companies specializing in those products, such as Intel and Microsoft. This process, called vertical specialization, led ICT OEMs to focus on design and innovation of new and improved technologies. Over time, OEMs have increasingly adopted this business model with many companies eliminating all manufacturing capabilities. These OEMs now add value primarily through research and development, product design, and marketing new technologies to their customer base. By 2006, leading computer companies, including Dell, HP Inc. (formerly Hewlett Packard), Acer, and Apple, had completely outsourced their notebook manufacturing operations. The U.S. ICT industry reflects this evolution of the OEMs. The United States is the world’s leader in technology innovation, but most hardware manufacturing takes place in other countries. (Page 15)

The authors argue that as a result of this evolution, the ICT industrial base in the United States is not an ecosystem. The United States is an important source of downstream ICT demand and upstream intellectual/financial investment in ICT. But this domestic push and pull depends almost entirely on sourcing, processing, manufacturing, and transportation capacity outside the United States. If I am accurately reading between-the-lines, the authors may even be skeptical that the global ICT network of demand and supply fits the definition of an ecosystem. ICT manufacturing capacity is, potentially, so specialized by function, consolidated by enterprise, and concentrated by geography that it is much more an engineered network than a complex adaptive system. This is a provocative possibility. The February 24 report implies much more than it claims in this regard.

Even if the ICT industrial base better reflects the physics of the factory than the ebb and flow of watersheds, it is a huge and fantastically complicated factory. The report outlines:

A large multinational organization can have hundreds of tier one suppliers from which it purchases components directly. In turn, each of those tier one suppliers relies on hundreds of tier two suppliers. The whole supplier network for a large company can include tens of thousands of companies around the world when the deepest tiers are included in the network. For many companies, especially small -and medium-sized businesses, it is very difficult, if not impossible, and costly to obtain an accurate and complete picture of an organization’s entire supplier network. Making this effort even more difficult is the fact that a company’s suppliers can change on very frequent basis. Communications Equipment companies are one of the industries that have the largest number of tier one suppliers, with 2.2 times the industry median. (Page 60)

Eight recommendations are offered to increase the supply chain resilience of the ICT industrial base. I perceive that at least five of the eight (and potentially all eight recommendations) are intended to, first, reduce the current geographic concentration of ICT production capacity and, second, re-shore significant production capacity to the United States. There is a particular concern for reshoring manufacturing of PCBs and related assemblies. I do not recognize much emphasis on reclaiming a global or domestic ecosystem featuring significant diversity and independent self-organization.

+++

This series of posts started with acknowledging my bias regarding Supply Chain Resilience. For my principal purposes, the ICT sector is fundamental to how digital transactions and inventory management — and related network pulls — are organized and communicated to reflect demand. The Departments of Commerce and Homeland Security — appropriately — are concerned about other purposes. I am concerned mostly with facilitating downstream demand. They are concerned (mostly) with ensuring upstream supply of ICT capacity for my purposes and other purposes. These are complementary, not competitive angles. But it is also worth noting the strategic expanse extending between these two priorities.

Pushing, pulling, and potential fraying

Several updates through March 17 included below.

Between late January and late February evidence accumulated of decreased congestion, friction, and stress in US and global supply chains.  The US inventory to sales ratio improved more between November and December than at any time since the deep declines of Spring 2020 (fingers crossed for the January ratio due next week). The ginormous chokepoint at the Ports of LA/Long Beach is much less congested than Autumn 2021 (more). The Global Supply Chain Pressure Index researched and published by a team at the Federal Reserve Bank of New York, suggests that current constraints are similar to those in Spring 2021 — at the start of pandemic demand surge. The Fed’s researchers write, “Overall, we note that supply chain pressures have moderated relative to the peak reached in December 2021, but these pressures have remained at historically elevated levels through February. Going forward, there is the possibility that the current heightened geopolitical tensions might lead to more elevated supply chain pressures in the near future.”

“Geopolitical tensions” is, of course, code for Russia invading Ukraine and all the treacherous turmoil unwinding therefrom. So far actual reductions in commodity flows have been modest (e.g., natural gas from Russia through Ukraine to Western Europe). But the dramatic disruption of financial flows caused by sanctions and the prospective loss of spring planting in Ukraine all point to serious reductions — or at least complications — in availability of Russia’s oil (about 11 percent of global production) and both Russian and Ukrainian wheat (about 30 percent of global production). (More ) Significant proportions of global output for nickel, palladium, aluminum and much more are caught in the cross-fire (more). Duration of and distance from hostilities will influence who is cut off how much from what. The potential parameters of both duration and distance are deeply uncertain.

Vulnerability can be measured. Threat not (yet?) so much, so risks emerging from these geopolitical tensions remain ambiguous.

Another prospective threat to global supply chains: Is Hong Kong’s weeks long surge in coronavirus hospitalizations a leading indicator for what’s next across the People’s Republic? (More and more.) Changchun has been locked-down and Shanghai is seeing more covid cases than ever before (more). There is cause for some concern that China’s considerable success in minimizing transmission of the coronavirus could, paradoxically, increase population vulnerability to more contagious recent variants (and those to come).

So far, Beijing’s approach to fighting covid has, arguably, preserved economic productivity by limiting the scope and scale of lock-downs (and transmission and disease and death). But if there are wide-spread simultaneous breakouts of disease, the current “Dynamic Clearing” process would quickly amplify network-wide constraints. If Dynamic Clearing is superseded there is also a risk of significant disease penetration of China’s workforce and reductions in flow. There are no risk-free options. Whatever is chosen (or happens), “China’s big leap may affect the rest of the world as well. Unleashing COVID-19 on a population of 1.4 billion means a lot of people “will be brewing the virus,” says Gabriel Leung, HKU’s dean of medicine. That will provide ample opportunity for new variants to emerge. “It’s not just a national problem, it’s actually a global issue,” according to a March 1 report in Science.

Likewise for a significant loss of flows to or from China. According to Reuters, “For all of 2021, total [China] exports rose 29.9%, compared to a 3.6% gain in 2020. Imports [to China] for the year gained 30.1% percent, after falling 1.1 percent in 2020.” China is the source for 17 to 18 percent of global economic activity.

+++

March 14 Updates:

Foxconn, Apple supplier, shuts China plants as covid outbreaks grows (Financial Times) “The lockdown in Shenzhen is scheduled to last for six days and could compound disruptions to global supply chains that have contributed to rising inflation in the US and Europe.”

Russia-Ukraine war threatens wheat supply (Wall Street Journal): “Wheat stockpiles were already running low and prices were the highest in years thanks to two years of poor growing weather when Russia’s attack jammed up Black Sea trading and endangered nearly a third of the world’s exports. The invasion prompted fears of food shortages in countries fed with imported grain and pushed prices to new highs.”

March 15 Updates:

Druzhba oil pipeline continues to supply Russian oil to Central Europe (Financial Times) “Russia’s state-owned Transneft, which operates Druzhba, aims to deliver roughly 914,000 b/d to Europe down the pipeline in 2022, of which 261,000 b/d will flow to Poland and 388,000 b/d to Germany, according to S&P Global. Transneft said flows via the pipeline were continuing. In total it provides a quarter of Germany’s crude oil.”

Shenzhen lock-down will impact US ports (Bloomberg) “The number of container vessels waiting to berth in the eastern city of Qingdao has climbed to 22 from 9 just a week ago… and the queue is also growing at the biggest port in Shanghai… This will affect the U.S. in the next month or so, because fewer vessels will leave for the West Coast…  And if a big surge of cargo into the Los Angeles-area ports follows once restrictions are lifted, it could seize operations already stressed by equipment dislocation, labor shortages and congestion on the docks.”

March 17 Updates:

China lock-downs cause supply chain shocks (Financial Times) “China is digging itself into a deep hole with its zero Covid policy,” said Olaf Schatteman, a supply chain expert at Bain, the consultancy. “As the restrictions are hurting suppliers and logistics operations, companies are moving beyond containing the current crisis and towards diversifying production locations, undermining China as the supply chain hub of the world.”

Crude oil capacity continues to be constrained (S&P Global) Prices are volatile. Loss of Russian flows are expected to hit hard in the next few weeks. “Supply losses of this magnitude would be more than enough to keep the market in deficit for at least the next two quarters…” The IEA expects a long-term loss of more than 1 million barrels per day of global refinery outputs. But US crude flows and inventories are strong. Global demand may be easing. US crude oil production exceeds domestic demand. US refineries have recently operated at less than 90 percent capacity. US domestic fuel supplies are in rough equilibrium with domestic demand. Global disequilibrium of demand and supply will continue to prompt domestic price increases (though potentially at a rate less sharp than anticipated last week). (More)

Russian Invasion

A few readers are surprised by my silence so far on the supply chain implications of Russia’s invasion of Ukraine.

Perhaps my most constructive comment: Risk is tough to measure. Uncertainty cannot be measured. I remain profoundly uncertain regarding the scope and scale — space and time — implications of the current crisis. While I have sometimes been criticized for “getting ahead” of data, even I prefer to be confident of my subject before offering a predicate.

On February 24, I responded as follows to some specific questions:

Even before today, the Ukraine-Russia crisis was contributing to higher petrochemical and raw grain prices. There is also typically a price-multiplier between global energy costs and food costs… So, that will continue and, probably, accelerate with impacts on US fuel and food prices (but probably NOT much impact on actual US fuel and food supplies). Russia is a principal source of several strategic materials (e.g. nickelpalladium, and aluminum).  But it is too early (at least for me) to confidently project primary, much less tertiary supply chain consequences.  In terms of moving toward action, I will confess that I think this is, so far, a “reduced resilience” story for the United States. There are much more extensive supply chain implications for Germany, Poland, the Baltic States, and Finland (I hear mixed signals on the other Nordics.) I can imagine potential implications for China flows (inbound and outbound) and that could have more direct US impacts. But barring something similar to this morning being repeated across the Taiwan Strait, I think these China-related influences will be fairly gradual.  Happy to try to answer questions. But we are dealing with plenty of known unknowns and even more deeply hidden unknowns.

I could lengthen these early — obvious — comments. The big picture now has many more details, but the meaning and momentum for US supply and demand networks remains very ambiguous (at least to me). For what it is worth, to better discern meaning and momentum, I am trying to be especially attentive to how rapid price escalations may impact near-term US demand behavior. Well before the invasion, US flows have been complicated by what I have called excess demand. As Russia’s and Ukraine’s supply streams are stopped or diverted (especially for rare metals, fossil fuels, and agricultural goods), global prices will increase for remaining related flows. Will these price increases moderate — suppress — US demand?

Fuel Flows

This is the fifth post in a series examining the supply chain resilience reports released by the White House on Thursday, February 24.

The Department of Energy sectoral supply chain report gives less attention to current energy vulnerabilities than to transitioning from fossil fuels to clean energy. Achieving clean energy objectives is seen as enhancing national resilience to climate change, reducing US dependence on the global fossil fuels market, and more sustainably assuring energy resources for long-term US demand.  As the report states:

Global energy end-use continues to be highly dependent on fossil fuels. In the United States, as of 2020, about 79 percent of primary energy end-use and 60 percent of electricity generation came from fossil fuels, including petroleum, natural gas, and coal (EIA, 2021). Multiple countries, including the United States, have pledged to achieve net zero greenhouse gas emissions by 2050 to keep the global temperature change below 1.5 degrees Celsius and avoid catastrophic global climate change. Achieving this goal will require massive deployment of clean energy technologies and an accompanying scale-up in their supply chains, both domestically and globally (IEA, 2021). 

The DOE report acknowledges this transition will take several years. Meanwhile, there is a continued need for robust and resilient flows of fossil fuels.  This is a particular concern in case of a large-scale catastrophe (aka “My Problem“).  For example, how do we fuel water pumps, electric back-up (including telecoms), and trucking following an 8.0 plus seismic event involving a large population? 

There are plenty of other risks for which current fossil energy capacity is crucial. Yesterday, March 9, US Secretary of Energy, Jennifer Granholm, told a Houston energy conference:

We are on a war footing—an emergency—and we have to responsibly increase short-term supply where we can right now to stabilize the market and to minimize harm to American families. That means releases from strategic reserves across the world, like we’ve done. And that means you producing more right now, where and if you can… we’re serious about decarbonizing while providing reliable energy that doesn’t depend on foreign adversaries. That means we’ll walk and chew gum at the same time. So yes, right now, we need oil and gas production to rise to meet current demand (more and more and more).

Three relevant factoids:

Current US fossil energy production capacity is strong.  Before the pandemic dampened demand, US crude oil production was at a historic high and continues to be close to half-century highs.


Prior to the pandemic, US refining throughputs were strong.  This capacity continues to be available. 

U.S. gross inputs to refineries

National distribution capacity for fossil energy is constrained but sufficient for ordinary demand. Today there are — very roughly — 100,000 tank trunks operating in the United States. This compares to about 85,000 in 1980. Pre-pandemic the volume of gasoline being consumed was about one-third higher than in 1980. US pipeline miles for refined product have essentially not changed in this century (pipeline miles for moving crude oil have expanded). We are doing more with the same or proportionally somewhat less. In a pinch, our margin for error is also less.

The policy of the US government — and many private investors — is to accelerate clean energy capacity. There are good reasons to do so. It is also reasonable to recognize that this will be a treacherous transition, with or without WWIII. Supply Chain Resilience principles emphasize diversity, adaptability, and agile, creative self-organization.

Freight Flows

This is the fourth post in a series examining the supply chain resilience reports released by the White House on Thursday, February 24.

The US Department of Transportation’s supply chain assessment of freight and logistics includes the following concise consideration of recent (and systemic) problems (pages 10-11). Any three-paragraph explanation of something this complex can be critiqued, but this is a very constructive framing. USDOT gives demand deserved prominence:

The demand for consumer goods has surged during the COVID-19 pandemic as consumers have shifted their spending from services to goods. Many of these goods are imported or rely on parts or materials sourced from abroad. At the same time, the pandemic has created disruptions in supply chains, including for businesses and workers. Surging demand for imported containerized goods and supply chain disruptions are among the numerous factors that have contributed to unprecedented levels of congestion at ports and intermodal facilities. These short-term changes have been coupled with long-term, macroscale trends in the freight and logistics industry, brought on by deregulation of the ocean shipping industry, that have produced conditions that make the nation’s freight system more vulnerable to disruption than in the past. As one industry expert noted, “[this current supply chain challenge] is 40 years in the making.

Over time, increased international trade, rising demand for consumer goods, sustained macroeconomic growth, and other factors have increased demands on our transportation industrial base. U.S. manufacturers and retailers increasingly rely on global supply chains for products and resources. In recent decades, U.S. firms trying to lower their labor and inventory costs have turned to strategies such as outsourcing, offshoring, and “lean manufacturing,” which optimizes processes and limits waste. While these strategies have in some circumstances reduced prices for consumers and increased profits, contributing to economic growth, they have also contributed to increasing the vulnerability of supply chains to disruption. Rising e-commerce and increased consumer demand for rapid home delivery have led to significant changes in how supply chains operate, as retailers seek to increase the speed and efficiency of their networks to distribute goods directly to consumers.

The evolution of supply chain distribution has led to rising consumer expectations for rapid delivery, and this demand has put increasing pressures on logistics, warehousing, and last-mile delivery services. Retailers face steep competition to move goods efficiently to consumers at increasing speed. This dynamic is driving demand for land to support distribution centers for both retail and last-mile delivery, and for labor to stock warehouse shelves and make deliveries. At the same time, the labor force has aged, and parts of the logistics industry have increasingly struggled to recruit and retain new workers due to challenging working conditions and reductions in take-home pay, especially in industries like trucking. In addition to demographic and economic changes, climate change—particularly the increased frequency and severity of extreme weather events—has increased the potential for disruptions to supply chains.

Lots of moving parts. Lots of interdependencies. Lots of potential trade-offs: intended, unintentional, predictable, surprising. The USDOT report does not shy away from the tensions.

Not infrequently an offered outcome can be both good and bad, depending on context or angle of observation. But good or bad, this report gives particular attention to three structural consequences: concentration, consolidation, and congestion. Moving enormous volumes in a cost-effective manner usually rewards those with a velocity advantage. Enhanced targeting and optimum speed tends to push developing economies of scale at particular places (hence concentration of flows). The investments needed to achieve economies of scale are usually easier to secure for those with more cash-flow, so the capital requirements to effectively manage concentration tends to result in greater consolidation of industry participants. Organizing and operating these planned bottlenecks usually maximizes volume and velocity — unless something “unexpected” (outside design parameters) disrupts flow or suddenly demand much more flow. Congestion is the predictable result. When the unexpected happens, well-planned bottlenecks can become extremely messy chokepoints.

The USDOT reports outlines several policy approaches and recommendations intended to reduce the likelihood and mitigate the consequences of congestion. In another concise summary of a much more complicated bill of particulars, the report notes, ” The pandemic and the supply chain challenges that have resulted from it are a reminder that “perfect storm” events can occur and cause enormous, sustained disruptions. America’s supply chains must be able to respond and adapt to future disruptions more quickly and flexibly. To ensure supply chains remain resilient in the future, the United States must invest in freight infrastructure, promote competition and fair markets, and enhance cooperation and information sharing across stakeholders, modes, and firms.”

Starting on page 49 of the report USDOT briefly details sixty-two policy steps either underway or recommended. There are five policy action staircases, sometimes merging in Escher-like confluences: 1) Infrastructure Investment, 2) Planning and Technical Assistance, 3) Research and Data, 4) Rules and Regulations, 5) Coordination and Partnerships. That last staircase is mostly federal interagency coordination and partnerships with states. Of the sixty-two recommendations, I perceive that six or seven involve conversation and collaboration with the private sector outside a regulatory context. I am sure lobbyists will insert themselves, but the public sector predilection is powerful.

Fours days after the White House released these supply chain reports the Biden administration announced potential legal and regulatory action focused on consolidation of ocean shipping (more and more). The announcement claims, “three global alliances, made up entirely of foreign companies, control almost all of ocean freight shipping, giving them power to raise prices for American businesses and consumers, while threatening our national security and economic competitiveness.”

Concentration can present serious problems for supply chain resilience and adaptation. Consolidation can be be both an effect of and contribution to concentration. In a high volume, high velocity demand and supply network, congestion will often be contagious. Once it starts, it tends to both accelerate and spread. Regulation may well be necessary to extract pernicious causes of concentration and related negative behaviors.

But if freight flows are part and parcel of a complex adaptive system, regulation will usually tend to lag outcomes. This will especially be the case when congestion is emerging from disaster or swift shifts in demand. In such contexts, to prevent congestion and mitigate concentration, a much more forward-learning strategy is voluntary collaboration among key players in the freight system. The public sector can often play a crucial convening and brokering role in fostering voluntary collaboration. According to Elinor Ostrom, empirical outcomes have demonstrated six prerequisites for resolving treacherous problems of over-use, congestion, and related:

  1. Communication is feasible with the full set of participants. When face-to-face communication is possible, participants use facial expressions, physical actions, and the way that words are expressed to judge the trustworthiness of the others involved.
  2. Reputations of participants are known. Knowing the past history of other participants, who may not be personally known prior to interaction, increases the likelihood of cooperation.
  3. High marginal per capita return (MPCR). When MPCR is high, each participant can know that their own contributions make a bigger difference than with low MPCR, and that others are more likely to recognize this relationship.
  4. Entry or exit capabilities. If participants can exit a situation at low cost, this gives them an opportunity not to be a sucker, and others can recognize that cooperators may leave (and enter other situations) if their cooperation is not reciprocated.
  5. Longer time horizon. Participants can anticipate that more could be earned through cooperation over a long time period versus a short time.
  6. Agreed-upon sanctioning capabilities. While external sanctions or imposed sanctioning systems may reduce cooperation, when participants themselves agree to a sanctioning system they frequently do not need to use sanctions at a high volume, and net benefits can be improved substantially.

The USDOT report accurately diagnoses a complex dynamic of pull and push freight flows. It then prescribes a rather narrow set of interventions. It is analogous to an ecological analysis of a big river’s rich watershed being followed by engineering recommendations for a certain set of flood protection districts. The recommendations are not wrong, but the problem to be solved — the opportunity to be engaged — is of very different proportions.

Public Health Supply Chain Resilience

This is the third post in a series examining the supply chain resilience reports released by the White House on Thursday, February 24.

The Department of Health and Human Services report released last week is in many ways an update on the July 2021 National Strategy for a Resilient Public Health Supply Chain. That strategy document sets out three goals:

Goal 1: Build a diverse, agile public health supply chain and sustain long-term U.S. manufacturing capability for future pandemics;

Goal 2: Transform the U.S. Government’s ability to monitor and manage the public health supply chain through stockpiles, visibility, and engagement; and,

Goal 3: Establish standards, systems, and governance to manage the supply chain and ensure fair, equitable, and effective allocation of scarce resources.

While the food supply chain is a high volume, high velocity network that in a crisis needs to adapt preexisting flows to new conditions, the public health supply chain is conceived as a system to urgently surge supplies that were not flowing strong or fast before the emergency. Thus conceived, the National Strategy and the “One Year Report” prompted by Executive Order 14017 do a good job of engaging the problem set.

For most commercial supply chain professionals, the need to allocate is a sure sign of failure. Supply chain thinking, plans, and execution work hard to avoid allocations. But in the public health context allocation priorities and processes are fundamental. Demand can suddenly surge multiples more than preexisting capacities and flows. There is a draft national framework for allocation of constrained public health resources currently being circulated. Given the potentially catastrophic and specifically unpredictable character of public health risks, anticipating the need for surge and allocation is pragmatic strategic realism.

The National Strategy and related policies and plans give particular attention to structural issues, “such as the lack of on- or near-shore manufacturing and sourcing for raw materials and finished medical products.” Last week’s report accurately notes, “improvements in domestic manufacturing must occur across the entire supply chain; the companies involved want to know there will be enough demand now and in the future to sustain these expansions.” The highly variable demand for personal protective equipment (PPE) and medical counter measures MCM), including testing and diagnostics, vaccines and other pharmaceuticals, and more, set up challenges that, in my judgment, are quite different from the priorities of most commercial supply chains.

Supply chains, worth the designation, organize around organic, broad based effectual demand. This is distinct from need. Effectual demand is the recurring pull of something the supplier finds motivating. This demand may be seasonal or contingent or otherwise variable, but it recurs with sufficient regularity, scope, and scale to justify incurring costs and undertaking other risks involved in creating and managing capacity to push when a pull signal is received.

Early in the pandemic the federal government facilitated the development of voluntary agreements under Section 708 of the Defense Production Act (more) to address the manufacture and distribution of critical healthcare resources. This process continues to operate. The National Strategy anticipates “that the DPA 708 engagements will transition from the Federal Emergency Management Agency (FEMA) to HHS and be co-administered by ASPR and FDA. The Section 708 process provides a conduit to engage across the entire supply chain, enabling the U.S. Government and industry stakeholders who volunteer to participate to share information, build a common operating picture, perform analysis, and solve problem sets necessary to ensure a resilient domestic public health industrial base.”

The absence of effectual demand for sufficient flows of public health goods persists, but the DPA provides a potentially powerful public-private process for working through the risks of insufficient effectual demand.

There is another demand-oriented aspect of the public health supply chain that is not engaged by the One Year Report or National Strategy for a Resilient Public Health Supply Chain. I expect there are public health efforts underway to address the issue, but they are not categorized as “supply chain” efforts. In November 2020 the Kaiser Family Foundation reviewed state and territorial plans for vaccine distribution. This review found:

Less than half (19 of 47, or 40%) of state plans reviewed include a numerical estimate of the number of individuals in different priority populations; the majority of states report they are still developing their data sources and methodology to calculate the number in their priority groups. A majority of states (25 of 47, or 53%) have at least one mention of incorporating racial and/or ethnic minorities or health equity considerations in their targeting of priority populations. Some states expect to make racial and ethnic minorities an explicit priority population group, while others report using more general or indirect methods to do so, such as through use of the social vulnerability index (as was recommended by the NAM) and/or a Health Equity Team or Framework.

There was — still is — a fundamental absence of demand-oriented planning and targeting for public health. This absence has complicated both non-pharmaceutical interventions and medical counter measures across the entire pandemic period (more and more and more ). Vaccine hesitancy predated this pandemic. Pseudo-scientific beliefs and practices are long-established. Non-scientific and anti-scientific attitudes are not new. For prevention, mitigation, and response purposes, public health supply chains need 1) a much more robust understanding of current whole-population “demand patterns”, 2) identification of strategic opportunities to influence these demand patterns, and 3) public health investments, professional development, and intervention programs to shape and manage demand for the public health supply chain. In many ways the public health profession already engages in this work through disease surveillance, population-based health care, and more. These existing competencies should be recognized as fundamental to public health supply chain strategies, plans, and operations.

In the late-Twentieth Century Walmart gradually displaced Sears by revolutionizing how supplies are procured, managed, and delivered. In more recent years Amazon (and others) are attempting to displace Walmart (and others) by a focus on fulfilling demand (sometimes creating demand) as much as moving supplies. Walmart is fighting back hard (and, so far, effectively) with its own demand-oriented strategies. The public health supply chain documents reflect late-20th Century thinking.

Especially when supply volumes are constrained, supply velocity can ensure maximum benefit of volumes available. Supply velocity requires a substantive understanding of current and emerging demand. Much more attention to the interdependencies of demand and supply will enhance strategic preparedness for public health challenges known to be heading our way, but we can’t quite predict what or when or where.

+++

March 7 Update: A report in today’s New York Times suggests how deciphering and delivering demand is fundamental to sustained and sufficient supply: Why American Mask Makers are Going Out of Business.

Food Supply Chain Resilience

The USDA report attempts to focus on several systemic vulnerabilities related to supply networks for food. Six priorities are identified for sustained attention, mostly through federal policy, regulation, and government investment: 1) Concentration and Consolidation in Agri-Food Production, Manufacturing, and Distribution, 2) Labor Needs, 3) Ecological and Climate Risks to Crops, 4) Livestock and Poultry Disease Threats, 5)Transportation Bottlenecks, and 6) Trade Disruptions.

While labeled a vulnerability analysis, I perceive at least three of the six priorities are oriented to rather specific threats… and potential bad actors are implied in all six. This threat-oriented perspective is even more prominent as each priority is analyzed and recommendations are offered.

There is modest attention to demand. To the extent demand factors are included in the analysis they are addressed as market distortions caused by the purchasing power of a few domestic processors, distributors, and retailers or any impediment to international agricultural sales. I am surprised by lack of attention to SNAP, WIC and other USDA program beneficiaries as sources of demand. Consumer behavior — especially new trends in food consumption — are not addressed.

This is a very upstream angle on food flows. For example, following is a quote from pages 14-15 of the 47 page report. Midstream and downstream structures and behaviors are assessed principally in terms of accommodating current upstream characteristics. Given this angle, the assessments outlined are valid. A wider angle of engagement — especially of nodes, channels, and functions between upstream and downstream — would unveil additional opportunities for achieving resilience.

Consolidation and concentration related vulnerabilities threatening specialty crops supply chains include:
• Erosion of traditional wholesalers toward direct marketing contracts between growers and retail chains due to increased centralization of food procurement systems.
• Increasing concentration in food retailing, especially among the largest grocery retailers.
• Consolidated distribution infrastructure in freight rail and ocean shipping, all of which are required consistently and timely due to the perishable nature of specialty crops.

There are also non-competition related factors in the specialty crops sector, particularly significant due to crop perishability and reliance on local growing conditions, that pose additional risks especially when paired with these consolidation and concentration issues. These factors include:
• Access to a workforce, which is typically seasonal in nature and shifts geographically over time.
• Climate change and the increased frequency of extreme weather events such as frosts in Florida and the recent mega-drought in the western U.S. pose significant threats, which are exacerbated when market players are concentrated or consolidated geographically or within a subsector…
[more examples are included]
• Market and trade shocks which may impose barriers on imports or reduce opportunities for exports, such as when countries impose trade restrictions in response to domestic food price inflation or enter into trade agreements that exclude the United States.

Every report like this has to choose its angle(s) (and exclude others). Within the aperture selected, I don’t disagree — and often enthusiastically agree — with the USDA report’s findings. The problems identified are real. Implementation of the report’s recommendations would mitigate several threats to the US food system.

This is not, however, an assessment of the US food system’s supply chain resilience.

The Executive Order that prompted this assessment includes, “The Secretary of Agriculture, in consultation with the heads of appropriate agencies, shall submit a report on supply chains for the production of agricultural commodities and food products.” [My italics.] This is what the report has done, this is the origin of the upstream angle. Given this point of origin and explicit target, it is possible to appreciate how much attention to midstream and downstream factors have been creatively included in the report.

Below is a visualization of the demand and supply network for food developed as part of “A Framework for Assessing Effects of the Food System” (National Academies of Sciences, 2015). In many ways the USDA report is, intentionally, limited to that green box labeled “Farm Production.” More is needed.

Demand for food is in considerable turmoil. Climate change is imposing significant structural shifts on global demand (and supply) for food. Consumer needs and expectations outside the United States have important implications for US agricultural production, processing, pricing, and more. The pandemic has accelerated dramatic shifts in US demand for food and, at least temporarily, reversed some important patterns of US food consumption. Upstream, midstream, and downstream players are competing, collaborating, and creating to adapt to these changes in demand. These adaptations are usually pragmatic, even opportunistic. Some enhance resilience. Some diminish resilience. The Department of Agriculture was not asked to consider these factors in this report.

There are other factors that need to be considered and strategically triaged, if we want to enhance the resilience of the US food system.

images