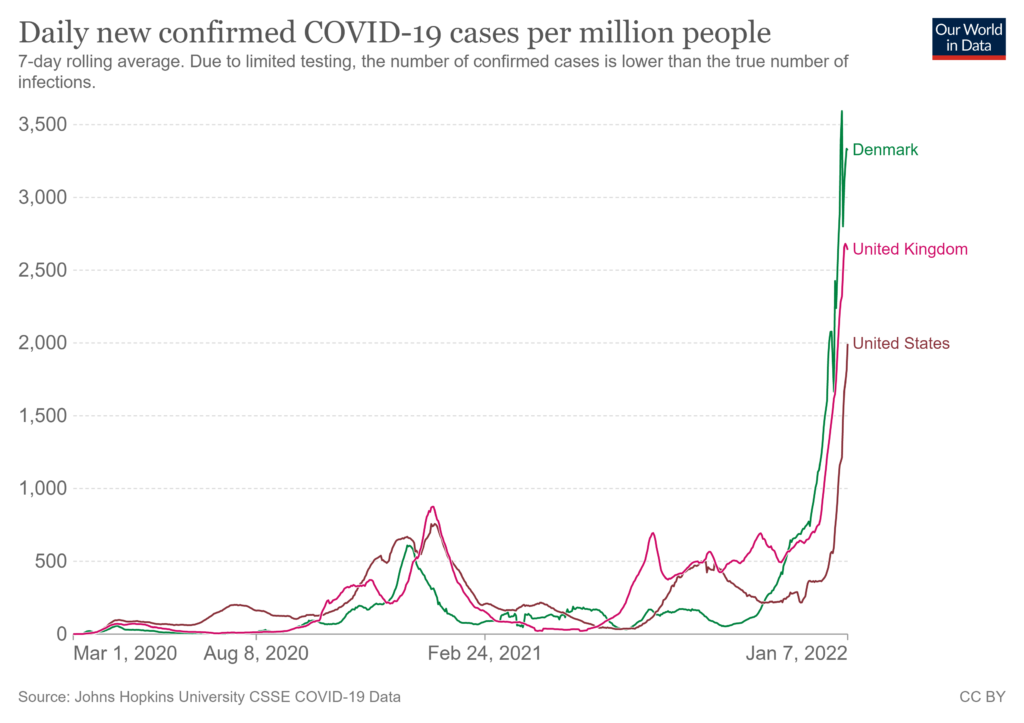
Covid cases are climbing faster than ever before (see first chart below). These are undercounts.
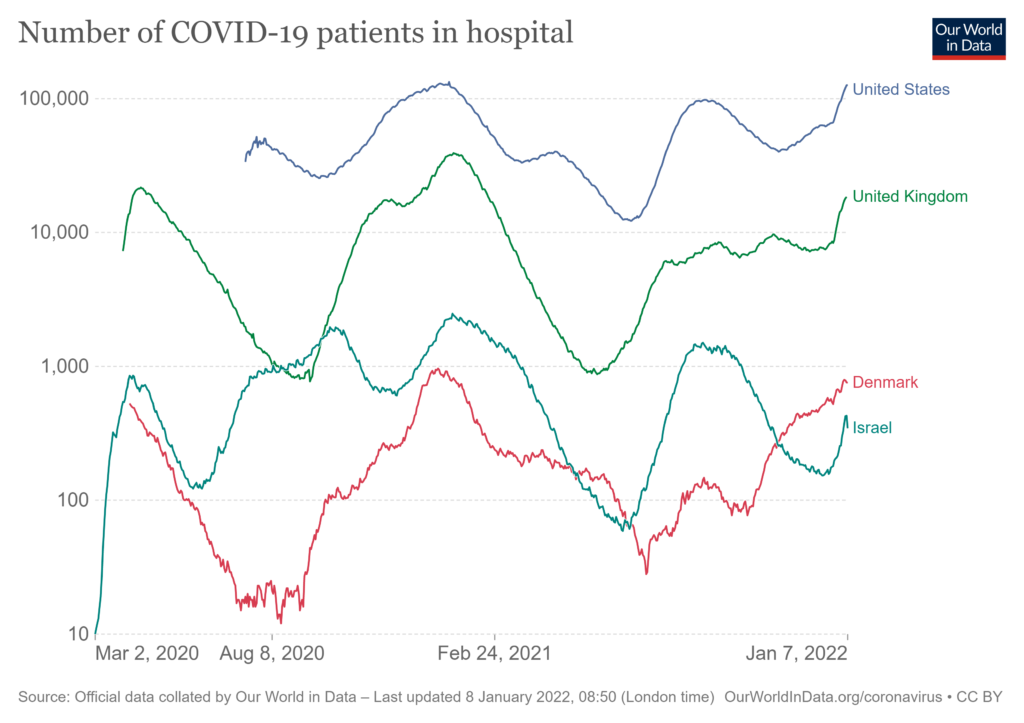
While omicron-related disease is on-average less severe, its rapid simultaneous spread is finding plenty of vulnerable victims, including unvaccinated children (more). Many hospitals are packed again. Already or very soon, the January 2021 peak for covid-related US hospitalizations will be superseded (see second chart and more). Credible projections anticipate US hospitalizations will continue to increase until mid-February.
Daily deaths are also expected to increase through mid-February. As a percentage of confirmed cases or hospitalizations, deaths are likely to be well below prior peaks. But given the exponential growth in case counts, the absolute number of dead per day could close-in on the worst days of 2020.
Hospital staff, EMS professionals, food processors, flight crews, TSA screeners, and many others are calling in sick. Many more would test positive for covid, if they could find a test and were inclined to test. On January 6 Bloomberg reported, “The highly contagious omicron virus variant is disrupting already stressed food supply chains, sickening so many workers that more shortages at grocery stores are all but certain.”
Many supply chains are already constrained by a wide range of workforce dynamics (not always directly related to covid). January and February weather often complicates supply velocity in much of North America. Add a highly contagious variant into this wintry mix (and any related consumer stockpiling) and the “feels like” function for supply chains can quickly slip toward freezing. As is more widely understood today than before, high volume, high velocity demand and supply networks can be as efficient at distributing problems as products. Once bottlenecks, chokepoints, and gridlocks form, decongesting can be complicated and delayed.
On Thursday, Louisiana’s State Health Officer and Medical Director was quoted as saying, “When you’re in a surge like we are right now and Covid is everywhere — and it is everywhere right now — if you have trouble getting a test, a take-home test particularly, and you do have symptoms, the prudent thing to do is just assume you have Covid and isolate away from other people. That’s the safest thing to do right now.” This is the personal care worldview that I would want my own physician to reflect. From a supply chain perspective, I appreciate the Medical Director’s focus on people with symptoms. This is consistent with recent CDC recommendations.
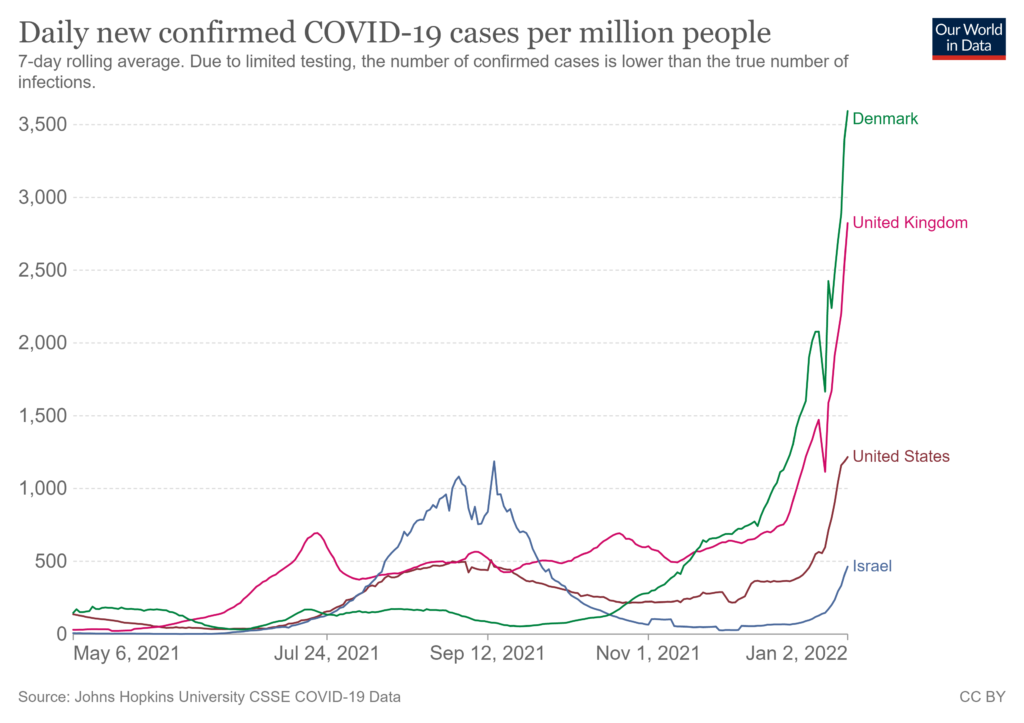
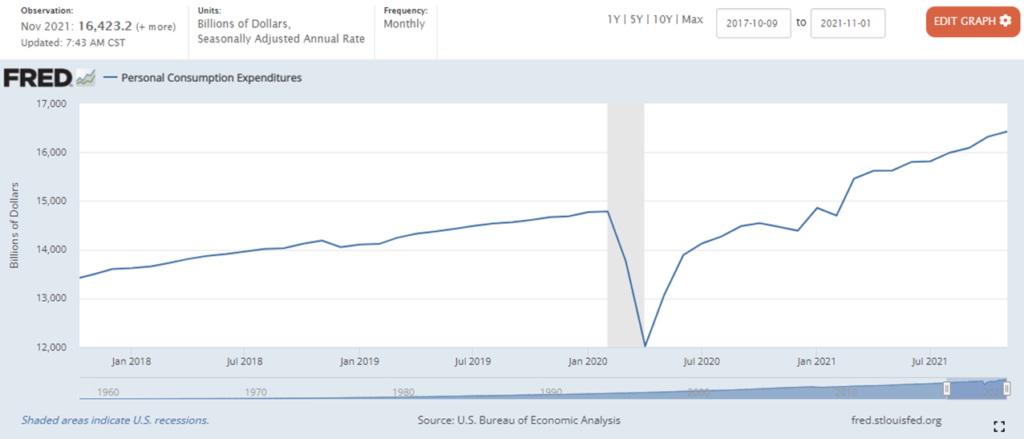
But if the current exponential growth in cases continues for another 10 days or more, we will need tens-of-thousands of workers with mild symptoms to stay on the job to maintain flows of water, food, fuel, pharmaceuticals, and other critical freight on which millions depend (related). Which symptoms, how mild, with what mitigation measures? It is not too soon, actually its getting very late, to consider this treacherous possibility. Probability? The demand slopes below are not encouraging.