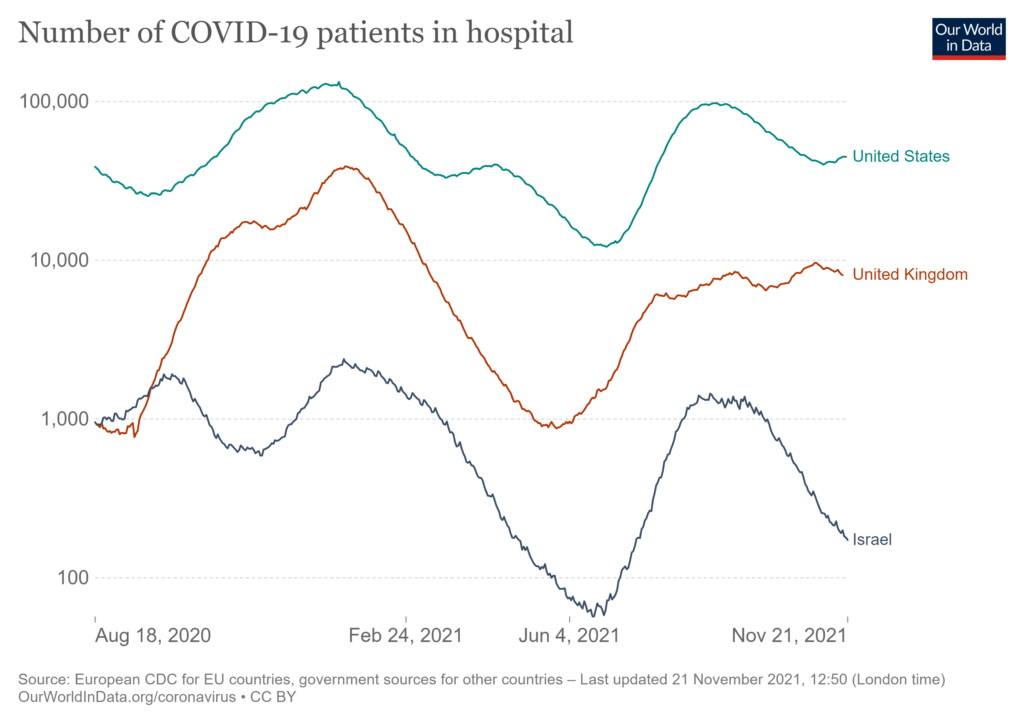
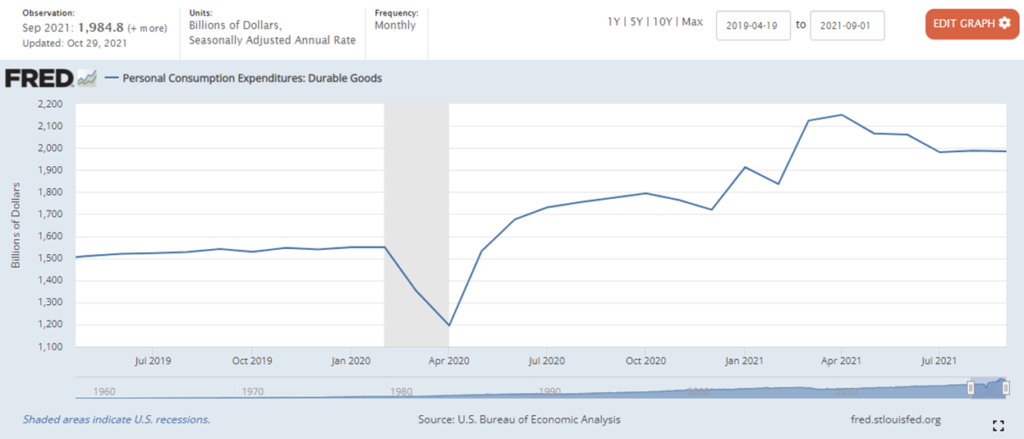
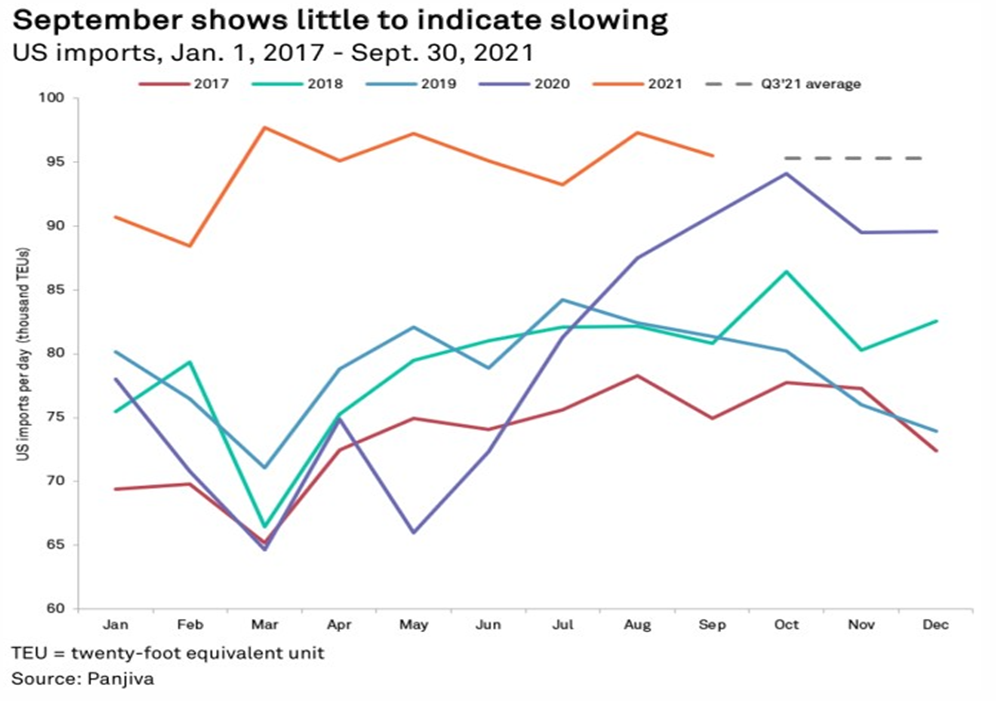
Category: Uncategorized

Stubborn demand for hospitalization

In many places (where I live, for example) covid-related hospitalizations are declining. But this is not the case everywhere and big picture trends are concerning. Patterns outlined last week have persisted.

While the US demand curve has declined from peak-Delta, it has remained quite high and in some places is beginning to once-again bend upward. Please see the chart below for results as of November 12 for seven nations.

This last week Germany confirmed more new covid infections than ever before (more). Resurgent numbers in Italy have prompted discussion of another Christmas slow-down or shutdown (and not just in Italy). The Netherlands is slowing-down now in an effort to head-off a sharper stop later.

The persistent plateau (see below) in the UK seems to be easing, but the churn across the channel is concerning. In the United States it very much depends where you live and what you and your neighbors have decided about vaccinations. Counties in New Mexico and Colorado with low vaccination rates are the current hotspots. But even in highly vaccinated Vermont, Halloween parties are allegedly to blame for an outbreak at St. Michael’s College.

About three weeks ago I advised that, despite improving trends, there was still good cause to minimize travel, avoid interior crowds, and cover our nose and mouth when we cannot avoid sharing interior crowds. For the record, I just spent most of a week in Dallas, where I met inside with many others, and very seldom wore a mask in those rooms. I understand everyone was vaccinated, the room was well-ventilated, and it was not really crowded. But we were certainly not always six feet apart. Only two or three consistently wore masks. Good for them. I am a risk-aware hypocrite. There are too many of us and too few of them.

As noted, demand management is not yet done

The World Health Organization has warned, “Europe is back at the epicenter of the pandemic.” (More)

Germany appears to have a fourth wave starting.

Despite widespread vaccinations, British hospitalizations have remained persistently high. The Guardian editorializes, “Mandatory masking on public transport and in places such as supermarkets should never have been dropped in England and must be readopted: it is a minor inconvenience with major dividends.”

China strikes many as over-reacting, but the increased case-counts are real enough.

The situation in Russia is very tough. Vaccinations have lagged. Non-pharmaceutical mitigation is uneven. Hospitals are filling and deaths are spiking.

For several months, I have been tracking US, UK, and Israel covid hospitalizations. Following is a display of a logarithmic demand curve for hospitalizations in these three nations, now plus Canada, France, Italy, and Spain. These data are reasonably accurate. I don’t have confidence in public data from China and Russia. I can’t — yet — find directly comparable data on hospitalizations in Germany.

The supposed crisis in 550 words (and lots of links)

In the week prior to Halloween (before Amazon with Apple dramatically highlighted supply chain constraints), Tom Keene on Bloomberg Surveillance offered the best concise summary of supply chain realities that I have heard. He said, “It’s microeconomics and there’s ambiguity and there’s give-and-take and, frankly, there is an unknown and we are learning as we go in a natural disaster.”  (Please see below, start listening at about the 59:52 mark.)

Over the last several months I have written many more words. But TK seemed to spontaneously summarize what really matters.

Still, many want more detail than Mr. Keene provided, but more clearly and concisely than is typical of my method. So, as some of you have requested, here’s one more try.

Early in the pandemic US consumer demand fell hard and fast by about one-fifth. Then between May 2020 and about March 2021 overall consumption recovered. Since this March overall demand has increased by another half-trillion dollars per month.  This demand is usually being fulfilled.

But where consumers once purchased lots of services — like travel, entertainment, and eating out — over the last 18 months consumers have focused on a lot more stuff, even twice as much stuff (more).

Producing and delivering this much extra stuff this quickly would have complicated and congested flows in the best of all possible worlds.  But trying to supply this surge and shift during a pandemic has been extra tough.  Constraints on time and space intended to mitigate disease transmission have reduced production and distribution capacity. Disease penetration has been even more disruptive. Shifting upstream capacities created proliferating and unpredicted downstream gyrations 

Persisting supply chain friction has amplified human fatigue and frustration (and even fear) that has further constrained system capacity (e.g., workforce retirements, resignations, reimagining careers, non-participation, and more). Friday Amazon’s CFO explained, “For the foreseeable future, our capacity constraint is actually labor, which is new and not welcome.”

Supply chain constraints are promiscuous and breed additional constraints. Efforts to mitigate this proliferation of constraints (e.g. port congestion) have been complicated by issues of distance between supply and demand and over-concentration of channels (e.g. ocean shipping and port capacity).

These aggregated frictions (and complex feedback signals) are now constraining some fundamental flows, from food to fancy high-tech phones. Which products or categories are most at risk at this point seems to me more and more a betting proposition than anything else. Chop and wind in every channel are sufficient to threaten just about everything on offer. It is a mess. As previously outlined, I do not perceive the mess as an existential threat (except to some smaller retailers). But it is certainly an equal opportunity mess with the potential to seriously complicate economic outcomes for an extended period.

As consumers have less cash to spend and the proportion spent on services increases, overall pull is very slowly beginning to even out (more). Over-time (probably by March-April 2022, barring a more insidious virus or similar) this will result in noticeably improved equilibrium of demand and supply.  If and when volatility returns to something closer to pre-pandemic patterns is another Vegas bet.

This increasingly frustrating experience reveals the dangers associated with over-concentration of supply networks, especially when amplified by distance, and the current lack of effective structures for the exploration and exploitation of enlightened self-interest in managing the global ecosystem of demand and supply.

Demand management is not yet done

My supply chain — or better: demand and supply network — angle on the pandemic emphasizes the need to effectively manage demand for hospitalization. From a network perspective, supply of hospital care is the bottleneck that most often requires mindful exploiting (ala Goldratt). When hospitals are overwhelmed the network experiences more disease and death. When demand for hospital care remains within supply capacity, disease and death can be systematically mitigated across populations.

Hospital congestion is bad. Hospital flow is good. Local to regional demand is the flow factor most readily influenced. As is often the case, supply capacity is finite. Available medical staff is often the acute rate-limiting factor for hospital care.

Most people infected with covid-19 have not needed hospitalization or even much medical care. But a significant fraction of those infected have experienced severe illness (here and here and please see this caveat). The elderly, those with preexisting respiratory conditions, and the immuno-compromised are especially likely to require hospitalization. There have also been mysteriously deadly cases involving the young and seemingly healthy.

Vaccination, avoiding crowded interior spaces, social distancing, reduced circulation, and facial coverings are demand management techniques for slowing and containing transmission vectors across populations. The “consumer” often perceives these as self-protecting behaviors. But from a flow perspective, these are other-protecting measures, even network-protecting measures. Being vaccinated makes it much less likely that a person will transmit the virus to others. Encounters between vaccinated persons are much less likely to give the virus a mutation opportunity. Less transmission and less mutation equals less demand for hospitalization.

I have been tracking hospitalization rates in Israel, United Kingdom, and the United States. Obviously, these are three very different contexts. But each nation was early to make vaccines available and vaccination was well-along before or early-in the spread of the Delta Variant. Data quality on hospitalization can be a problem, but Israel’s small and sophisticated healthcare network may have the best data-integrity in the world. The British National Health Service is also data-savvy. The fractured US healthcare system creates plenty of data challenges, but overtime more accurate, real-time outcomes are being reported.

On October 19 Israel had at least 540 people hospitalized with covid, the UK (mostly England) had about 7000, and the United States had almost 52,000 people hospitalized with confirmed cases of covid. While the raw numbers are hard to compare, I find the logarithmic display (as below) — showing the rate of change — to offer something close to comparable demand curves for hospitalization. All three are doing better than late July or early August. But the numbers remain much higher than had been hoped when vaccination campaigns began. The UK’s persisting plateau is of particular concern.

According to The Financial Times (October 15):

The UK’s weekly death rate stands at 12 per million, three times the level of other major European nations, while hospitalisations have risen to eight Covid-related admissions a week per 100,000 people, six times the rate on the continent. The decision to end compulsory mask-wearing and to pause plans for vaccine passports in England has made the British government an outlier for its management of the pandemic and could account for the worsening trends, according to scientific experts. (More)

According to Reuters, “Four months into one of its worst COVID-19 outbreaks, Israel is seeing a sharp drop in new infections and severe illness, aided by its use of vaccine boostersvaccine passports and mask mandates, scientists and health officials said.

On October 18 the FT also reported:

Scientists are anxiously tracking a descendant of the Delta coronavirus, which is responsible for a growing proportion of Covid-19 cases in the UK, and could be more infectious than the original Delta variant, they say. This AY.4.2 subvariant has only recently been recognised by virologists who follow the genetic evolution of Delta but it already accounts for almost 10 per cent of UK cases. Its prevalence is increasing rapidly, though not as fast as the original Delta variant when it reached Britain from India early this year. (More and more and more.)

Israel has just confirmed its first case of AY.4.2. So far six have been confirmed in the United States. Waaay too soon to raise any alarms.

Quite the contrary, I will confess that my attitude toward covid has shifted in the last two or three weeks. I want to acknowledge that a combination of vaccination and natural immunity — assisted by modest behavioral adjustments — could reduce US viral risks to something akin to automobile injury and death (even less for vaccinated persons). Covid and car wrecks could even compete over bad luck and bad behavior as co-conspirators. (More)

But while my attitude is shifting, my considered judgment is not yet persuaded. It is waaay too soon to decide the next mutation (or two) will not be worse than Delta. As the contrasting accounts of Israel and the UK suggest, it is also waaay too soon to put aside behavioral cautions. Credible data does not (yet) signal anything more than continued uncertainty. So… if you can, get vaccinated if you are not; if you have been vaccinated, prepare to get your booster; avoid interior crowds; give other folks plenty of space; minimize travel; and cover your nose and mouth when you cannot avoid sharing interior spaces. When for practical or social reasons you cannot take all of these network-protecting, other-protecting steps, please do what you can whenever you can.

The Burdens of Abundance

Here are just a few of a recent flood of related headlines:

Port Gridlock Stretches Supply Lines Thin (Bloomberg)

America is Running Out of Everything (The Atlantic)

Global Supply Chain Problems Escalate (Wall Street Journal)

The Supply Chain Crisis and US Ports (The Financial Times)

The Global Supply Chain Nightmare is about to get Worse (CNN)

America’s Broken Supply Chain (Washington Post)

Grocery’s Biggest Players Seek to Reassure on Holiday Supply Chains (Grocery Business)

Despite the intense attention, none of this is new. Supply chain friction has been accumulating for many months — as well reported by each of the news organizations linked above. But the prospect of Santa’s supply chain failing for this Christmas has evidently become a source of civilizational angst. Accordingly last week the White House gave supply chains some sustained attention (and here and here).

Beyond this year’s fads (whether for children or not), what is really happening with our demand and supply networks?

On October 15 the US government reported August sales of $1.68 trillion (“the combined value of distributive trade sales and manufacturers’ shipments”), compared to 2020 August sales of $1.44 trillion and 2019 August sales of $1.50 trillion. Despite this strong spending, the US savings rate remains above nine percent, almost two percent higher than decade-long averages. US demand is strong and has the potential to stay strong for several more months.

Every product category tracked for the broadest sales indicator shows increases from August 2020, especially for food and beverages. The pandemic prompted significant growth in 2020 grocery sales. Just a bit above $72.5 billion in food and beverage sales for August of last year was more than $5 billion better than 2019. August 2021 sales beat 2020 by another $4 billion (now helped by expanding restaurant sales). There are currently spot stock-outs of some grocery items. Given the context, that should not surprise.

Stock-outs are, at least in my mind, different than shortages. We are producing and importing more than ever before. American (and other) consumers apparently want even more. Inventories are often lean or even anorexic. But is it more helpful to say supply is short or demand is strong? There is a disequilibrium of supply and demand. What helps us better perceive and potentially deal with the causes?

The delayed discharge of containers at the Ports of Los Angeles and Long Beach has received generous attention. There are dramatically obvious problems with dock density, operating hours, and overall port congestion. Still… in 2018 the Port of Los Angeles moved a record-breaking 9.45 million containers. In 2019, with trade-tensions constraining flow, this dropped to 9.33 million containers. The 2020 pandemic contributed to a further drop to 9.21 million containers (mostly due to loss of flow in February to May). Through August 2021, the port has moved 7.27 million containers — thirty percent more than by August 2020. The port of LA looks very likely to break its 2018 container record.

More broadly — and for better or worse — the United States is well on its way to importing more volume in 2021 than ever before. According to S&P Global:

Imports to the U.S. by volume grew 5.1% year over year in September, continuing the logistics surge that has caused congestion in ports across the country. This was slower than in previous months but 17.4% higher than September 2019. The comparison with 2020 is now exceptional for a different reason — this time, it is against a post-pandemic surge rather than lockdown-related lows. September also brings the growth rate for the third quarter to 10.2% year over year, or 15.3% compared with the third quarter of 2019. There was an average of 95,341 twenty-foot equivalent units per day in the third quarter. If imports remain at this level, the fourth quarter is expected to show a growth rate of 4.7% year over year, exceeding the record-breaking 2020 holiday season.

Demand is, well… demanding. To fulfill this demand, many flows moving toward demand have increased one-fifth to one-third above pre-pandemic baselines. This sudden and substantial increase creates problems. The number of docks with cranes has not increased nor has the number of trucks. Even comparatively rapid expansion of warehouse square footage has not increased as much as demand. There are also challenges hiring truckers and warehouse workers and many others on which efficient flows depend. But flow volume is still higher, not lower than 2019.

While demand is pulling hard and flow is pushing hard, what about upstream production capacity? As with flow, unusually swift shifts in demand have created several problems. The sudden slow-down in demand for older-version automotive semiconductors in the first half of 2020 has complicated serving increased demand ever since. The increased demand for cutting edge semiconductors in a wide array of high-performance electronic tools and gadgets has been tough to fulfill. There are other examples. There are serious constraints to growth in specific product categories.

But overall manufacturing production has soared in response to strong demand. In August 2021 (in the midst of the Delta variant’s worst effects) 18 of the G20 nations had increased manufacturing production over the same month in 2020. US manufacturing production remains above where it has been most of this century (see related chart below). There are forward going concerns about cost and availability of energy, especially in Europe and China. Disease penetration and/or disease mitigation measures have reduced productivity in some cases (examples here and here and here). Unreliable flow velocity can upset production calendars, even when sufficient volumes are available. In a system-of-systems distress in one place can complicate every place.

Nonetheless, unusually high demand is usually being fulfilled. Demand has effectively pulled more manufacturing forward. More manufactured products are being pushed toward demand. Preexisting capacity — for both production and movement — is not infinitely flexible. But in many cases, more than one-fifth more is being made and moved than in late 2019. In some cases, additional capacity is being developed.

Deficit and disequilibrium are different. Today’s most challenging supply chain problems are caused by many millions of consumers wanting more than ever before. Abundant demand has generated a flood of supply. This flood has overwhelmed some factory floors, ports, and preexisting freight capacity. A flood creates problems, but it should not be confused with drought.

China Manufacturing Production

Coda (October 20)

Derek Thompson concludes America is Running Out of Everything with, “The best solution to the Everything Shortage is to have a policy to make more of just about everything.” Given human desire and capitalist culture, his prescription is well-matched to context. But another possible angle is to want — or at least consume — less.  This too would facilitate enhanced equilibrium of supply with demand… and could even craft a more sustainable give and take between the personal and planetary.

More evidence of non-durable demand

Here’s the final paragraph in a September 27 WSJ report: “Year to date, new orders for durable goods are up 24.7% compared with the same period a year earlier. Shipments, meanwhile, are up just 14.1%.” Buried lede? It is for me.

Here’s the source report from the Census Bureau. Demand is up one-quarter. Supply is up about one-seventh.

Despite all the raw material, production, packaging, shipping, workforce, and other complications, total durable goods shipments are up more than 14 percent year-over-year. Remove the transportation category and orders are up a bit less than 18 percent and shipments are still up about 14 percent

The semiconductor shortage has seriously undermined the ability of automobile manufacturers to flex capacity to meet demand. But in most other categories — even with all the friction widely noted — shipments are within spitting difference of orders. In some cases demand and supply can be seen kissing: During August the computer and other electric products category shipped goods worth $208 billion against new orders worth $177 billion. Product offerings and inventories are being rebuilt.

Enough for this holiday-season? Perhaps not. But existing capacity is being well-deployed.

Will the recent demand surge for durable goods endure? I don’t think so. Exploiting current bottlenecks to maximize existing capacity makes enormous sense. Investing in huge, quick, expensive capacity expansion makes much less sense… for many, even most, categories.

Oxford Economics has released a very helpful supply chain stress indicator. According to their September 22 report:

With our tracker showing stress still rising, supply-chain headwinds look unlikely to ease in the near term. But we see a light at the end of the tunnel – current challenges will not be indefinite. As vaccination rates rise in the US and overseas and demand slowly returns to pre-pandemic patterns, transportation logjams will clear, input costs will normalize, and production and hiring challenges will recede. In other words, easing supply-side constraints, rising capital investment, and demand normalizing to pre-pandemic patterns will allow firms to clear the significant backlog of orders that have built up in the past 18 months.

How long this will take depends on the category — and the character of demand waiting at the end of that tunnel.

Facilitating Flow

Some of our problems begin with the label: supply chain. Chains are linked, which is helpful. But chains do not flow, rather they tend to tangle. For too many, mental images spawned by the term (supply chain) reinforce perceptions of linear links connecting origins with destinations. Replace weak links or untangle twisted links and problems are solved. It has not been that simple for at least a half-century (maybe never).

Wider understanding of demand and supply networks is also obscured by the wonderful work of Walmart, FedEx, UPS, Amazon and others in eliminating consumer-facing friction and related costs. Until recently it seemed so simple to track a package (often delivered with “free” shipping). If possible for a pair of shoes or books or dog food, why not several million computer chips?

Why can’t the Secretary of Commerce pull up on her smartphone (or at least on her secure laptop), a General Motors batch order of semiconductors and immediately see which fabrication plant or port or warehouse or cargo-carrier is causing the delay? As Secretary Raimondo explained on Friday, all she wants to do is solve the problem.

Demand and supply networks are not so simple. Network behaviors are especially susceptible to misaligned angles of perception. According to the economist Richard Sugden,

Most modern economic theory describes a world presided over by a government (not, significantly, by governments), and sees this world through the government’s eyes. The government is supposed to have the responsibility, the will and the power to restructure society in whatever way maximizes social welfare; like the US Cavalry in a good Western, the government stands ready to rush to the rescue whenever the market ‘fails’, and the economist’s job is to advise it on when and how to do so. Private individuals, in contrast, are credited with little or no ability to solve collective problems among themselves. This makes for a distorted view of some important economic and political issues.

Behind the clean lines of our tracking interfaces is a wickedly complex socio-technical system constantly pushing and pulling to calibrate high volume demand with right-velocity supply. Information is analyzed and financial transactions are dissected to move the most “units” at least cost to arrive at the right place at the right time to motivate more buying. Upstream from every very busy Fulfillment Center is a boiling, thrashing flood of flows cascading across space and time toward the wants and needs of 8 billion humans and all our related creatures and creations. The day-to-day creators and managers of this flood and flow are mostly “private individuals.”

High volume, high velocity demand and supply networks (and some low velocity too) are complex adaptive systems where a large number of independent, heterogeneous and (often) competitive agents interact dynamically (sometimes collaboratively) to shape flows and outcomes across the entire system through self-organization and self-similarity at multiple scales. Individual agents and the whole-system demonstrate adaptive behaviors that result in the emergence of functions and outcomes that transcend the capabilities of any individual agent or sub-system.

In my judgment this process of emergence has now created a global commons of demand and supply where the networks of information exchange, financial transaction, and physical movement are Common Pool Resources benefiting the vast majority of “supply chain” participants in most places most of the time.

In 2009 Elinor Ostrom, a great scholar of Common Pool Resources, was awarded the Nobel Prize for Economics. In her Prize Lecture, Ostrom highlights six recurring characteristics of effective problem-solving among stakeholders dealing with both public-goods and common pool resource challenges:

  1. Communication is feasible with the full set of participants. When face-to-face communication is possible, participants use facial expressions, physical actions, and the way that words are expressed to judge the trustworthiness of the others involved.
  2. Reputations of participants are known. Knowing the past history of other participants, who may not be personally known prior to interaction, increases the likelihood of cooperation.
  3. High marginal per capita return (MPCR). When MPCR is high, each participant can know that their own contributions make a bigger difference than with low MPCR and that others are more likely to recognize this relationship.
  4. Entry or exit capabilities. If participants can exit a situation at low cost, this gives them an opportunity not to be a sucker and others can recognize that cooperators may leave (and enter other situations) if their cooperation is not reciprocated.
  5. Longer time horizon. Participants can anticipate that more could be earned through cooperation over a long time period versus a short time.
  6. Agreed-upon sanctioning capabilities. While external sanctions or imposed sanctioning systems may reduce cooperation, when participants themselves agree to a sanctioning system they frequently do not need to use sanctions at a high volume and net benefits can be improved substantially.

Again and again, these are behaviors that supply chain stakeholders experience and demonstrate. As with most complex adaptive systems these behaviors are duplicated across very different scales of time and space: immediate and local to durable and global. These interactions are most often entirely private-private, occasionally facilitated by civic organizations such as associations or academic institutions. Governments can play a role, especially in convening and facilitating. But self-restraint is especially difficult for public sector players when crises unfold. Secretary Raimondo’s sense of urgency is not inappropriate. It is uncertain of best targets. It may also underestimate solution-paths already underway. (But the read-out of last week’s semiconductor consultation and a few quick conversations with participants suggests reality is not yet rejected and may even be, reluctantly, increasingly accepted.)

Current production capacity almost always reflects recent demand velocities. Sudden spikes in demand velocity are usually observed with considerable skepticism. Production capacity — especially for something as sophisticated as semiconductors — does not come cheap. No one wants to over-invest in a passing fad or soon-to-disappear legacy. But sustained effectual demand is an effective motivator.

The pandemic’s Great Interruption continues to disrupt current supply capacity for semiconductors even as it accelerates and diversifies demand. It has been clear for nearly one year that much of this demand is durable and worth accelerated investment in capacity expansion. These investments are being made (here and here and here and here). Will new supply sources close the gap by this Christmas? No. By New Years Day 2023? Maybe. Are there ways that current capacity could be further streamlined, rationalized, prioritized — something — to reduce the current gap? Yes. Many efforts are already underway.

Is there a helpful role for the public sector? Yes. But probably not by attempting a forensic analysis of a complex adaptive system and then developing an intervention strategy (please see Sugden supra). Flow mapping is something very different. Government fiscal and monetary policies have already amplified aspects of demand surge. These interventions are softening, so public sector help has already started. State and federal policies can probably nudge a bit more onshoring of production capacity. I don’t see many wise opportunities for expediting expansion of production capacity. Unwise opportunities are always available, but marginal or unlikely rewards do not justify certain significant risks.

If undertaken with skill, insight, and appropriate restraint, the public sector can play an important role convening and facilitating the six characteristics of effective problem-solving that Ostrom has highlighted. There is a rich literature of many more rigorously researched and confirmed attributes of stakeholder problem-solving. I wish Dr. Ostrom was still with us to advise. But there is plenty of expertise available, if asked.

Toward the close of her Nobel Prize lecture, Dr. Ostrom sets out an action orientation and a series of fundamental questions:

humans have a more complex motivational structure and more capability to solve social dilemmas than posited in earlier rational-choice theory. Designing institutions to force (or nudge) entirely self-interested individuals to achieve better outcomes has been the major goal posited by policy analysts for governments to accomplish for much of the past half century. Extensive empirical research leads me to argue that instead, a core goal of public policy should be to facilitate the development of institutions that bring out the best in humans. We need to ask how diverse polycentric institutions help or hinder the innovativeness, learning, adapting, trustworthiness, levels of cooperation of participants, and the achievement of more effective, equitable, and sustainable outcomes at multiple scales.

The set of questions recently posed by the Department of Commerce implies that many supply chain stakeholders must be idiots or are too greedy or short-sighted or functionally incompetent or… something needing government guidance — to make choices consistent with their long-term self-interest and the public good. The questions imply that if the government receives honest answers, the government will be able to craft a rational solution. At least to me this reveals a Newtonian confidence poorly calibrated to a much more Quantum context. Continued private-private and private-public conversations can be very constructive. Please trash the hubris.

Seeking Transparency

Yesterday — Friday, September 24 — the Department of Commerce published a Request for Public Comments in the Federal Register. This RPC (sometimes RFI) is focused on providing the government with information that might assist in efforts to mitigate the persisting disequilibrium of demand and supply for semiconductor chips. According to the RPC:

With the goal of accelerating information flow across the various segments of the supply chain, identifying data gaps and bottlenecks in the supply chain, and potential inconsistent demand signals, the Department is seeking responses from interested parties (including domestic and foreign semiconductor design firms, semiconductor manufacturers, materials and equipment suppliers, as well as semiconductor intermediate and end-users) to the questions set forth in this notice.

This request was reinforced with comments by senior White House staff and Secretary of Commerce, Gina Raimondo. According to a White House blog post:

The federal government must be better equipped to get ahead of possible disruptions and have tools at its disposal to limit their impact on the U.S. economy, workers, and consumers. When supply chain shocks cascade, the spillover effects can impact the global economy in ways that no one firm or sector can anticipate or adequately resolve on their own. By taking a holistic view of the industrial base and supply chains critical to US economic and national security, the federal government can monitor, anticipate, and respond to economic, geopolitical, and climate-related shocks.

Secretary Raimondo was pointed in her call for greater transparency:

What’s still not clear is what specifically is happening. For example, I don’t know who is overordering or who is not supplying at the levels expected. Frankly, I’m not interested in pointing fingers. I’m interested in solving the problem. There’s so little transparency across the board. And that can’t continue.

The Federal Register asks specific and detailed questions.

The Department is specifically seeking the following information and data:

1. For semiconductor product design, front and back-end manufacturers and microelectronics assemblers, and their suppliers and distributors:

a. Identify your company’s role in the semiconductor product supply chain.

b. Indicate the technology nodes (in nanometers), semiconductor material types, and device types that this organization is capable of providing (design and/or manufacture).

c. For any integrated circuits you produce—whether fabricated at your own facilities or elsewhere—identify the primary integrated circuit type, product type, relevant technology nodes (in nanometers), and actuals or estimates of annual sales for the years 2019, 2020, and 2021 based on anticipated end use.

d. For the semiconductor products that your organization sells, identify those with the largest order backlog. Then for the total and for each product, identify the product attributes, sales in the past month, and location of fabrication and package/assembly.

i. List each product’s top three current customers and the estimated percentage of that product’s sales accounted for by each customer.

e. For each phase of the production process, identify whether your organization carries out the step internally or externally. For your organization’s top semiconductor products, estimate each product’s (a) 2019 lead time and (b) current lead time (in days), both overall and for each phase of the production process. Provide an explanation of any current delays or bottlenecks.

f. For your organization’s top semiconductor products, list each product’s typical and current inventory (in days), for finished product, in-progress product, and inbound product. Provide an explanation for any changes in inventory practices.

g. What are the primary disruptions or bottlenecks that have affected your ability to provide products to customers in the last year?

h. What is your organization’s book-to-bill ratio for the past three years? Explain any changes.

i. If the demand for your products exceeds your capacity, what is the primary method by which your organization allocates the available supply?

j. Does your organization have available capacity? If yes, what is preventing the filling of that capacity?

k. Is your organization considering increasing its capacity? If yes, in what ways, over what timeframe, and what impediments exist to such an increase? What factors does your organization consider when evaluating whether to increase capacity?

l. Has your organization changed its material and/or equipment purchasing levels or practices in the past three years?

m. What single change (and to which portion of the supply chain) would most significantly increase your ability to supply semiconductor products in the next six months?

2. Questions for intermediate users and end users of semiconductor products or integrated circuits:

a. Identify your type of business and the types of products you sell.

b. What are the (general) applications for the semiconductor products and integrated circuits that you purchase?

c. For the semiconductor products that your organization purchases, identify those that present the greatest challenge for your organization to acquire. Then for each product, identify the product attributes and purchases in 2019 and 2021, as well as average monthly orders in 2021. Then estimate the quantity of each product your organization would purchase in the next six months barring any production constraints as well as the amount your organization expects to actually be able to purchase. For each of your organization’s top semiconductor products, estimate each product’s lead times and your organization’s inventory for (a) 2019 and (b) currently (in days). Provide an explanation of any current delays or bottlenecks.

d. What are the primary disruptions or bottlenecks that have affected your ability to provide products to customers in the last year?

e. Is your organization limiting production due to lack of available semiconductors? Explain.

f. What percentage of your current production has your organization had to defer, delay, reject, or suspend in the past year? Explain.

g. Is your organization considering or carrying out new investments to mitigate semiconductor sourcing difficulties? Explain.

h. What semiconductor product types are most in short supply and by what estimated percentage relative to your demand? What is your view of the root cause?

i. Has your organization changed its material and/or equipment purchasing levels or practices in the past three years?

j. What single change (and to which portion of the supply chain) would most significantly increase your ability to purchase semiconductors in the next six months?

k. What percentage of your orders are fulfilled by distributors versus through direct purchase orders to semiconductor product manufacturers?

l. For the semiconductor products your organization purchases, how long (in months) are the typical purchase commitments? How, if at all, do your organization’s purchase commitments differ for products in short supply?

m. Has your organization faced “de-commits” (defined as a notification from a supplier that expected or committed supply will not be delivered in the agreed-upon time and quantity) in recent months? If this is a significant issue, please explain ( e.g., nature of product, supplier, impact).

These are reasonable questions in search of rational, logical, straightforward (linear?) answers. Those asking the questions realize these answers will often be difficult. It is not clear to me that those asking the questions understand how difficult. It is not clear to me that those asking the questions realize that by the time they receive earnest answers, most of the answers will be moribund. (And there will be some share of superficial, cynical, and grossly self-interested answers. There will also be meaningful silence.)

When accurate answers regarding demand and supply networks are possible, they will often have a half-life of a month, week, day, or a few hours. In the context of high volume, high-velocity demand and supply networks, accuracy is an exponentially decaying quantity and quality. As an indicator of strategic flow, an answer’s half-life can still be helpful… if the limitations of half-life are accepted. But depending on time elapsed, the most complete answers will take on that quaint quality of once-great value now deeply diminished. My grandmother’s silver tea service leaps to mind.

The Federal Register asks for answers to be received by November 8. This suggests that accurate answers will be based on something close to reality as observed in late September or early October. With extraordinary effort, the answers may be analyzed and assessed by early December. At year-end the answers offered will be about as relevant to problem-solving the chip shortage as our retrospective understanding might mitigate the Irish potato famine of the 1840s. It is too late.

[The next post suggests a different set of questions with a different action orientation.]

Improving Flow Prognosis?

The foreground of our picture is crowded. Too much demand for too much stuff. Too few containers for too much stuff. Too many ships waiting for too few cranes. Too many containers for too few chassis’ (truck or rail). Too much throughput for too few workers.

Contemporary supply chains are organized around demand. Fulfilling demand is the mission, purpose, obsession — perhaps even graven idol — of global business. So, eyes widened and jaws gaped on September 6 when Morten Engelstoft, CEO of APM terminals, told the truth to The Financial Times, “We need lower [consumer demand] growth to give the supply chain time to catch up, or differently spread out growth. Over a long period of time, we will need to recover efficiency.” (More and more and more.)

The FT reminds us, “US imported goods in July were up 20 per cent over the previous year and 11.5 per cent over 2019 as consumers splashed out, with their spending supported by stimulus measures since the second half of last year.”

The problem is most obvious at the Ports of Los Angeles and Long Beach, together the largest-by-far maritime cargo complex in the United States. Last week a record-setting sixty-plus ships were lined up waiting to unload. (See the satellite picture below and more from the Washington Post.)

Typically it is not darkest just before dawn, but we can confidently claim that dock density is worst just before incremental improvement:

The US personal savings rate has fallen to 9.6 percent, down from 26.6 percent as recently as March. American consumers still have a bit more cash-on-hand than pre-pandemic (February 2020: 8.3 percent), but the sense of having money to burn is unlikely to return.

On Friday (September 17) the LA-Long Beach ports announced they will facilitate more hours of truck access to retrieve and return containers. This is unlikely to increase the number of trucks, but it could increase velocity, almost certainly for truckers and trucks that arrive at off-peak-hours and maybe for the whole system if enough truckers decide to do so.

According to The Financial Times, the container construction industry, “is set to pump out a record 5.2m twenty-foot equivalent units (TEUs) this year, up two-thirds on 2020.”

With the usual shippers charging premium rates for tightly constrained capacity, alternative means and methods of moving cargo are beginning to fill some crucial gaps — for those able to pay. Non-traditional vessels are delivering to non-traditional ports that can move goods along less-crowded routes.

So, in the background of our current picture we may see dawn’s thin light rising to the east of crowded San Pedro Bay. There is finally some increased shipping capacity. There is incremental improvement in moving goods. But the current pile up is huge. Even if demand finally returns to something more sustainable, it will be months before something like 2019’s flow is experienced again.

Slowly (we) turn, step by step, inch by inch

US consumer demand remains strong. Despite the Delta variant’s determined discouragement, July retail sales were 0.5 percent higher than June. The Wall Street Journal explains, “With many schools, college campuses and offices reopening, consumers shelled out more for groceries and merchandise at big-box stores. Those purchases—along with higher spending on furniture and hardware—offset another big decline in car sales, which have suffered from a global computer chip-shortage that has crimped supply.”

Even with strong and often volatile demand — and constant reports of stock-outs — the ratio of retail inventories to sales increased to 1.11 . This remains very tight. But for three consecutive months, the ratio has remained above April 2021’s 1.07 asphyxiation level. It is, however, worth noting that breathing remains difficult for the food and beverage category. Here the seasonally adjusted ratio improved from 0.72 to 0.73. Grocery demand has continued to outpace most other retail categories. Could grocery stores sell one-fifth more with better assured supply? Or have upstream challenges introduced grocery to the charms of fast fashion merchandising? Are customers buying what’s available just-in-case?

As the Federal Reserve chart (below) suggests, the ratio had stayed within a narrow range since the end of the Great Recession. But when consumers stopped buying in March and April 2020 inventory quickly accumulated. Perceiving potential for a long-term demand drought, many retailers stopped ordering… just in time to be ill-prepared for a flash flood of retail demand in May-June 2020 and escalations since. In April 2021 US retail sales peaked at nearly one-third above the April 2020 bottom, Inventories have never caught up with this Niagara Falls of cross-cutting, fast falling inventory to sales ratio.