Month: December 2021

Omicron… both/and?

The contending narratives are fundamentally different.

A headline from summery Johannesburg (and its region): As Omicron advances, SA sees limited severe disease (more)

A headline from wintery London (and its region): Significant increase in omicron hospitalisations expected

Omicron is now largely confirmed as the most contagious version yet of Sars-CoV-2.

There is also accumulating evidence that omicron is very effective at evading prior immunity — resulting either from previous infections or vaccination. So, reinfections and so-called break-through infections will be tough to avoid.

What remains less clear is the severity (aka virulence) of omicron. What percentage of infections will result in covid requiring medical care and, especially, hospital care? (Projections by University of Texas at Austin COVID-19 Modelling Consortium)

The first large-scale study of omicron cases in South Africa was released yesterday (December 14). One summary of the findings:

Vaccine effectiveness: The two-dose Pfizer-BioNTech vaccination provides 70% protection against severe complications of COVID-19 requiring hospitalisation, and 33% protection against COVID-19 infection, during the current Omicron wave.

Reinfection risk: For individuals who have had COVID-19 previously, the risk of reinfection with Omicron is significantly higher, relative to prior variants.

Severity: The risk of hospital admission among adults diagnosed with COVID-19 is 29% lower for the Omicron variant infection compared to infections involving the D614G mutation in South Africa’s first wave in mid-2020, after adjusting for vaccination status

Children: Despite very low absolute incidence, preliminary data suggests that children have a 20% higher risk of hospital admission in Omicron-led fourth wave in South Africa, relative to the D614G-led first wave.

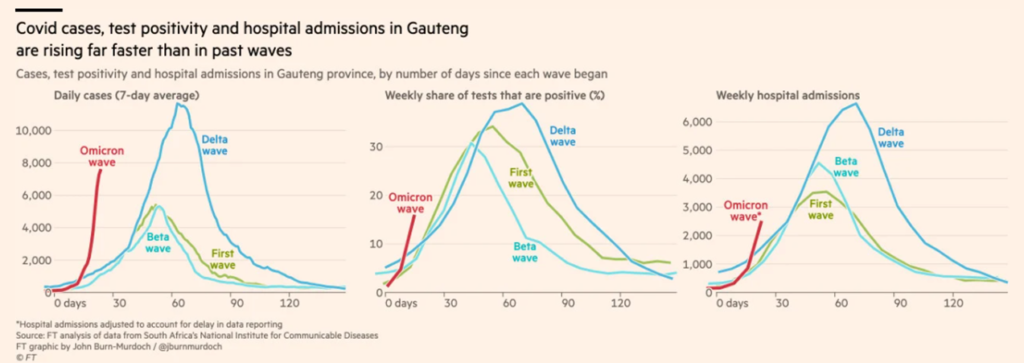
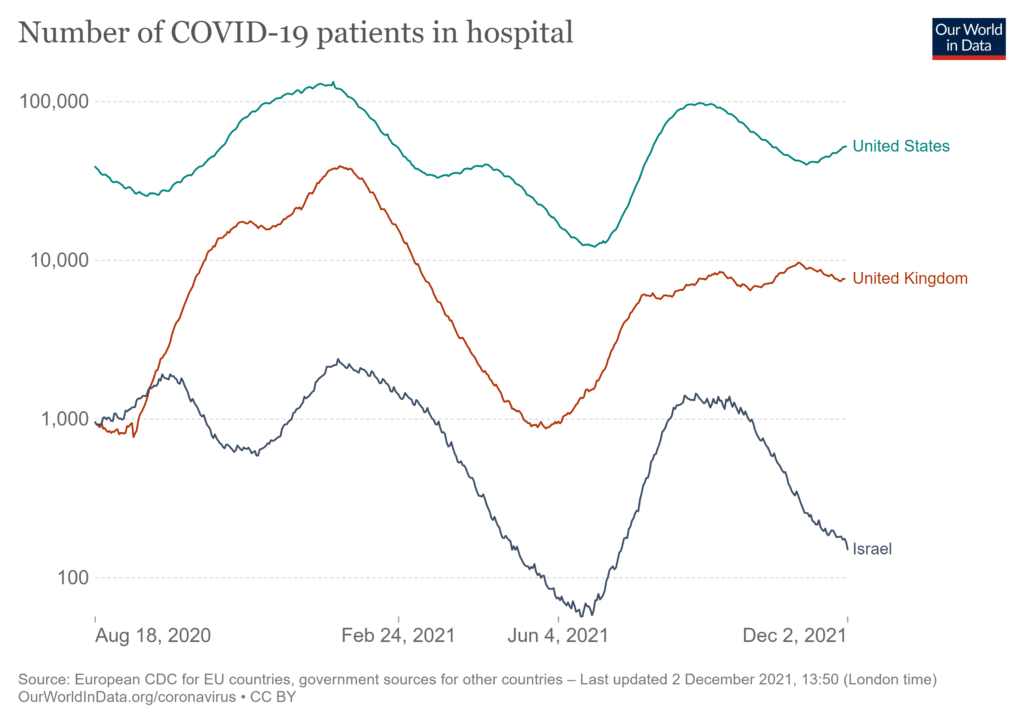
While the narratives contrast, current data are coherent. In both South Africa and the United Kingdom confirmed cases of omicron are skyrocketing. Hospitalizations are not — yet? — surging in either nation.

But the UK government estimates that by now about 200,000 residents per day are being infected with omicron. Some credible projections suggest that with high booster effectiveness plus high immune escape (consistent with current observations) there will be over 300,000 omicron related hospitalizations in England (alone) between December 1, 2021 and April 30, 2022, peaking sometime in January. There are about 6000 critical care beds in Britain’s National Health System out of a total 100,000-plus hospital beds. For prior variants, the median UK hospital stay for covid has been seven days, but this average has ranged between 10 and 15 days during high-admission waves. The median length-of-stay for those admitted to intensive care units is even higher. Pre-pandemic bed use was typically over 90 percent.

There is no obvious reason that the United Kingdom’s encounter with omicron should be unusually difficult. Given the status of vaccination and therapeutics, the UK ought to be better off than many others.

We cannot yet know how this tale of two cities will end. The original began with, “It was the best of times, it was the worst of times, it was the age of wisdom, it was the age of foolishness, it was the epoch of belief, it was the epoch of incredulity, it was the season of light, it was the season of darkness, it was the spring of hope, it was the winter of despair.”

Sounds about right.

As the flood slowly subsides

Contemporary high volume, high velocity supply chains organize around demand. The United States combines significant population with well above-average wealth. US demand motivates supply, both foreign and domestic.

Since December 2020 suppliers of US demand have been highly motivated. For example since last Christmas, US retail sales have increased from about $485 billion per month to over $565 billion (retail sales for November 2021 will be released later this week). This roughly 15 percent increase is the sharpest surge in the history of the measure.

In some product categories this increase has been razor sharp. Due to pandemic constraints, demand for many services (e.g., travel and eating-out) experienced stark declines. This reduced spending resulted in a personal saving rate of over 33 percent in April 2020, remaining significantly elevated until quite recently. With more cash on hand and pandemic constraints persisting, over the last twelve months US demand shifted from less tangible to more tangible products. For example, between February 2020 and October 2021, durable good purchases increased by nearly one-quarter.

Supplying this sort of swift increase and swerve in demand is not easy. Flows have experienced considerable friction and volatility. For example, according to the Logistics Managers’ Index, “In October, upstream respondents reported rates of growth 10.3 points higher than their downstream respondents. In November this flipped, and upstream respondents reported inventory growth was 10.9 points lower than downstream respondents. The shortages of retail goods this holiday season have not been as severe as they were predicted to be. This seems to have been largely achieved by firms spending heavily on warehousing and transportation to get goods downstream.”

Supply capacity for both warehousing and transportation is limited. There was certainly not a quarter-more capacity of either idly standing by (including, of course, each function’s work-force). As a result, prices for available warehousing and transportation have increased. Demand is mostly being fulfilled, but at higher costs… and with some delays and, almost certainly, with some shedding of low-margin places and people.

Given the competitive context, not all additional costs are being passed along. Several of the largest retailers are attempting to minimize price increases in an effort to protect and expand market share. But some increased costs are percolating through to retail prices, especially for fuel and food. From November 2020 to November 2021 the Consumer Price Index increased 6.8 percent, the largest increase since 1982. Part of this elevation reflects a one-third increase in the 2020-2021 energy index (2020 gasoline prices were unusually low). Year-Over-Year food prices in November were up 6.4 percent. In November apparel showed a YOY increase of 5.0 percent.

Financial and operational data confirm the challenge involved in preexisting supply matching surging demand (especially when complicated by pandemic-related problems). But flow has adapted and push is mostly fulfilling pull in most places for most Americans… who even now have slightly more money than usual to express their demand. Some have even begun to worry about excess inventories becoming a problem in the New Year.

Demand exploded. Flow adapted. To what extent has supply capacity changed?

My best answer is: I don’t know. The data with which I am familiar only offer tantalizing inferences. But my working hypothesis is: not much. At least not yet — and for most product categories significant capacity expansion strikes me as unlikely.

Not yet because the demand surge was so sudden. New warehouses do not materialize out of desert air. Because of structural changes in how high volume, high velocity flows are fulfilled, I expect a continued expansion in US warehouse capacity. But this is mostly due to swerving demand instead of surging demand. I do not expect recent increases in demand to survive far into 2022. I do expect the swerve, in terms of how and where demand is expressed, to persist.

Unlikely because transportation capacity is time-consuming and expensive to increase. Most maritime and air cargo players seem to perceive (accurately, I think) that the 2021 surge in US demand is unsustainable. Investments being made in future capacity are more about enhanced efficiency to serve incremental growth, rather than pedal-to-the-metal to close gaps in current flows. The trucking industry is working hard to avoid real reductions in capacity compared to increasing demand. The slow-down in demand that I expect will more closely match current trucking capacity (even as the demand slow-down could kill-off some trucking firms that have over-extended to serve recent demand surges).

Some data and analyses suggest that recent increases in energy prices reflect diminishing fossil-fuels capacity and very real costs involved in the treacherous transition to a post-fossil fuels future. So, there is both loss and gain in energy supply capacity and the net result will probably not be well-assured until the end of this decade (at least).

There are exceptions to my mostly-more-of-the-same prognosis. Significant new investments are being made in production capacity for semiconductors. As with warehouses, this expanded capacity reflects a fundamental shift in how global consumers behave and what they expect from the products they purchase. These behaviors and expectations justify the sort of large, long-term investments needed to expand this expensive supply capacity.

As plenty of other posts to this blog suggest, we are not yet operating in a post-pandemic context. But when such a day does come, it seems to me demand will look much more like 2019 than most of 2021. Our current flow capacity is much better suited for 2019 than 2021. Far upstream there are plenty of changes underway, but most of these are right-sized to a scope of demand that is much more pre-pandemic than mid-pandemic. So, as the flood of demand subsides, so will the turbidity we have seen in flows and that strange sucking (or is it squeezing?) sound from farther upstream.

+++

I will readily confess that this is the same argument I have tried to make for many months. There is not much evidence that this supply chain guy has persuaded many. Maybe a big-time financial analyst will do better. Please listen to at least the first 90 seconds of Michael Collins (PGIM) explain. Sound familiar?

https://www.bloomberg.com/news/videos/2021-12-13/totally-flat-yield-curve-is-already-priced-in-pgim-video

December 18 Addendum: Another very similar explanation courtesy of the Wall Street Journal and Phil Levy, Chief Economist at Flexport.

January 11 Addendum: Yet another demand-focused distribution-strained explanation from Karl W. Smith with Bloomberg.

Okay, I will stop tracking these convergent analyses… I recognize this is a bit of a defensive reaction on my part. But c’mon folks.

Calibrating Omicron’s Risk

Here is the carefully accurate current assessment of omicron by the CDC.

In South Africa it is very clear that omicron is spreading more rapidly than any prior variant. There is growing evidence that omicron’s ability to evade prior immunity is resulting in a higher incidence of reinfection and breakthrough infections.

There is accumulating evidence that similar omicron transmission speed is being experienced in Denmark and the United Kingdom (more), each with vaccination rates better than most places (including the United States).

As experienced with every prior version of covid, in the vast majority of omicron infections so far, disease symptoms are mild. One rigorous study found that 2.1 percent of those infected with the Sars-CoV-2 virus have required hospitalization.

With every prior version of covid, as more people are infected with omicron, the number of those experiencing severe disease has also increased. So, for example, a surge in delta-related hospitalizations is currently stressing the US health care system. Delta is not as contagious as omicron, but it is more efficiently transmissible than previous variants. This eventual surge in hospitalization has been predictable and predicted.

Please consider this word problem:

Your locality has a supply of 100 staffed and otherwise clinically supported hospital beds.

The incidence of covid-related disease requiring hospitalization is two-percent.

What number of covid-related infections can your local hospital capacity support?

There is a largely fixed supply — expensive, difficult, and time-consuming to adapt — encountering surging and volatile demand.

Hospital bed capacity (per 1000 persons) is very similar in the United States (2.8), United Kingdom (2.4), and Denmark (2.6). I would not be surprised to learn that US capacity has fallen over the last year because of covid-related staffing constraints.

Some say, without much evidence yet, that omicron’s severity is half that of delta. So far there is increasing evidence that omicron may be four times as contagious as delta. Both estimates are early, but still: do the math. Where does this leave us in terms of probable proportions experiencing severe disease?

Two Fridays ago I was frustrated by the knee-jerk fearful reactions to initial reports of omicron (here and here and here). This Friday I am as concerned by the lack of attention to accumulating evidence of risk. The virus is changing, but its behavior is stolidly predictable compared to erratic social, political, and financial responses to the virus.

Risk is an outcome of how threat interacts with vulnerability. The same threat can produce dramatically different consequences, depending on what vulnerability is encountered. This is obviously true in terms of individual covid consequences. It may be less obvious but as true in how different social groups (local to global) respond to the threat of covid. Early, diligent demand-management (e.g., Israel) reduces vulnerability and can avoid flood or drought of flows. Inconsistent or absent demand management increases vulnerability while amplifying extreme gyrations of supply and demand.

+++

December 11 Notations:

Sometime yesterday, Anjana Ahuja posted “The Omicron Paradox is Starting to Reveal Itself” in the Financial Times. She does a better job offering the same argument as above. Many Brits are concerned that omicron is hurtling toward very high case counts by Christmas. In at least two prior waves, the USA has tracked the UKs demand curve about 4 weeks later. Given current delta-driven demand for medical care in the United States, such a one-two punch would be especially punishing.

Early today (Saturday), Bloomberg posted a helpful round-up on what is known and not-yet-known related to omicron.

Later on Saturday: “New modelling from the London School of Hygiene & Tropical Medicine (LSHTM) suggests the Omicron variant has the potential to cause a wave of transmission in England that could lead to higher levels of cases and hospitalisations than those seen during January 2021, if additional control measures are not taken.” Even the most optimistic projections are sobering. (More)

Hospitalization demand update

Covid-related hospitalizations in the United States have increased from a rough daily average of 45,000 in early November 2021 to about 58,000 now. These are Delta-driven. Omicron is not yet impacting US hospitalizations. The January 2021 peak for US covid hospitalizations (see chart below) was just over 125,000. On December 8, 2020 there were just over 102,000 Americans hospitalized with covid.

The rapid increase in current South Africa covid case counts is being caused by omicron. Hospitalizations are beginning to increase too. Delta and omicron are each tough enough alone, a combined effect would not be welcome anywhere by anyone.

Usually reliable sources had told me that meaningful virologic analysis of severity (aka virulence) would be available by now. Instead I am seeing early (small but rigorous) virologic analysis of vaccine effectiveness. Some aspects of severity can be inferred, but are less than definitive.

A multinational team organized by the Africa Health Research Institute has released a pre-print reporting on results of an analysis of how antibody immunity fostered by the Pfizer vaccine is affected by omicron. According to this analysis, omicron is much more successful at evading vaccine-induced immunity that prior variants. But the study also found, “Previous infection, followed by vaccination or booster is likely to increase the neutralization level and likely confer protection from severe disease in Omicron infection.” (More)

A separate study by the Karolinska Institute and its international partners released yesterday also found diminished immunity to omicron in vaccinated persons, but the reduced protection was less pronounced than the AHRI findings and “highly variable.” The researchers also emphasize, “Almost all serum samples evaluated retained some neutralization activity against the Omicron variant.” (More)

Just before 0700 Eastern Time this morning Pfizer announced, “Preliminary laboratory studies demonstrate that three doses of the Pfizer-BioNTech COVID-19 Vaccine neutralize the Omicron variant (B.1.1.529 lineage) while two doses show significantly reduced neutralization titers.” This is coherent with the AHRI and Karolinska findings. Much more to come.

Optimism about omicron

We are increasingly confident that omicron is highly contagious. From South Africa to Denmark the velocity of transmission has been a bit stunning. As early as today we may have the results of initial virological studies of omicron virulence (aka severity). As widely reported, so far the epidemiological outcomes of omicron are characterized by modest morbidity. It will take another week or more to reasonably estimate the efficacy of current vaccines vis-a-vis this new variant.

While we wait to learn more it can be worthwhile thinking self-critically about scenarios and options.

Today, let me be optimistic and assume that omicron is no-more (and maybe even less) virulent than the the Delta variant. Call me Pollyanna, but I will also assume that vaccines approved for use in the United States continue to be effective in significantly reducing the risk of serious disease and death (related). In other words, most Americans — even vaccinated Americans — may eventually be infected by omicron, but when vaccinated most of us (let’s say 80 percent of those vaccinated and boosted) will not experience health consequences requiring hospitalization.

If these very optimistic scenario elements were confirmed in the next two or three weeks, it would be one of the best Christmas presents possible.

And… roughly forty percent of 330 million Americans are not vaccinated. Less than 15 percent of US residents have received booster shots. But, continuing to be optimistic (and to make the math easier), for this scenario I will project a potential demand pool for US covid-related health care of only about 100 million. So far, of those infected with prior versions of covid, only about two-percent require hospitalization

Hmmm… suddenly our scenario is less optimistic.

And… when I consider there are roughly four billion people on the planet who have not been vaccinated, the ongoing potential for transmission, reinfection, mutation, and further reinfection seriously challenges my optimism. Especially while we remain uncertain of omicron’s virulence and related vaccine efficacy, I can continue to generate various Panglossian justifications (“the best of all possible worlds”) (more). But more troublesome projections are equally or more credible.

If you can, please read today’s helpful analysis in the Financial Times: Omicron’s less severe cases prompt cautious optimism in South Africa. The chart below is extracted from this story. Given my preceding efforts to be optimistic, I view the outcomes below with considerable concern.

Wire-diagramming supply chain disruption

On Sunday, December 5, the New York Times published online: How the Supply Chain Crisis Unfolded. Lazaro Gamio and Peter S. Goodman heroically provide a cause-and-effect overview. It is a helpful and constructive contribution. Anything written (other than λόγος (logos)?) is reductionist. I would have added a bit more related to congestion in China and friction in various freight functions after imports are discharged from ports. But given their achievement, this is a narcissism of small differences.

The New York Times has self-critically confessed that before 2021 it did not give much attention to supply chains. It has done a good job playing catch-up. Competitors at the Wall Street Journal, Bloomberg, Financial Times, and Reuters (among others) have a better bench and more depth of perspective. I have noticed, though, that the NYT often gives attention to fundamentals and key relationships that others (myself included) can take for granted, but are new to many general readers.

To see supply chains given sustained and serious editorial attention by all the business journals, Times, Post, Politico, The Hill, and even the New York Review of Books has — appropriately — altered expectations of the network’s performance and the supply chain profession.

Too early to decide

So far the rate of increased hospitalization related to omicron in South Africa is negligible. This is certainly a better outcome than the opposite. This is also consistent with the original version of the virus and for Delta and for every other variant I have been able to track. In the vast majority of human infections, so far, covid is an inconvenience not a crisis. But — big but — the more contagious the version of the virus, eventually the more disease requiring medical care, and then (a few weeks later) the higher number of deaths. It is basically a numbers game and it has always taken some time — typically four to six weeks — for a highly contagious virus to begin finding those most vulnerable. Given these prior patterns, we should not assume a different outcome with omicron until more time has passed and more data are available.

+++

December 7 meta notation: Perception of reality is (I perceive) always partial. We are both constrained and empowered by experience, expectations, angle of observation, self-correction and much more. My angle on the pandemic is that of one who spends most of his time, activity, and thinking on the behavior of demand and supply networks. This is not always the most relevant and helpful angle for engaging pandemic problems. But this angle may help those with other perspectives more fully recognize the health care consequences of high volume, high velocity flow behavior. Large scale dynamic, non-linear flows are innately chaotic, but offer a kind of chaos in which relationships and feedback are reliable sources of adaptation and creativity. Upstream and downstream are not just connected but interdependent, especially (it seems to this supply chain guy) on the pull of demand. Given my experience, I perceive that many problems associated with local supply of covid-required healthcare will only be effectively resolved by managing global flows of covid-driven demand.

Port congestion update

During the second half of November port congestion softened in East Asia. Given China’s pandemic protocols and the emergence of the new variant, this could be a brief pre-omicron pause. (more)

But US east coast ports — including sometimes struggling Savannah — are also seeing significantly improved flow. (More and more)

The situation at the Ports of Los Angeles and Long Beach continues to be very tight. While some measures of flow capacity have not gotten worse or slightly improved (more and more), velocity has not increased and volumes to unload continue to build.

Almost every major port has seen increased volumes (and shipping rates). As previously outlined, this reflects very strong and sustained US consumer demand that is apparently continuing. On December 3 the National Retail Federation’s chief economist reported:

… the ever-important Thanksgiving holiday weekend now helps to mark the holiday season rather than serving as the kickoff it once was. Consumers and retailers have both revised their playbooks and broken with previous traditions. With the momentum we’ve seen so far likely to continue, it seems probable that we will exceed our initial projection, which was made when the late-summer growth in COVID-19 was still a key factor. Rather than the growth of 8.5 percent to 10.5 percent over 2020 we expected in October, we now believe holiday retail sales could grow as much as 11.5 percent.

To further emphasize: The NRF projections for near-term demand are entirely consistent with demonstrated patterns of demand fulfilled. For several months through the end of October US retail sales have been one-fifth better or even higher than pre-pandemic, as demonstrated by the chart below.

Where all-time volume records are being broken to support this demand, increased friction has emerged. The problems at LA/LB are amplified by the preexisting proportion of total flows that depend on the neck of this hourglass. It is regularly reported that about 40 percent of total US imports are discharged at these neighboring ports. About 90 percent of East Asian imports flow through Southern California. Given the time and expense of alternatives (e.g., Ningbo to Los Angeles: 6548 miles versus Ningbo to Savannah 16,438 via Suez) — and the lack of any other Pacific port with close to comparable freight forwarding capacity — LA/LB remains the best choice even with the persistent pile-up.

The push of inbound flow will not decline until after the pull of demand subsides.

US demand for hospital care

Below is an updated chart suggesting the “demand curve” for covid-19 hospitalizations in the United States, United Kingdom, and Israel.

So far, none of these outcomes reflect the spread of omicron. Instead, the stubborn levels of demand in the US and UK demonstrate the ability of the Delta variant to find and infect those who are not vaccinated or are otherwise vulnerable.

The difference between Israel’s demand curve for hospitalization and the other two is the result of multiple factors. Israel benefits from a younger average age, more consistent community-wide vaccination, wider practice of non-pharmaceutical mitigation measures, and earlier more successful deployment of vaccines and boosters. Israel has focused intently on network-wide demand suppression for hospitalization.

While omicron seems to be highly contagious, there is not yet sufficient evidence to reach conclusions about the variant’s virulence or the efficacy of current vaccines. Given continuing high levels of demand related to Delta, as shown below, it would be reassuring to find that omicron does not prompt a significant surge in hospitalizations. But, again, right now, evidence is insufficient either way. [Here’s a very helpful December 3 overview from the Financial Times that I did not notice until December 5.]

We do know that in prior waves: the more infections, the larger the number of eventual hospitalizations until, too often, demand overwhelms local and regional health care systems — exceeding the capacity of health care professionals, medical goods, and available beds.