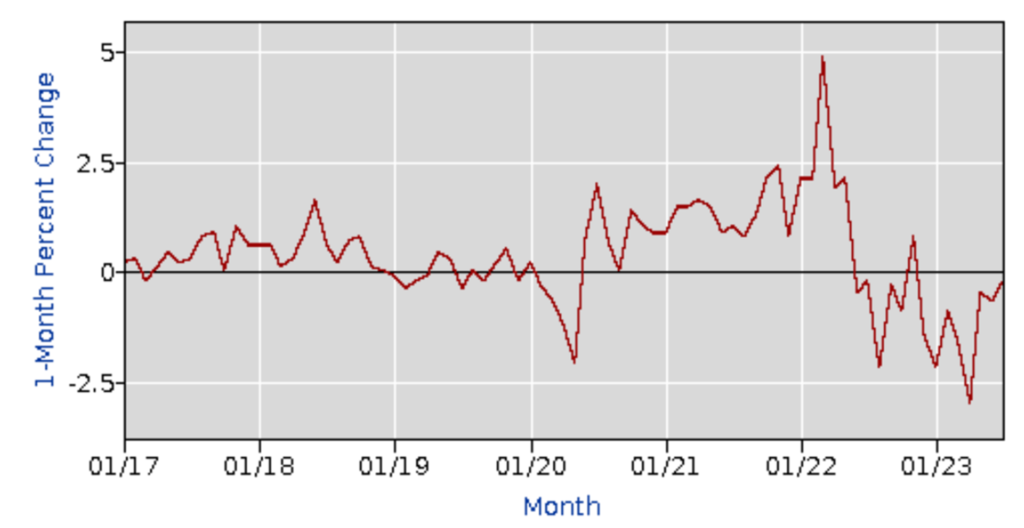
Author: Philip J Palin

August Vital Signs

Every four to five weeks I update the following indicators. Here are the July and June updates. These are not comprehensive indicators. For comprehensive please see other sources, such as the Global Supply Chain Pressure Index or the Logistics Managers Index. But combined with more comprehensive measures, these five factors give me a finer sense of overall flow capacity, current discharge, and emerging conditions.

North American Agricultural Production: On August 11 the USDA released its World Agricultural Supply and Demand Estimates. Here are some excerpts:

The outlook for 2023/24 U.S. wheat this month is for decreased supplies, slightly lower domestic use, reduced exports, and higher stocks. Supplies are reduced as wheat production is forecast at 1,734 million bushels, down 5 million from last month… Canada is decreased 2.0 million tons to 33.0 million on worsening drought conditions in the Prairie Provinces… This month’s 2023/24 U.S. corn outlook is for reduced supplies, lower domestic use, smaller exports, and tighter ending stocks… Corn production for 2023/24 is forecast at 15.1 billion bushels, down 209 million from the July projection and if realized, would be the second highest on record behind 2016/17. [Drought has also reduced Canada’s anticipated course grains production.]… The outlook for U.S. rice in 2023/24 is for increased supplies and ending stocks compared with last month and no other changes. The initial survey-based production forecast for the 2023/24 crop increases production from the previous forecast by 2.6 million cwt to 203.6 million, all on higher yields. [Information on crop production outside North America is summarized here, please see updates below the chart.]

[August 17 Update: S&P Global provides a helpful weather watch related to US and global crop conditions.]

Global Natural Gas Demand and Supply: According to most market sources the natural gas market is currently close to a healthy equilibrium. Prices are well-below last year’s war-time premiums. Last week EIA commented, “We expect global liquefied natural gas (LNG) import capacity (also known as regasification capacity) to expand by 16%, or 22.8 billion cubic feet per day (Bcf/d), in 2023‒24 compared with 2022 once all regasification terminals currently under construction are completed.” But some near-term risks to persistent flows are causing some price volatility. S&P Global reports, “Workers at Australia’s Gorgon, Wheatstone and North West Shelf LNG projects are threatening to go on strike due to disagreements over pay and working conditions. Gas companies Woodside and Chevron have been in talks with the workers unions to address their concerns. The three LNG terminals have a total LNG export capacity of around 41 million mt/year that equals to around 10%-11% of global LNG supply. The news has already sent European TTF gas prices and Asian spot LNG prices higher as a disruption could coincide with the early winter restocking season, when Europe competes with Asia for LNG supplies.” (More and more and see chart below.)

China Export Volumes and Value: Reuters reports, “China’s imports and exports fell much faster than expected in July as weaker demand threatens recovery prospects in the world’s second-largest economy… The grim trade numbers reinforce expectations that economic activity could slow further in the third quarter, with construction, manufacturing and services activity, foreign direct investment and industrial profits all weakening… Imports dropped 12.4% in July year-on-year… and off a 6.8% decline in June. Meanwhile, exports contracted 14.5%, steeper than an expected 12.5% decline and the previous month’s 12.4% fall. The pace of export decline was the fastest since the onset of the pandemic in early 2020” (more and more and more). And it should be emphasized, 2022 exports were near record highs, if not quite as high as August and September 2022. Still… the pattern has been persistent and seems unlikely to turn-around soon. China’s exports to the United States are down about one-quarter so far in 2023 (more) and well below pre-pandemic patterns.

North American Grid Capacity: An August 4 post — plus updates on August 10, 12, and 14 — gave considerable attention to this issue. I will add the following blurb from a helpful August 8 EIA report, “In the first half of 2023, developers added 16.8 gigawatts (GW) of new utility-scale electric generating capacity to the U.S. power grid, according to our latest inventory of electric generators. Developers plan to bring an additional 35.2 GW of capacity online in the second half of the year… Solar power accounted for the largest share, 35% (5.9 GW) of the capacity that came online in the first half of 2023. That new capacity is 4.6 GW less than what developers and project planners reported expecting for the period at the beginning of the year. Supply chain constraints were the primary cause for this shortfall.” As the August 4 post note there is a continuing challenge fully connecting and flexibly transmitting this new capacity, especially between major grid regions.

US Personal Consumption Expenditures: Yesterday’s strong July retail sales report suggests that the pattern of Personal Consumption Expenditures for June has persisted (more). I have wanted to see flat, but it is increasingly difficult to obscure the increasing upward slope since March (see second chart below). According to the Census Bureau, “Advance estimates of U.S. retail and food services sales for July 2023, adjusted for seasonal variation and holiday and trading-day differences, but not for price changes, were $696.4 billion, up 0.7 percent (±0.5 percent) from the previous month, and up 3.2 percent (±0.7 percent) above July 2022.”

My read of current vitals: Demand is strong while mostly stable, this facilitates push fulfilling pull. Despite both ordinary — and some extraordinary — threats, North American (and even global) food flows remain sufficient to abundant for those with the ability to pay increasing prices. Global energy supplies, similar to food supplies, are mostly coherent with effectual demand… since demand (especially from China) is not expected to see much near-term growth. Electrical generating capacity is moving in the right direction even if with lagging constraints on transmission/distribution. So… mostly healthy. Threats to all of this are prolific, but barring the hardest hits on the highest proportion concentrations the overall network is demonstrating meaningful capacity, adaptation, and resilience.

Maui Mass Care

Upstream and midstream flows serving Maui are operating above preexisting capacity. Downstream flows — and especially demand velocities — have been very seriously disrupted. What is needed, how much is needed, and precisely where it is needed are not yet entirely clear to downstream operators.

Upstream flows from Port of Oakland and Port of Long Beach are consistent with prior schedules. Matson and Pasha are the principal Jones Act carriers delivering groceries, medical goods, and other essentials into Honolulu. Air cargo flights into Hawaii and, specifically, into Kahului Airport on Maui have been expanded (here and here and here).

Midstream flows from Honolulu to Maui have also been consistent with or better than prior volumes and velocity. Maui is mostly supplied out of Honolulu (less than 100 miles distant, one way ferry transport usually takes 2.5 hours). Here is how Matson explains their current flow:

Matson operates a hub-and-spoke system in Hawaii, sailing mainline containerships between the U.S. West Coast and Honolulu three times a week, with connecting service to the Neighbor Islands on owned barges. It will maintain its normal schedule of barge arrivals at Kahului on Tuesdays and Fridays. The company has scheduled one extra Maui sailing, on Sunday, August 20, and is considering additional sailings to Maui should they be needed.

Young Brothers is an especially important midstream — inter-island — carrier. As early as August 9, Young Brothers explained:

The Port of Kahului is fully operational and will be accepting and delivering cargo as normal. To support relief efforts in the face of the disastrous wildfires that have impacted the communities of Maui, we will be prioritizing the loading and discharge of medical supplies and emergency and utility vehicles to the port of Kahului over the next few sailings. Young Brothers will strive to ensure that bookings for gated cargo sail on the currently scheduled sailing date(s). However, due to shifts in capacity for certain sailings, Young Brothers may re-book some cargo to the next available sailing.  As a reminder, less than container load cargo is moved on a space available basis and priority will be given to cargo that support relief efforts.

Downstream flows, especially in western Maui (see maps below and here), suddenly fractured (in some places melted or were reduced to ash), consumer ability to signal demand was very constrained even as immediate demand spiked. Demand nodes — such as grocery stores and restaurants — have been destroyed. The ability to purchase supply has been reduced by loss of these nodes, unreliable cell networks, and loss of related digital transaction networks. Most housing in Lahaina (population: @ 13,000) is estimated to be a total loss, including the loss of residential food stocks (see second map below). Most supply channels have survived, but localized scope and scale were sparse even before this disaster and perimeter controls remain in place. The local public water system is mostly intact, but in the hardest hit locations water is considered unsafe to drink. Grid power remains unavailable to roughly 5000 customers in Maui County. Cell coverage is beginning to recover.

The flow networks supplying Maui’s demand were not seriously impacted by the August 8 and subsequent wildfires. These flow networks have flexed in response to devastating local losses. But western Maui, in particular, is on the far outer edge of high volume, high velocity demand and supply networks. In the case of no-notice or fast-onset major disasters, local demand will often be separated from outside flow for 72 hours or longer. Local demand is usually displaced and discombobulated. Local supply nodes are often disrupted or destroyed. Reconnecting network supply with local demand is delayed by lack of communication, loss of essential infrastructure, and many other factors. Utter destruction of the built environment, as in Lahaina, will extend this isolation period… especially where preexisting flows were already peripheral.

Initial response, inside this 72 hour window, is most likely to spontaneously emerge from immediately proximate and less-systematic behavior where survivors directly help survivors (more and more). The more physically isolated the disaster locale, the more time-extended this period of initial response. The more proximate the impact zone to a comparatively unscathed concentration of supply, the more quickly network capacity can be recovered and deployed. None of this is surprising. All of this has been empirically demonstrated and confirmed for over seventy years (one classic example here).

The recurrent reality of this delay is not comforting to survivors. Many disaster response professionals (both private and public) work hard to reduce this delay. But physical limitations of distance, time, capacity, and interdependencies can be very stubborn. More comforting is the “cornucopia” of supply that typically emerges in the extended aftermath of the isolation period… at least where and when effectual demand persists and preexisting network capacity has also survived.

[On August 25 a new post updated the status of recovery for Maui.]

Literally low flows

According to the Wall Street Journal, “Low water levels on the Mississippi River are threatening to disrupt commerce for a second consecutive year… Water levels in St. Louis and Memphis are 10 to 20 feet lower at this point in the year than in 2020 and 2019 due to lack of rain.” (More and more)

Bloomberg reports on Rhine river reductions, “After brutal heat waves scorched southern Europe, the river at Kaub, a key waypoint west of Frankfurt, has hit levels this summer that mean some ships could carry only about half of normal capacity. While recent rains have eased the strain, even small changes can have a major impact. A drop of 10 centimeters (four inches) means about 100 fewer tons can be transported per ship…”

S&P Global explains Panama Canal restrictions, “As the dry season has continued to wreak havoc on the water levels at Gatun Lake, canal wait times have increased sharply amid draft restrictions and a reduced number of transit allotments. The most recent draft restrictions, announced June 22, put the maximum authorized draft for the Neopanamax locks at 44 feet and 39.5 feet for the Panamax locks. Under normal conditions, with no draft restrictions, the maximum draft authorized for the Neopanamax locks is up to 50 feet and up to 39.5 feet for the Panamax locks.” See picture below.

The Yangtze has recovered from last year’s drought. Ohio river water levels are near long-time averages. In some places the Danube’s water level is double last August. The Rhine’s flow is better this week than last week. But shipping disruptions caused by drought have spiked in recent years.

Gatun Lake (Panama) shows drought impacts: more from Wall Street Journal

July CPI

Between January 2021 and January 2023 the Consumer Price Index for food increased from 271.3 to 319.7 (where the 1981-1982 average equals 100). That was a precipitous increase (see chart below) caused by a sustained surge in demand for Food-At-Home during the pandemic.

Even as Food-Away-From-Home options reopened in Spring 2021, demand for groceries remained well above pre-pandemic patterns. During the second half of 2022, FAH demand returned to levels better matched with processing/manufacturing capacity. For most of 2023 food prices have retreated from the (economic and political) precipice.

This morning the Bureau of Labor Statistics reported a July CPI for Food-At-Home of 322.1. According to the BLS survey:

The food at home index increased 0.3 percent over the month, after being unchanged in June. Four of the six major grocery store food group indexes increased over the month. The index for meats, poultry, fish, and eggs rose 0.5 percent in July as the index for beef increased 2.4 percent. The fruits and vegetables index increased 0.4 percent over the month and the other food at home index rose 0.2 percent. The index for dairy and related products increased 0.5 percent in July after decreasing in each of the previous 4 months. The nonalcoholic beverages index and the cereals and bakery products index were both unchanged in July.

Food (and energy) can be volatile. Weather and other natural phenomena can complicate supply. The cost-structure of food is highly responsive to wages, fuel costs, and related freight costs. But given this potential volatility and actual constraints on supply, 2023 US food prices have — so far — been remarkably stable.

Reduced Fuel Flows

This morning the average price of gasoline in the United States has increased to above $3.82 per gallon, up from $3.54 a month ago. Sustained July high temperatures slowed many Gulf Coast and Midwest refining operations, constraining domestic supply (more). Global energy prices have also been trending modestly higher. Explanations often involve, ” a combination of OPEC+ committing to output reductions, a substantial withdrawal from crude oil inventories, and optimism regarding the potential of a soft landing for the global economy…” (More and more.)

But in recent days the rate at which US gasoline prices are increasing has flattened (or even fallen in some places). In an attempt to explain, Reuters “pointed to the impending early September end of the U.S. summer driving season and lower than expected demand from China.” Last week overall US stocks of gasoline increased after falling each previous week in July (more).

Meanwhile… as I write (on Wednesday morning US east coast time), European LNG front-month future prices are spiking… like a rocket launch (please see chart below). There are many reasons to be nervous about European LNG demand and supply (such as here and here), but according to the Financial Times today’s volatility is evidently tied to “the potential for liquefied natural gas supply disruptions from Australia… TTF, the European benchmark, rose as high as €42 per megawatt hour in Wednesday afternoon trading, 35 per cent higher than the previous day, and hit its highest point since mid-June.”

Bloomberg tagged potential strike action as the underlying issue: “Workers at Chevron Corp. and Woodside Energy Group Ltd. facilities in Australia voted to strike, which has the potential to disrupt LNG exports from the country, tightening the global market for the fuel. The exact timing of the industrial action — if it goes ahead — wasn’t immediately clear. Laborers could stop with seven days’ notice as early as next week depending on progress at a meeting on Thursday…”

It is not unreasonable to be nervous about a second war-time winter with dramatically altered sources and channels of natural gas for Europe (and elsewhere). But EU natural gas inventories are above normal for this time of year (more). US natural gas stocks are well above the five-year average. US LNG export capacity has never been higher (here and here).

Geo-political intention — also-known-as cartel action or war — could still upset current conditions. But, right now, “ordinary” demand for gasoline and natural gas is not out-of-balance with existing supply capacity or flows. If demand remains mostly inside preexisting parameters and distribution of available fossil fuels is not seriously disrupted, prices may roller-coaster in the short-term but both prices and supply should remain coherent with demand through the autumn. After that depends on a whole set of factors beyond any reasonably confident anticipation.

+++

August 10 Update: Overnight (in North America) LNG TTF futures continued to climb. The European benchmark price rose 40 percent before softening as the sun rose over Sydney. As dawn arrives on the US east coast Asian prices continue to rise. Potential strike action could reduce (recent) global LNG flows by 10-11 percent. (Here and here and here.) In this global context, Bloomberg reports on Germany’s natural gas capacity: Stockpiles are “developing positively” and are nearly 90% full, but a cold winter could still put Germany’s energy security at risk. “The danger of gas shortages during cold temperatures remains and will continue to accompany us until winter of 2026/2027 unless further infrastructure measures are taken…”

Global Food Flows

Ukraine’s contribution to global grain flows will be reduced. Russia’s July 17 withdrawal from the Black Sea Grain Initiative and military action against agricultural and port infrastructure will slash this year’s production potential and shipping capacity (here and here and here). According to the USDA:

Ukraine planted area is down significantly as a result of the war with Russia. Production in 2023/24 is forecast at 17.5 million tons, the smallest crop in over a decade. With sharply reduced supplies and uncertainty surrounding the future of the Black Sea Grain Initiative (BSGI), 2023/24 Ukraine wheat exports are forecast lower at 10.5 million tons, down over 40 percent from the pre-war average (2016/17-2020/21). While the BSGI helped Ukraine export 16.8 million tons of wheat in 2022/23, 39 percent of wheat moved outside of the grain corridor (primarily via land shipments to Eastern Europe).

The loss of a significant portion of Ukraine’s prior production comes in the midst of other production constraints. According to the USDA July Grain Report: “Global production is forecast down with smaller crops in Argentina, Canada, and the European Union… Global consumption is forecast higher, mostly on larger feed and residual use in China. Global stocks are forecast down, mostly on reductions for China and Russia, reaching the lowest level since 2015/16.” (More)

Global grain prices have not, however, seen significant increases so far (see chart below). This reflects strong results and/or projections for big parts of grain production in the United States (more), Russia, Pakistan, and some others. In the southern hemisphere, Brazil and Australia had very strong 2022-2023 harvests.

Always uncertain and increasingly extreme weather could still be disruptive, but where there is an ability to pay there is typically plenty of food supply to be had. According to the United Nations Food and Agricultural Organization, “The FAO Food Price Index (FFPI) averaged 123.9 points in July 2023, up 1.5 points (1.3 percent) from June but remaining 16.6 points (11.8 percent) below its value in the corresponding month last year. The FFPI’s rebound in July was led by a solid rise in the vegetable oils price index, partially offset by a significant decline in the sugar price index, together with small decreases in the price indices for cereals, dairy and meat.” (More)

+++

August 10 Update: Bloomberg reports:

A surge in rice prices to the highest level in almost 15 years is renewing fears that food costs are going to get a lot more expensive for the world’s poorest people. The grain is vital to the diets of billions in Asia and Africa. Rice contributes as much as 60% of total calorie intake for people in parts of Southeast Asia and Africa, and that rises to 70% in countries like Bangladesh. The latest price jump increases stress on global food markets already roiled by extreme weather and the escalating conflict in Ukraine. Thai white rice 5% broken, an Asian benchmark, climbed to $648 a ton this week as dry weather threatens Thailand’s crop, and after top shipper India — which accounts for 40% of the world’s trade — ramped up export curbs to protect its local market.

August 12 Update: The new World Agricultural Supply and Demand Estimates (WASDE) were released on Friday. According to USDA, “The global wheat outlook for 2023/24 is for reduced supplies, lower consumption, decreased trade, and lower stocks. Supplies are projected to decline 4.3 million tons to 1,061.7 million…” S&P Global highlights, “The US Department of Agriculture has revised the corn yield estimate for marketing year 2023-24 (September-August) to 175.1 bushels/acre from 177.5 bu/acre…” Changes in production estimates for several non-US producers are also highlighted, including a bit better for Ukraine and a bit worse for China.

Electrical Transmission Capacity

On July 28 the Federal Energy Regulatory Commission (FERC) issued a new rule (1481 pages) intended to accelerate “modernization of the nation’s transmission grid by streamlining the interconnection process for transmission providers” (more and more). The new rule is expected to take effect by October. Compliance plans from regional grids will be due late this year or in early 2024.

The US grid is undergoing a major transition. But connecting potential new sources and capacity to the transmission network has become a serious impediment. According to the Lawrence-Berkeley National Laboratory, “only 21% of the projects (and 14% of capacity) seeking connection from 2000 to 2017 have been built as of the end of 2022. Interconnection wait times are also on the rise: The typical duration from connection request to commercial operation increased from <2 years for projects built in 2000-2007 to nearly 4 years for those built in 2018-2022 (with a median of 5 years for projects built in 2022).”

According to E&E News, “Under the new FERC rule, grid operators and electric utilities will need to change how they study energy projects and will now be subject to firm deadlines and penalties if they fail to process connection requests on time. ” (Specifically, the rule replaces the prior reasonable efforts standard to complete transmission connection studies with firm process deadlines for transmission providers.) “Proposed electricity projects will be studied in groups, rather than individually, and projects that are further along in the development process will be prioritized… The rule also requires project developers to submit financial deposits and obtain certain land or building rights in order to be studied and approved to come online.” (More and more and more.)

CleanTechnica commented on the enhanced project development requirements, “No more, “Let’s wait and see if we get approved before we start down the road toward actual planning.” Now applicants must show they have a fully formed plan in place. If so, and if they can get their project up and producing electricity quickly, they move to the head of the line… The new FERC rule basically says, “Put your money where your mouth is and we will do everything we can to get you connected as soon as possible.””

Due to rapidly rising demand and significant restructuring the current North American grid (and most grids around the world) is too often operating too close to capacity limits (here and here). Lack of grid reliability is a significant threat to Supply Chain Resilience. This grid issue also highlights the classic role of interacting capacity in Supply Chain Resilience.

High volume, high velocity expression of demand (point-of-sale terminals, related fintech, data centers, and more) requires electricity. Fulfilling demand when and where with what is wanted depends on telecommunications and telecomputing that depend on electric power. Upstream production has been highly grid dependent for more than two generations.

There is substantial effectual demand — ability to pay — for increasing supply of electricity in the US. There are increasingly affordable and effective sources of supply — both fossil-fuels and renewables — to produce this supply. Downstream capacity is pulling hard on upstream capacity… as Rome pulled on Egyptian wheat, as Venice pulled on Asia’s silks and spices, as Chicago’s meat packers pulled on a continent’s farms to push supply to burgeoning east coast cities. Connecting demand and supply over a distance can be — usually is — complicated and costly. Demand capacity stimulates production capacity. The needs of both demand and production spur the creation of distribution capacity. Only when all three categories of capacity are well-calibrated is there something worth calling flow.

James McCalley, an engineering professor at Iowa State University, writes, “There has been little long-range transmission capacity added in recent years… America has world-class energy resources, particularly solar and wind, that can support an electrified vehicle fleet and our growing demand for data centers. Building wires to transport affordable, clean electricity will reduce power costs, keep the lights on in the face of increasingly frequent extreme weather events, and enable an energy and economic transition critical to helping the nation retain its status as a global powerhouse.” The missing link has been the literal link between new local sources of electricity and new local demand for electricity — where these localities are sometimes separated by hundreds or thousands of miles.

Dr. McCalley notes, “During Winter Storm Uri in February 2021, an additional 1GW of transmission ties between the Texas power grid and the Southeast could have kept the lights on in 200,000 Texas homes and saved consumers nearly $1 billion. And over the 2022 Christmas holiday, stronger interregional transmission ties would have saved some regions nearly $100 million and helped alleviate rolling outages instituted by some southern utilities during the winter storm.”

By 2050 my father’s grid will be mostly replaced. My grid will be almost unrecognizable, especially in region’s experiencing significant population growth. The new FERC rule wants to — is trying to — facilitate a streamlined framework for designing and deploying the midstream grid-equivalents of bridges, interstates, ports, docks, warehousing and all the other tendrils that link supply to demand, allowing push to respond to pull with timely, affordable, and reliable flow.

+++

August 10 Update: Last weekend the Texas grid was seriously challenged… and once again prevailed. Bloomberg reported, “Texans are using more electricity than ever and demand during peak hours, when grids can be most strained to meet air-conditioning needs, is rising faster than anywhere else in the country. It’s also the first summer that consumption on the hottest days cannot be met by traditional power plants running on natural gas, coal and nuclear alone, though renewables have kept a comfortable buffer in place. There is still concern that the grid is vulnerable to a combination of circumstances — high demand and power plant outages — that triggered blackouts during a deadly winter storm in February 2021.”

Especially in this context of recurring challenges to current grid capacity, it is not surprising that regional grid operators have reacted strongly to a proposed EPA rule that would further reduce electric generation using fossil fuels. S&P Global reports:

The EPA’s proposal, unveiled in May, would effectively require existing coal-fired power plants without 90% carbon capture to cease operating by 2035. It would also require new and existing gas-fired generating units with a nameplate capacity of 300 MW or larger and an annual capacity factor greater than 50% to co-fire with 30% green hydrogen by 2032, ramping up to 96% by 2038, or achieve 90% carbon capture by 2035… Four grid operators warned that the EPA’s proposed rule “could result in material, adverse impacts to the reliability of the power grid…. If the technology and associated infrastructure fail to timely materialize, then the future supply of compliant generation — given forced retirements of non-compliant generation — would be far below what is needed to serve power demand, increasing the likelihood of significant power shortages…” PJM, for example, noted that 40 GW of dispatchable thermal generation representing 21% of its current installed capacity is at risk of retiring by 2030. New capacity additions made up almost entirely of weather-dependent resources may not be sufficient to keep pace with retirements by the end of the decade, according to PJM.

August 12 Update: S&P Global reports, “US short- and long-term power demand forecasting is becoming increasingly challenging as the power generation fuel mix shifts more toward weather-dependent renewables and energy storage resources, and extreme weather becomes more common, causing power grid operators to adopt new load forecasting approaches.” Access the link to read helpful background on the PJM Christmas Eve surprise and future implications.

August 14 Update: Helpful piece of long-form journalism — and Tulsa-oriented stories — from the New York Times headlined: The Clean Energy Future is Arriving Faster than you Think.

June Personal Consumption Expenditure

In January 2023 American consumers spent 1025.6 billion inflation adjusted dollars on Food-At-Home. In June we spent $1023.2 billion (see red line on the chart below). The take-away from May’s PCE still applies: “For most of the last year our real, inflation-adjusted expenditures for food have been flat or falling… and as a result, food supply chain dynamics have been much more predictable. Current production and distribution capacity has been well-matched with demand.”

Beyond Food-At-Home expenditures, the Bureau of Economic Analysis reports, “Personal income increased $69.5 billion (0.3 percent at a monthly rate) in June… Disposable personal income (DPI), personal income less personal current taxes, increased $67.5 billion (0.3 percent) and personal consumption expenditures (PCE) increased $100.4 billion (0.5 percent). The PCE price index increased 0.2 percent. Excluding food and energy, the PCE price index also increased 0.2 percent… Real DPI increased 0.2 percent in June and real PCE increased 0.4 percent; goods increased 0.9 percent and services increased 0.1 percent.” (More)

The Wall Street Journal offers this summary of recent economic data, “The U.S. economy grew solidly last quarter. Consumer spending, the primary driver of economic growth, rose in June for the sixth consecutive month and is increasing faster than inflation. The labor market has cooled this year compared with 2022 but remains on sound footing.” (More and more.) The Washington Post Editorial Board noticed, “Fed Chair Jerome H. Powell used the words “normal” or “normalization” nine times in his news conference Wednesday to characterize everything from supply chains to the job market.”

Vital proportions

[This is the second of a two-part post on proportional risks involving high volume, high velocity flows in contemporary supply chains. Please see the first part at Pfizer: proportional and functional risks.]

+++

Massimo Franceschetti — channeling Joseph Juran — makes a distinction between the “trivial many” and the “vital few” nodes in a network. I encourage similar attention to links.

Without huge effort it is usually possible to identify a small number of sources or movers (or routes) or consumer characteristics for a Pareto Proportion of demand and/or supply. Pareto noticed that there is a recurring tendency for a small portion of any distributed set to generate disproportionally high outputs for the whole set (more). Roughly eighty percent of Pareto’s peas came from barely twenty percent of his pea plants. One-fifth of all US grocery distributors are responsible for over four-fifths of grocery distribution. Only three US pharmaceutical distributors are responsible for more than three-quarters of pharmaceutical flows. Only three US maritime ports handle more container volume than all the rest combined.

An awareness of Pareto Proportions often answers important questions of who, what, and where, but in isolation these insights seldom explain the how and why of these concentrations. Some of how and why is related to characteristics of network centrality.

Origin implies movement. Destination requires movement. Nodes are usually intersections or, at least, once-upon intersections. A vertex of zero degree has no influence. An edge or arc is a boundary between, verging between, and usually both. A link is a connection, often one of many in a concatenation. Yet in network science literature an edge is typically treated as an incident of a vertex. Edges emanate from vertices. Our path emerges from one place and concludes in another place. We start here, look there, then we consider connections. We tend to focus on places more than on paths.

While this is one valid angle on reality, as a supply chain guy I am inclined to place much more emphasis on the simultaneous reality that we move. Network concentrations most often form from edges accumulated. Origin to destination is to suture steps between here and there. We close gaps between. The sometimes rough, random, ragged path that connects here to there is regularized with use. Edges can grow in magnitude and assume a general direction becoming flow channeled and vectors measurable.

Where many vectors meet, mathematicians speak of eigenvectors and eigenvector centrality (more). The German eigen is most commonly translated by the English “own”, but there is nuance in the German pointing beyond possession to being innate, essential, characteristic. Does the vertex own each vector or do converging vectors own their vertex? Jennifer Goldbeck explains:

The main principle is that links from important nodes (as measured by degree centrality) are worth more than links from unimportant nodes. All nodes start off equal, but as the computation [movement?] progresses, nodes with more edges start gaining importance. Their importance propagates out to the nodes to which they are connected. After re-computing [moving? flowing?] many times, the values stabilize, resulting in the final values for eigenvector centrality. [Bracketed questions are mine, not Dr. Goldbeck’s.]

Contemporary demand and supply networks also demonstrate outcomes consistent with Betweenness Centrality, a measure of which nodes have the shortest paths between other nodes. Betweenness can reveal the most optimal hubs in a complex network. (More, including the three graphs shown below.)

When the Pfizer Rocky Mount facility — or the Abbott plant in Sturgis or the Colonial Pipeline or the Port of Jacksonville (or most ports) or the I-95 (or I-5) corridor — has a problem, my risk assessment is almost always shaped by a sense of network centrality. What proportion of flows for my network-of-concern depends on the node/channel having problems? To serve fuel flows between Atlanta and Baltimore (and Knoxville and places in-between), the Colonial Pipeline is an irreplaceable Giant Component. Within 48 hours it was clear enough that temporary loss of the Rocky Mount node would have critical product-specific consequences but in terms of the sterile injectable market (much less the whole US pharmaceutical network), even when fully operating, the Rocky Mount node would be yellow or orange (not red or deep red) on the network mapping examples below.

One more angle of assessment: In my experience contemporary high volume, high velocity demand and supply networks are especially predisposed to Hourglass Effects. Sabrin and Davrolis explain, “Many hierarchically modular systems are structured in a way that resembles an hourglass. This “hourglass effect” means that the system generates many outputs from many inputs through a relatively small number of intermediate modules that are critical for the operation of the entire system, referred to as the waist of the hourglass.”

I originally perceived — and still perceive — that the Pfizer Rocky Mount facility is a good candidate for hourglass effects. Various materials are gathered in a shared, quality assured space, staffed by technologists, scientists, logisticians, and others with overlapping expertise, to produce a wide variety of specific — but category-similar — outputs (e.g., sterile injectables) by applying a small set of “modular systems” across sourcing, making, and moving outputs.

These modular functions at the waist (I actually prefer: neck) of the hourglass are reasonably common in contemporary demand and supply networks. Grocery distribution centers and maritime container ports and many oil refineries are confirmed sources of hourglass effects. The modularity and adaptability of these functions are fundamental to the efficiency and (in most cases) resilience of contemporary supply chains (see the last page of Sabrin and Darvolis to learn more about why). But when these modular functions receive a direct hard hit there is also a chance that the whole hourglass may shatter (more, see page 113). Below, in the second image, are some personal notions of hourglass effects.

These three risk lenses — Pareto Proportions, Network Centrality, and Hourglass Effects — are obviously not exhaustive. These are personal prescription “safety glasses” that I keep handy in case of potential catastrophe. They help me see through smoke, flame, flood, and worse. Last Saturday when my risk assessment related to Rocky Mount suddenly plummeted from a flood alert to fixing a leaky pipe, friends and colleagues were surprised. I hope this helps explain what I perceived and why I pivoted.

Pfizer: proportional and functional risks

On Wednesday, July 19 shortly after noon local-time an EF-3 tornado did extensive damage north of Rocky Mount, North Carolina. Included in this target zone is a very large Pfizer manufacturing facility (see photo below).

Several initial reports indicated that one-quarter of sterile injectables consumed by US hospitals were produced at this facility. This is not correct. Recently the facility has been the source for one-quarter of Pfizer’s US production of these products — or, perhaps, eight percent of national consumption.

US Pharmacopeia has identified 150 individual medications sourced from Rocky Mount. Pfizer has identified over sixty products sourced from Rocky Mount “with less than 3 months’ inventory in the distribution chain.” (More and more.) On Friday, July 21 the FDA Commissioner said, “Our initial analysis has identified less than 10 drugs for which Pfizer’s North Carolina plant is the sole source for the U.S. market.” Pfizer also explained:

Most of the damage was caused to the warehouse facility, which stores raw materials, packaging supplies, and finished medicines awaiting release by quality assurance. Pfizer is working diligently to move product to other nearby sites for storage and to identify sources to replace damaged raw materials and supplies. Pfizer is also exploring alternative manufacturing locations for production across our significant manufacturing presence in the U.S. and internationally and across the company’s partner network. After an initial assessment, there does not appear to be any major damage to the medicine production areas.

In the hours after the tornado strike Pfizer and several pharmaceutical wholesalers placed a wide range of medications on allocation, restricting new purchases to preexisting patterns.

For the usual purposes of Supply Chain Resilience there is a substantive distinction between Tracking Flows and Tracing Products. Flow impediments almost always threaten time-extended, wide-area, high population consequences. Product problems — in the case of most products — have much more constrained consequences. Product tracing exceptions to this principle (such as water and fuel) tend to prove the rule (exceptio probat regulam). Water, fuel, and similar products involve wide-area, time-extended flows serving high populations.

On Thursday morning last week, some credible information incorrectly signaled that several different products within a similar category (sterile injectables) originated from a single source for one-quarter of national flows. By late Friday afternoon corrected information prompted an understanding that, instead, Rocky Mount was the single source for less than one-tenth of national flows. By Saturday morning — looking at an early list of products available only or mostly from Rocky Mount — my risk-assessment plummeted from flood-level to something closer to a leaking pipe.

As a matter of strict volume, exposed risk was reduced by about two-thirds (8 percent vs. 25 percent). But as a matter of priority, my personal sense of strategic risk fell much more. Does this shift simply represent an exchange of cognitive fallacies? Or are there circumstances where the difference between a one-fourth proportion and a one-twelfth proportion totally — and rationally — transforms the strategic context?

My very fallible intuition is informed by a (potentially) rigorous empiricism regarding a network’s degree distribution. In network science terms my flow orientation is especially sensitive to the presence or absence of a hub (aka Giant Component or Giant Island or Strongly Connected Component and more). Demand and supply networks consist of nodes and links (aka vertices and edges). How connected are these nodes and links? How dependent and interdependent are these nodes and links? Are flows (of information, money, material, or more) more evenly distributed or more concentrated among these nodes and links? What portion of hospitals (demand nodes) are dependent on outputs from any single production and/or distribution node?

One of my favorite network scientists explains:

In most real networks, the degree distribution is highly asymmetric (or skewed): most of the nodes (the trivial many) have low degrees while a small but significant fraction of nodes (the vital few) have an extraordinarily high degree. A highly connected node, a node with remarkably high degree, is called hub… This asymmetric shape of the degree distribution has important consequences for the processes taking place on networks. The highly connected nodes, the hubs of the network, are generally responsible for keeping the network connected. In other words, the network falls apart if the hubs are removed from the network. On the other hand, since hubs are rare, a randomly chosen node is most likely not a hub, and hence the removal of random nodes from the network has a negligible effect on the network cohesion. Substantially, networks with long tail degree distributions are resilient to random removal of nodes (failure) but vulnerable to removal of the the hub nodes (attack).

The Pfizer facility at Rocky Mount is clearly non-trivial, but its degree distribution has been much less than initially reported. Rocky Mount is an important network intersection, but something less than a hub. Temporary loss of flow from Rocky Mount does create more — and noticeable — network disequilibrium for several medications. But crucially this network has been able to preserve its cohesion (remain substantially connected) even with failure of the Rocky Mount node.

What are proportional characteristics that distinguish a hub from a non-hub? Come back soon. I will try out a possible answer for your consideration.