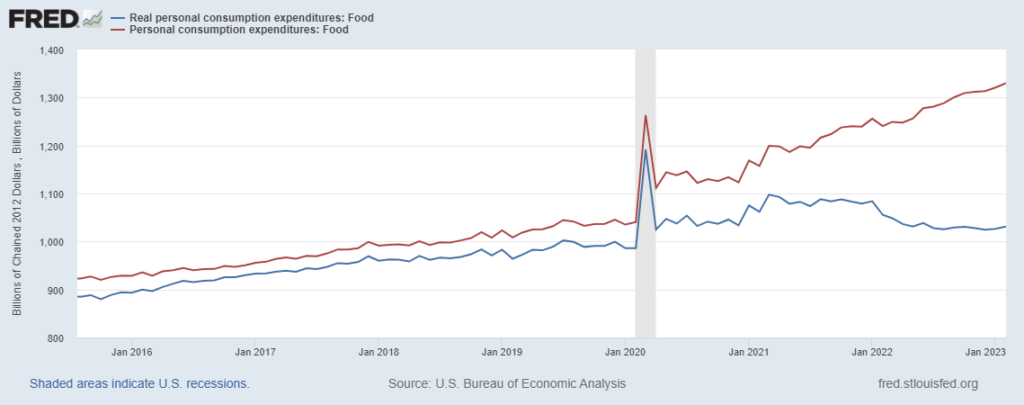
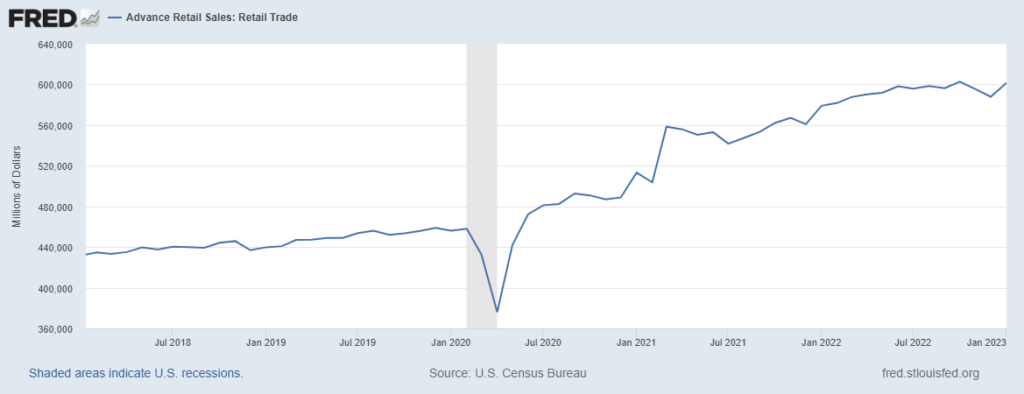
February expenditures on Food-At-Home — adjusted for inflation — have once again increased. An updated January real PCE for food has also been adjusted upward (see chart below).
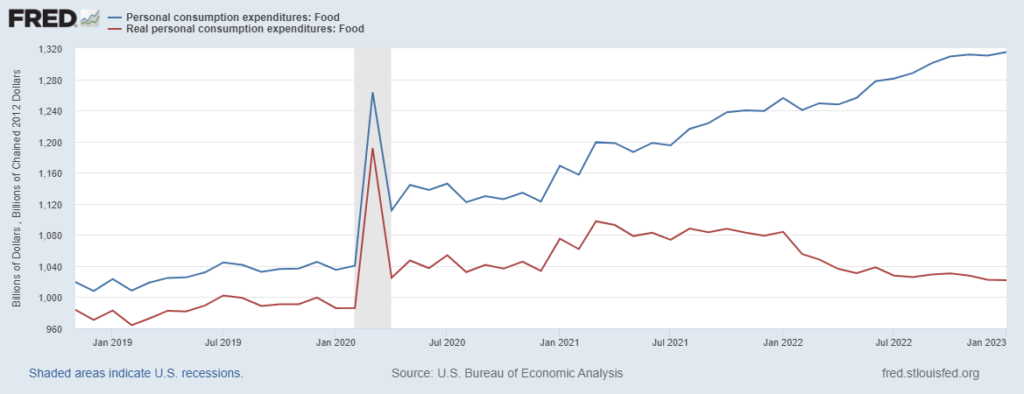
In February 2019 real Personal Consumption Expenditure (PCE) for food was $964.1 billion. In February 2020, just as the pandemic began to emerge, inflation adjusted expenditure on food was $986 billion. Then demand went crazy.
By February 2022 real PCE for food had fallen from unsustainable heights to $1055 billion. This February US consumers spent about $1031 billion on Food-At-Home. You can do the math. US consumers have apparently lifted their floor for grocery purchases… despite significant food inflation and plenty of competition for their spending. It will be interesting to see how the cut in SNAP benefits may shape the slope of the March PCE for food (released in late April).
During February spending for Food-Away-From-Home may have slightly declined (here and here). But strong employment (and demand for employees) and wage growth continue to support above “normal” (whatever that may mean anymore) grocery purchases. Food production, processing, and transportation have increased capacity to support this demand. The personal saving rate has moved up since a mid-2022 trough. Looks like food flows are likely to remain close to these elevated levels as long as employment and wages will allow.