July retail sales — both nominal and real — continued to be strong. The Wall Street Journal summarized:
Overall retail sales—a measure of spending at stores, online and in restaurants—were flat in July compared with the prior month’s revised 0.8% increase, the Commerce Department said Wednesday. But a measure of spending that strips out gasoline and auto sales rose 0.7% last month from June, showing shoppers maintained the ability to spend with much of the spending moving online.
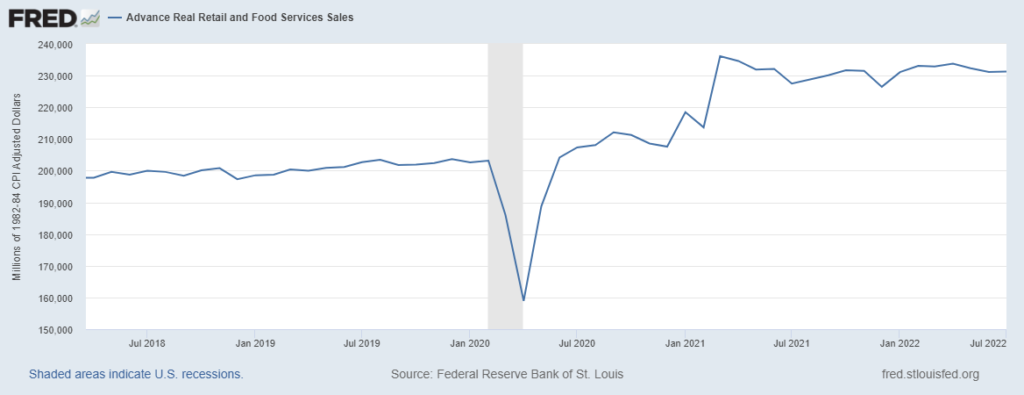
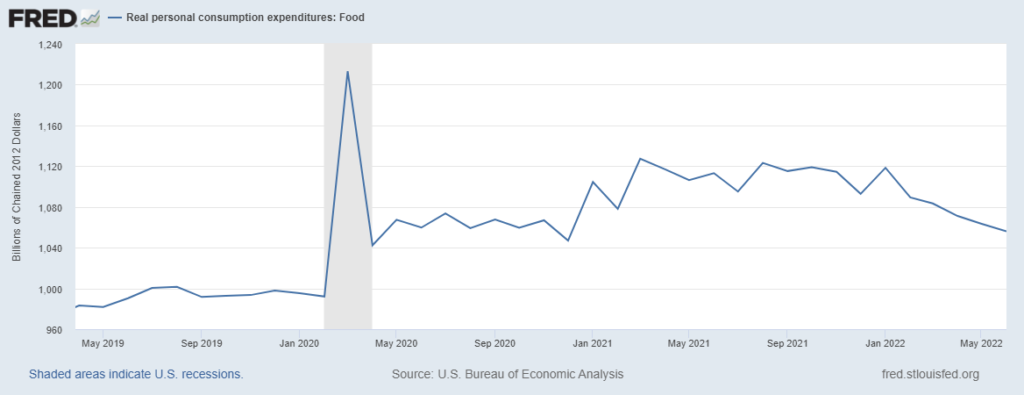
In July 2019 US consumers spent $453,667 million on retail goods and services. Last month we spent $596,765 million, slightly more than ever before. Even when adjusted for inflation, retail sales are more than 13 percent higher than an entirely prosperous — and low inflation — mid-summer 2019 (see first chart below).
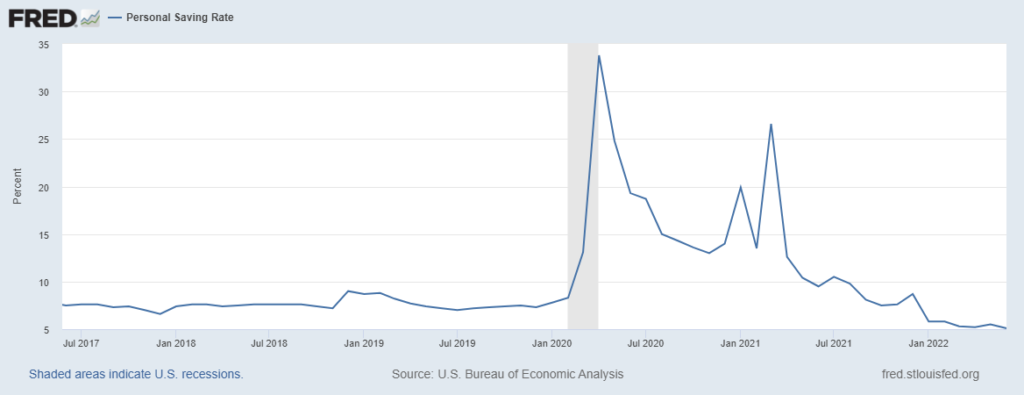
How are we doing this? We are saving less of our income (see second chart below) and we are spending down savings some of us accumulated early in the pandemic (more). I suspect that this spending spree is encouraged by a combination of pandemic-induced pent up demand and strong employment (there are now about 1.6 million more employed than in July 2019). Wages have also been increasing (more), if not keeping up with inflation. (Is this about to change?)
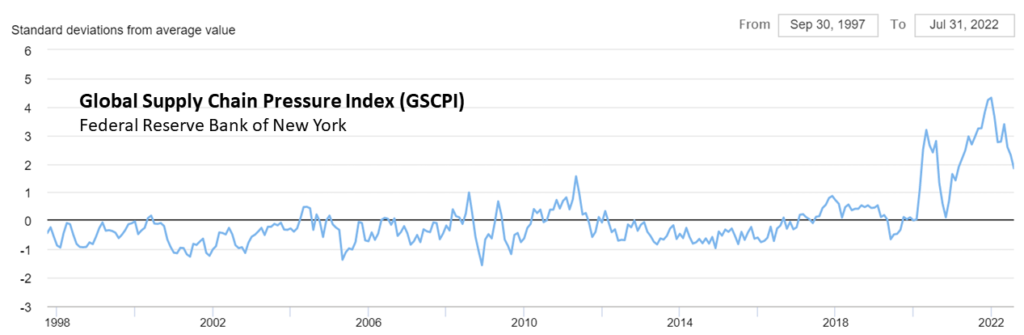
The demand surge that started in early 2021 mostly explains last year’s acute supply chain challenges (more). The persisting high rate of demand — and mismatch with production/distribution capacity — mostly explains inflation.