Author: Philip J Palin

Careful look at port operations

I will stipulate again — as I have here and here and here — that the root cause of recent port congestion has been extraordinary consumer demand. There is also a pig-in-the-python effect associated with delays in East Asia. And… these two factors have been very effective stress-tests for the intricate work of every global port — most dramatically the ports of Los Angeles and Long Beach. Today Bloomberg has done nice work summarizing these interdependent intricacies in an online piece headlined: Every Step in the Global Supply Chain is Going Wrong — All at Once.

As also noted, moving more volume than ever before does not suggest everything is going wrong… and I perceive real progress in the last three weeks with increased velocity and reduced volatility. But this stress-test has certainly unveiled plenty of opportunities for future improvement.

Comparisons over time and space

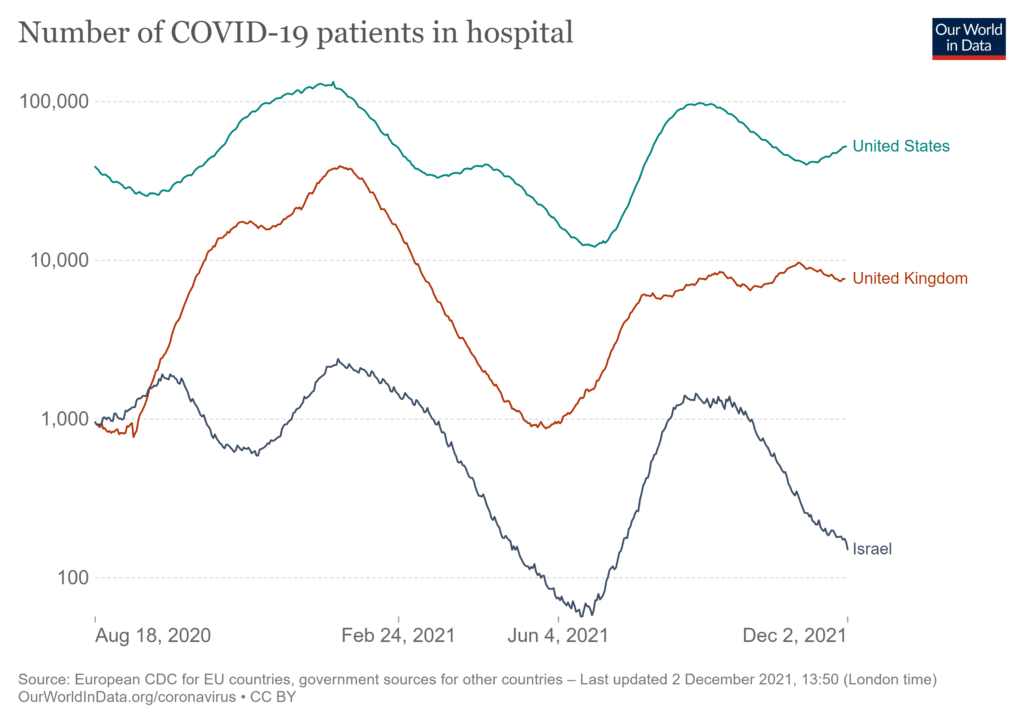
At the start of Thanksgiving week 2020 about 80,000 Americans were hospitalized with covid. The only persons vaccinated were participants in laboratory trials. This week about 45,000 Americans are hospitalized with covid and about sixty percent of US residents are “fully” vaccinated. According to Reuters, the US vaccine consumption rate (doses administered/population) is about 69 percent.

In late November last year the United States was about eight weeks into a so-called “third wave” that would finally peak in mid-January 2021 with more than 130,000 hospitalized. This year we have spent the last few weeks on an off-peak plateau from a late-summer wave associated with the Delta variant. Hospitalizations have surged in some locations (e.g., Michigan and Minnesota), but so-far not nationwide. We do not seem to have significant competitor for Delta emerging (yet).

Another autumn-winter surge in US hospitalizations starting from the current high plateau would seriously disrupt the US healthcare system. The long-term plateauing of UK hospitalizations indicates this is not inevitable. The long-term decline in Israel’s hospitalizations tells us even more about how to avoid another wave crashing into ICUs.

The United Kingdom has a vaccine consumption rate about 83 percent (14 percentage points above the US). Israel is better yet at over 85 percent. Israel was also the early mover on tracking declining immunity six months after vaccination and pushing booster shots for the whole population. Non-Pharmaceutical Interventions are so variable, I’m not confident of meaningful comparisons. But according to the Institute for Health Metrics and Evaluation residents of Israel are wearing masks much more regularly than Brits or Americans (more).

The quickly worsening situation in Germany (more) is worth careful consideration. The German vaccine consumption rate is about the same as that of the US. Mask use is about 40 percent in both the US and Germany. Both nations feature differentiated regional vaccination patterns, leading to higher risks of community transmission where inoculation is well-below the national average. With a population about one-quarter that of the US, Germany currently has more than half as many hospitalized covid patients and some project German hospitalizations will equal current US hospitalizations before Christmas.

Whither thou goest…?

Anxiety as demand accelerant

Fear-Of-Missing-Out (FOMO) is a well-known demand creation technique. In recent years it has been profitably refined and deployed especially by so-called fast-fashion retailers (here and more).

Throughout the pandemic US consumers have demonstrated unprecedented demand for groceries. In March and April 2020 nationwide grocery consumption surged one-third or higher Year-Over-Year for many product categories. Some of this reflected very real channel-shifting as restaurants closed. As occasional empty shelves emerged, FOMO also played its part.

By Thanksgiving 2020 grocery demand had settled at about one-tenth higher than pre-pandemic, with product-specific spikes, such as 18 percent higher for frozen and 28 percent higher for seafood. This made sense (to me). I expected this level of grocery demand and volatility to continue until restaurant dining resumed.

Consumer attitudes toward dining out remain cautious. But actual spending on food away from home reclaimed pre-pandemic totals this May and is now above November 2019 (more). Nonetheless, current grocery consumption is another four percent higher than elevated 2020 demand. I am surprised.

Positive possibility: during the pandemic people rediscovered the joy of cooking and eating with family at home. Probable factor: until recently many Americans had more cash on hand and have been demonstrably ready to spend it. Less positive possibility: people continue to be nervous about stock-outs or worse.

All and more could be at play.

For several weeks I have been in unusually intense supply chain-related discussions, mostly with government officials, reporters, or supply chain professionals. There have been plenty of problems — as previously addressed here and here and here and elsewhere. But while difficulties are real, troublesome, and often frustrating, for me these have been “interesting” problems mostly arising from robust spending rather than profound need or hunger or hurt. I have not been (and am not now) concerned about supply chain “failure.”

But last week I belatedly recognized a deep anxiety with which many (millions, I now assume) are viewing supply chains. This seems to begin with the occasional empty shelf at the grocery store (more). When and why and for how long something disappears strikes most consumers as undecipherable. Then there is inflation. Turkey prices are almost one quarter higher than last Thanksgiving. A tank of gas costs one-quarter more than 2019 and almost one-third more than last year. The cause of inflation and its prospects are a matter of mind-bending debate (more). Framing these intimate encounters with less predictability and higher costs have been recurring headlines regarding our supply chain crisis (here and here and here). Explanations range from simplistic to sublime, but for most consumers personal implications remain inscrutable. Systemic implications can sound like science fiction. (Does anyone else perceive analogies with the Spacing Guild?)

Then, of course, there is the pandemic, which is implicated in many of these problems. Perceiving some kind of connection among these shifting patterns is not just paranoia.

Evolution taught us to be attentive to changing patterns. We were — still can be — a vulnerable species. Being able to perceive not yet fully formed threats gave humanity decisive protective (and predatory) advantages. Observation — watchfulness — is fundamental. But it is our imagination that works to unveil potential meaning behind the feedback. Intellectually we may agree that life is uncertain. But emotionally (perhaps even physically), extended ambiguity can prompt a primitive predisposition for immediate response.

“If this is truly a crisis, what should I do?”

Our watchful range has profoundly expanded. Within this range we can observe more change more precisely than ever before. Whether or not change has become more rapid, our ability to experience change over space and time has certainly grown. Our sense-making — meaning-making — ability has not always kept up with this shift in experiential scope and scale.

How do we constructively, creatively — even collaboratively — apprehend ambiguity?

Given all the bottlenecks and chokepoints now exposed, it may be meaningful to note that the ancient Greek from which anxiety is derived is ἄγχω (ánkhō) meaning “to choke”. When our throats, personal or metaphorical, are constricted we can become obsessed about quickly clearing. But a tracheotomy is seldom needed. A Heimlich maneuver can be an over-reaction. Hyperventilating will further complicate.

A sip of water may suffice. A calm, deep breath can help.

Working with supply chain professionals, this is the worldview, attitude, and behavior that I consistently encounter. The constrictions are real and can be complicated. Unusual shifts in demand have revealed sources of friction that previously were seldom worse than inconvenient. Now, given increased — and volatile — volume, these pinch-points are limiting velocity (both direction and speed) needed to deliver even more volume. The pros are mitigating the problems. Progress is being made. Huge volumes — much more than before — are flowing.

A few weeks ago I was talking to a reporter about my angle on demand as the core cause of the perceived crisis. After I had moved through about a dozen data points with this very supply chain-savvy guy, he said, “Makes total sense, Phil. But you’re not giving me a bad guy to blame.” It was an authentic — and self-critical — complaint. The media is not alone in wanting to replace ambiguity with someone or at least something to blame.

Where objects of anxiety are typically ambiguous, fear tends to focus. Fear will find a bad guy or something to blame. When there is a bad guy or other specific cause, this is helpful. When the actual cause is complicated or complex, this reductionism is counter-productive. It is not a huge leap from FOMO to fear itself.

Too often it is fear itself that transforms a problem-to-be-solved into catastrophe.

Americans are anxious about inflation, about the general direction of the nation, about climate change, and more. Last week I heard from smart folks who have added fear of supply chain failure to this list. They are not alone. In a recent McKinsey & Company survey of business executives supply chain disruptions were identified as the single greatest threat to economic growth. Once again, perceiving potential relationships between these problems is not just paranoia (though paranoia can also be involved).

I have been so engaged working with others to accurately understand and resolve practical supply chain problems — and even succeeding some (more) — I failed to feel this rising anxiety. I am late to appreciate that my more political colleagues have been working tirelessly to assuage this anxiety. Until now, I found many of their efforts annoying: political theater that tended to obscure more than clarify supply chain behavior. I could have been more helpful. I should have embraced the role that anxiety (including FOMO and even “retail therapy”) is playing in strong consumption. I should have been doing my part to reduce the impact of this demand accelerant. I expect some of my political colleagues have found me annoying: blind to the reality of increasing public anxiety.

Anxiety acknowledges disequilibrium. Anxiety can help us locate and label real problems. Anxiety can even motivate reaching-out for help to solve these problems. But we need to learn to deploy anxiety, rather than be deployed by fear.

Almost two centuries ago Søren Kierkegaard pondered Grimm’s Fairy Tale of the Boy who went Forth to Learn Fear. It is a complicated, perhaps paradoxical, tale of fearlessness. The Danish philosopher concluded “This is an adventure that every human being must go through — to learn to be anxious in order that he may not perish either by never having been in anxiety or succumbing to anxiety. Whoever has learned to be anxious in the right way has learned the ultimate.”

We are living in a moment with abundant opportunities to learn the ultimate.

Forty days of flooding (until Christmas)

Many perceive port congestion as a clog in a corroded pipe that needs replacing. I have argued port congestion is the outcome of flooding (more). Our pipes are delivering more flow than ever before. But a great flood has overwhelmed preexisting channels. Along the way, clogs have emerged, showing us where and how current flow capacity is most constrained.

Still, even where there are clogs, flow is usually well-above any prior level. In 2018 the Port of Los Angeles handled a record-breaking flow of just under 9.5 million containers (TEU equivalents). As of the end of September 2021, the port had handled 8.2 million containers. By this New Year’s Eve, the 2021 flow is likely to be one-tenth to one-fifth more than the 2018 record.

Recently 80 (more or less) container ships have been waiting to be unloaded at the Ports of Los Angeles and Long Beach. Early November is always a busy time at ports, but this size back-up is unprecedented. There are many contributing factors. Congestion at East Asian ports has generated a pig-in-the-python push. A pile-up of containers on US docks has slowed unloading new containers. Dock density has increased truck wait-times. An almost fixed number of trucks and truck chassis constrain options for removing containers off the docks. Full shelves at warehouses have slowed unloading of containers and release of chassis (to move new containers). Restrictions on how many containers can be stacked on top of each other disallows a relief valve available at other ports. This list could easily continue. These various points of friction have been building up over the pandemic and especially since Spring 2021.

Now some of our supply chain clogs are beginning to clear. The flood has found new channels in which to flow. There may even be evidence of less precipitation upstream.

Over the last sixty days significant progress has been made discharging containers from LA/Long Beach by rail. On November 10 Union Pacific CEO Lance Fritz said, “We are essentially normal in our international supply chain on Union Pacific from ports to intermodal ramps inland.”  Ocean carriers are deploying sweeper ships to collect empty containers off the docks, freeing room for new containers arriving. With more space on the docks to maneuver, less time is being spent unloading which is also reducing wait times at anchor (“dwell times”). (See the Port of Los Angeles Dashboard and the Port of Long Beach Dashboard.)

The ports of LA and Long Beach are not alone in experiencing significantly increased volumes… and related challenges. This is a global pattern. As congestion in Southern California has worsened, maritime carriers have tried to shift to less congested ports. Import volumes for the ports of Seattle and Tacoma are up one-fifth this year. On the US East Coast, Savannah throughput volumes are at record highs. Port of Charleston is up about 15 percent. Port of Virginia is up over 16 percent. Flows into New York/New Jersey are up 23 percent over last year with much less congestion than Southern California. According to Loadstar, trans-Pacific carrier prices have begun to soften: “The discounting and waiving of premium fees for late November and December shipments caused a mini-collapse in container spot rates this week.” The potential return of a “traditional slack season” is even being referenced.

As with any crisis — personal, institutional, or national — stress unveils strengths and weaknesses that the everyday can obscure. I was recently introduced to inventory and tracking tools that should significantly enhance the flow of empty containers and empty pallets; two separate tools deploying very similar concepts and functions. I bet there is something similar for chassis by now. California DMV is trying to remove friction-points for more folks to qualify for a Commercial Drivers License. A Local zoning ordinance has been waived to allow containers to be stacked higher. More warehouse space is being built. Higher wages are being offered to warehouse workers.

We will enter 2022 with improved capacity for expanded flows. But none of these incremental improvements address the core cause of congestion and its consequences. These are flood mitigation measures.

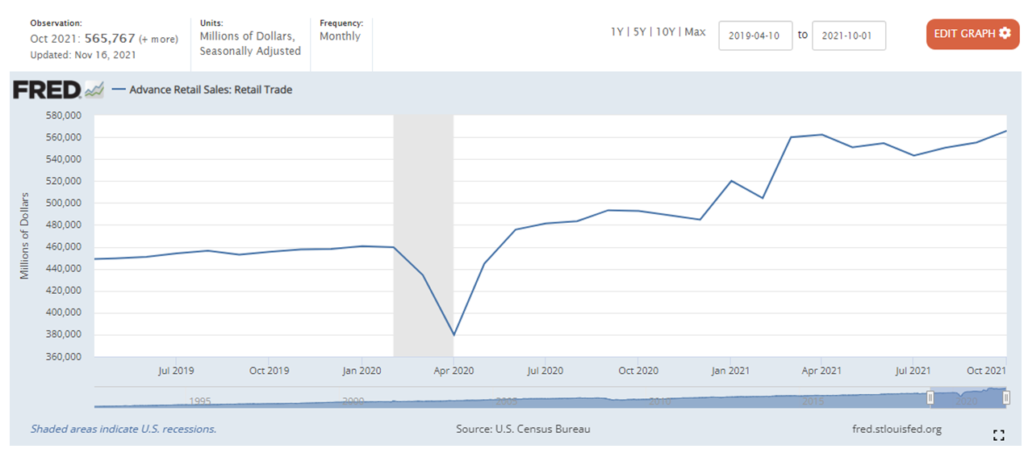
The flood is the result of Americans — traveling and eating-out much less and having much more cash on hand than usual — gorging on more groceries and household “stuff”. The chart below shows the extraordinary shift in consumption of Durable Goods. Nondurable goods consumption is also up dramatically. Many of these goods are produced in East Asia, shipped in containers, and arrive at a few sea ports that were quite reasonably configured and organized for less throughput.

We are beginning to see the flood subside. There are signals that unprecedented pandemic demand is resuming something closer to pre-pandemic volumes and velocity. Durable goods consumption (immediately above) is already off its springtime peak. Consumption of services (and experiences) is closing in on its pre-pandemic proportion of expenditures. The Personal Saving Rate has fallen from an amazing 26.6 percent in May to a much more normal 7.5 percent as of the end of September. Price increases (aka inflation) for the highest-demand products are also beginning to reduce pull, making it easier for push to fulfill demand.

As of today, November 15, we are forty days from Christmas. This Great Flood is off-peak, but there is a huge watershed still to drain. We will still see logjams (especially adjacent to “bridges”, aka nodes and intersections). We will continue to see our excess flow carving new channels. Some long-suffering dikes may yet fail. We will not always be able to receive what we want, when we want it at a price we prefer. But this sure ain’t no drought.

+++

A reader — and evidently client of Goldman Sachs — says my analysis is similar to what they are telling him. Here’s the pull-quote he sent me.

The inflation overshoot has been startling, but so far is attributable to a surge in durable goods prices driven by surprisingly severe and persistent supply-demand imbalances. We do expect persistent inflationary pressure from faster growth of wages and rents, but only enough to keep inflation moderately above 2%, in line with the Fed’s goal under its new framework. The current inflation surge will get worse this winter before it gets better, but as supply-constrained categories shift from a transitory inflationary boost to a transitory deflationary drag, we expect core PCE inflation to fall from 4.4% at end-2021 to 2.3% at end-2022.

Here’s the full Goldman Sachs note. This was evidently published yesterday, but unfortunately I did not see it until about six hours after I posted my note above.

Glad to have independent, distinguished, and credible complementary analysis. But I will also point out, the Goldman Sachs economists are looking at price action, while I am more focused on demand pull and supply push. Related? Absolutely. Chicken or egg? I bet we might differ.

[Original post about 0600 Eastern Time. This addition was posted at about 1500 Eastern.]

Stubborn demand for hospitalization

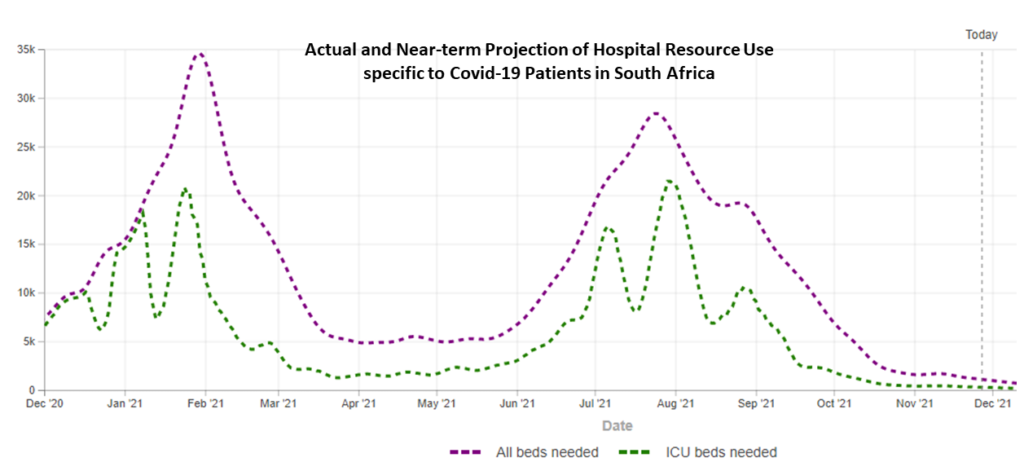
In many places (where I live, for example) covid-related hospitalizations are declining. But this is not the case everywhere and big picture trends are concerning. Patterns outlined last week have persisted.

While the US demand curve has declined from peak-Delta, it has remained quite high and in some places is beginning to once-again bend upward. Please see the chart below for results as of November 12 for seven nations.

This last week Germany confirmed more new covid infections than ever before (more). Resurgent numbers in Italy have prompted discussion of another Christmas slow-down or shutdown (and not just in Italy). The Netherlands is slowing-down now in an effort to head-off a sharper stop later.

The persistent plateau (see below) in the UK seems to be easing, but the churn across the channel is concerning. In the United States it very much depends where you live and what you and your neighbors have decided about vaccinations. Counties in New Mexico and Colorado with low vaccination rates are the current hotspots. But even in highly vaccinated Vermont, Halloween parties are allegedly to blame for an outbreak at St. Michael’s College.

About three weeks ago I advised that, despite improving trends, there was still good cause to minimize travel, avoid interior crowds, and cover our nose and mouth when we cannot avoid sharing interior crowds. For the record, I just spent most of a week in Dallas, where I met inside with many others, and very seldom wore a mask in those rooms. I understand everyone was vaccinated, the room was well-ventilated, and it was not really crowded. But we were certainly not always six feet apart. Only two or three consistently wore masks. Good for them. I am a risk-aware hypocrite. There are too many of us and too few of them.

As noted, demand management is not yet done

The World Health Organization has warned, “Europe is back at the epicenter of the pandemic.” (More)

Germany appears to have a fourth wave starting.

Despite widespread vaccinations, British hospitalizations have remained persistently high. The Guardian editorializes, “Mandatory masking on public transport and in places such as supermarkets should never have been dropped in England and must be readopted: it is a minor inconvenience with major dividends.”

China strikes many as over-reacting, but the increased case-counts are real enough.

The situation in Russia is very tough. Vaccinations have lagged. Non-pharmaceutical mitigation is uneven. Hospitals are filling and deaths are spiking.

For several months, I have been tracking US, UK, and Israel covid hospitalizations. Following is a display of a logarithmic demand curve for hospitalizations in these three nations, now plus Canada, France, Italy, and Spain. These data are reasonably accurate. I don’t have confidence in public data from China and Russia. I can’t — yet — find directly comparable data on hospitalizations in Germany.

The supposed crisis in 550 words (and lots of links)

In the week prior to Halloween (before Amazon with Apple dramatically highlighted supply chain constraints), Tom Keene on Bloomberg Surveillance offered the best concise summary of supply chain realities that I have heard. He said, “It’s microeconomics and there’s ambiguity and there’s give-and-take and, frankly, there is an unknown and we are learning as we go in a natural disaster.”  (Please see below, start listening at about the 59:52 mark.)

Over the last several months I have written many more words. But TK seemed to spontaneously summarize what really matters.

Still, many want more detail than Mr. Keene provided, but more clearly and concisely than is typical of my method. So, as some of you have requested, here’s one more try.

Early in the pandemic US consumer demand fell hard and fast by about one-fifth. Then between May 2020 and about March 2021 overall consumption recovered. Since this March overall demand has increased by another half-trillion dollars per month.  This demand is usually being fulfilled.

But where consumers once purchased lots of services — like travel, entertainment, and eating out — over the last 18 months consumers have focused on a lot more stuff, even twice as much stuff (more).

Producing and delivering this much extra stuff this quickly would have complicated and congested flows in the best of all possible worlds.  But trying to supply this surge and shift during a pandemic has been extra tough.  Constraints on time and space intended to mitigate disease transmission have reduced production and distribution capacity. Disease penetration has been even more disruptive. Shifting upstream capacities created proliferating and unpredicted downstream gyrations 

Persisting supply chain friction has amplified human fatigue and frustration (and even fear) that has further constrained system capacity (e.g., workforce retirements, resignations, reimagining careers, non-participation, and more). Friday Amazon’s CFO explained, “For the foreseeable future, our capacity constraint is actually labor, which is new and not welcome.”

Supply chain constraints are promiscuous and breed additional constraints. Efforts to mitigate this proliferation of constraints (e.g. port congestion) have been complicated by issues of distance between supply and demand and over-concentration of channels (e.g. ocean shipping and port capacity).

These aggregated frictions (and complex feedback signals) are now constraining some fundamental flows, from food to fancy high-tech phones. Which products or categories are most at risk at this point seems to me more and more a betting proposition than anything else. Chop and wind in every channel are sufficient to threaten just about everything on offer. It is a mess. As previously outlined, I do not perceive the mess as an existential threat (except to some smaller retailers). But it is certainly an equal opportunity mess with the potential to seriously complicate economic outcomes for an extended period.

As consumers have less cash to spend and the proportion spent on services increases, overall pull is very slowly beginning to even out (more). Over-time (probably by March-April 2022, barring a more insidious virus or similar) this will result in noticeably improved equilibrium of demand and supply.  If and when volatility returns to something closer to pre-pandemic patterns is another Vegas bet.

This increasingly frustrating experience reveals the dangers associated with over-concentration of supply networks, especially when amplified by distance, and the current lack of effective structures for the exploration and exploitation of enlightened self-interest in managing the global ecosystem of demand and supply.

Demand management is not yet done

My supply chain — or better: demand and supply network — angle on the pandemic emphasizes the need to effectively manage demand for hospitalization. From a network perspective, supply of hospital care is the bottleneck that most often requires mindful exploiting (ala Goldratt). When hospitals are overwhelmed the network experiences more disease and death. When demand for hospital care remains within supply capacity, disease and death can be systematically mitigated across populations.

Hospital congestion is bad. Hospital flow is good. Local to regional demand is the flow factor most readily influenced. As is often the case, supply capacity is finite. Available medical staff is often the acute rate-limiting factor for hospital care.

Most people infected with covid-19 have not needed hospitalization or even much medical care. But a significant fraction of those infected have experienced severe illness (here and here and please see this caveat). The elderly, those with preexisting respiratory conditions, and the immuno-compromised are especially likely to require hospitalization. There have also been mysteriously deadly cases involving the young and seemingly healthy.

Vaccination, avoiding crowded interior spaces, social distancing, reduced circulation, and facial coverings are demand management techniques for slowing and containing transmission vectors across populations. The “consumer” often perceives these as self-protecting behaviors. But from a flow perspective, these are other-protecting measures, even network-protecting measures. Being vaccinated makes it much less likely that a person will transmit the virus to others. Encounters between vaccinated persons are much less likely to give the virus a mutation opportunity. Less transmission and less mutation equals less demand for hospitalization.

I have been tracking hospitalization rates in Israel, United Kingdom, and the United States. Obviously, these are three very different contexts. But each nation was early to make vaccines available and vaccination was well-along before or early-in the spread of the Delta Variant. Data quality on hospitalization can be a problem, but Israel’s small and sophisticated healthcare network may have the best data-integrity in the world. The British National Health Service is also data-savvy. The fractured US healthcare system creates plenty of data challenges, but overtime more accurate, real-time outcomes are being reported.

On October 19 Israel had at least 540 people hospitalized with covid, the UK (mostly England) had about 7000, and the United States had almost 52,000 people hospitalized with confirmed cases of covid. While the raw numbers are hard to compare, I find the logarithmic display (as below) — showing the rate of change — to offer something close to comparable demand curves for hospitalization. All three are doing better than late July or early August. But the numbers remain much higher than had been hoped when vaccination campaigns began. The UK’s persisting plateau is of particular concern.

According to The Financial Times (October 15):

The UK’s weekly death rate stands at 12 per million, three times the level of other major European nations, while hospitalisations have risen to eight Covid-related admissions a week per 100,000 people, six times the rate on the continent. The decision to end compulsory mask-wearing and to pause plans for vaccine passports in England has made the British government an outlier for its management of the pandemic and could account for the worsening trends, according to scientific experts. (More)

According to Reuters, “Four months into one of its worst COVID-19 outbreaks, Israel is seeing a sharp drop in new infections and severe illness, aided by its use of vaccine boostersvaccine passports and mask mandates, scientists and health officials said.

On October 18 the FT also reported:

Scientists are anxiously tracking a descendant of the Delta coronavirus, which is responsible for a growing proportion of Covid-19 cases in the UK, and could be more infectious than the original Delta variant, they say. This AY.4.2 subvariant has only recently been recognised by virologists who follow the genetic evolution of Delta but it already accounts for almost 10 per cent of UK cases. Its prevalence is increasing rapidly, though not as fast as the original Delta variant when it reached Britain from India early this year. (More and more and more.)

Israel has just confirmed its first case of AY.4.2. So far six have been confirmed in the United States. Waaay too soon to raise any alarms.

Quite the contrary, I will confess that my attitude toward covid has shifted in the last two or three weeks. I want to acknowledge that a combination of vaccination and natural immunity — assisted by modest behavioral adjustments — could reduce US viral risks to something akin to automobile injury and death (even less for vaccinated persons). Covid and car wrecks could even compete over bad luck and bad behavior as co-conspirators. (More)

But while my attitude is shifting, my considered judgment is not yet persuaded. It is waaay too soon to decide the next mutation (or two) will not be worse than Delta. As the contrasting accounts of Israel and the UK suggest, it is also waaay too soon to put aside behavioral cautions. Credible data does not (yet) signal anything more than continued uncertainty. So… if you can, get vaccinated if you are not; if you have been vaccinated, prepare to get your booster; avoid interior crowds; give other folks plenty of space; minimize travel; and cover your nose and mouth when you cannot avoid sharing interior spaces. When for practical or social reasons you cannot take all of these network-protecting, other-protecting steps, please do what you can whenever you can.

The Burdens of Abundance

Here are just a few of a recent flood of related headlines:

Port Gridlock Stretches Supply Lines Thin (Bloomberg)

America is Running Out of Everything (The Atlantic)

Global Supply Chain Problems Escalate (Wall Street Journal)

The Supply Chain Crisis and US Ports (The Financial Times)

The Global Supply Chain Nightmare is about to get Worse (CNN)

America’s Broken Supply Chain (Washington Post)

Grocery’s Biggest Players Seek to Reassure on Holiday Supply Chains (Grocery Business)

Despite the intense attention, none of this is new. Supply chain friction has been accumulating for many months — as well reported by each of the news organizations linked above. But the prospect of Santa’s supply chain failing for this Christmas has evidently become a source of civilizational angst. Accordingly last week the White House gave supply chains some sustained attention (and here and here).

Beyond this year’s fads (whether for children or not), what is really happening with our demand and supply networks?

On October 15 the US government reported August sales of $1.68 trillion (“the combined value of distributive trade sales and manufacturers’ shipments”), compared to 2020 August sales of $1.44 trillion and 2019 August sales of $1.50 trillion. Despite this strong spending, the US savings rate remains above nine percent, almost two percent higher than decade-long averages. US demand is strong and has the potential to stay strong for several more months.

Every product category tracked for the broadest sales indicator shows increases from August 2020, especially for food and beverages. The pandemic prompted significant growth in 2020 grocery sales. Just a bit above $72.5 billion in food and beverage sales for August of last year was more than $5 billion better than 2019. August 2021 sales beat 2020 by another $4 billion (now helped by expanding restaurant sales). There are currently spot stock-outs of some grocery items. Given the context, that should not surprise.

Stock-outs are, at least in my mind, different than shortages. We are producing and importing more than ever before. American (and other) consumers apparently want even more. Inventories are often lean or even anorexic. But is it more helpful to say supply is short or demand is strong? There is a disequilibrium of supply and demand. What helps us better perceive and potentially deal with the causes?

The delayed discharge of containers at the Ports of Los Angeles and Long Beach has received generous attention. There are dramatically obvious problems with dock density, operating hours, and overall port congestion. Still… in 2018 the Port of Los Angeles moved a record-breaking 9.45 million containers. In 2019, with trade-tensions constraining flow, this dropped to 9.33 million containers. The 2020 pandemic contributed to a further drop to 9.21 million containers (mostly due to loss of flow in February to May). Through August 2021, the port has moved 7.27 million containers — thirty percent more than by August 2020. The port of LA looks very likely to break its 2018 container record.

More broadly — and for better or worse — the United States is well on its way to importing more volume in 2021 than ever before. According to S&P Global:

Imports to the U.S. by volume grew 5.1% year over year in September, continuing the logistics surge that has caused congestion in ports across the country. This was slower than in previous months but 17.4% higher than September 2019. The comparison with 2020 is now exceptional for a different reason — this time, it is against a post-pandemic surge rather than lockdown-related lows. September also brings the growth rate for the third quarter to 10.2% year over year, or 15.3% compared with the third quarter of 2019. There was an average of 95,341 twenty-foot equivalent units per day in the third quarter. If imports remain at this level, the fourth quarter is expected to show a growth rate of 4.7% year over year, exceeding the record-breaking 2020 holiday season.

Demand is, well… demanding. To fulfill this demand, many flows moving toward demand have increased one-fifth to one-third above pre-pandemic baselines. This sudden and substantial increase creates problems. The number of docks with cranes has not increased nor has the number of trucks. Even comparatively rapid expansion of warehouse square footage has not increased as much as demand. There are also challenges hiring truckers and warehouse workers and many others on which efficient flows depend. But flow volume is still higher, not lower than 2019.

While demand is pulling hard and flow is pushing hard, what about upstream production capacity? As with flow, unusually swift shifts in demand have created several problems. The sudden slow-down in demand for older-version automotive semiconductors in the first half of 2020 has complicated serving increased demand ever since. The increased demand for cutting edge semiconductors in a wide array of high-performance electronic tools and gadgets has been tough to fulfill. There are other examples. There are serious constraints to growth in specific product categories.

But overall manufacturing production has soared in response to strong demand. In August 2021 (in the midst of the Delta variant’s worst effects) 18 of the G20 nations had increased manufacturing production over the same month in 2020. US manufacturing production remains above where it has been most of this century (see related chart below). There are forward going concerns about cost and availability of energy, especially in Europe and China. Disease penetration and/or disease mitigation measures have reduced productivity in some cases (examples here and here and here). Unreliable flow velocity can upset production calendars, even when sufficient volumes are available. In a system-of-systems distress in one place can complicate every place.

Nonetheless, unusually high demand is usually being fulfilled. Demand has effectively pulled more manufacturing forward. More manufactured products are being pushed toward demand. Preexisting capacity — for both production and movement — is not infinitely flexible. But in many cases, more than one-fifth more is being made and moved than in late 2019. In some cases, additional capacity is being developed.

Deficit and disequilibrium are different. Today’s most challenging supply chain problems are caused by many millions of consumers wanting more than ever before. Abundant demand has generated a flood of supply. This flood has overwhelmed some factory floors, ports, and preexisting freight capacity. A flood creates problems, but it should not be confused with drought.

China Manufacturing Production

Coda (October 20)

Derek Thompson concludes America is Running Out of Everything with, “The best solution to the Everything Shortage is to have a policy to make more of just about everything.” Given human desire and capitalist culture, his prescription is well-matched to context. But another possible angle is to want — or at least consume — less.  This too would facilitate enhanced equilibrium of supply with demand… and could even craft a more sustainable give and take between the personal and planetary.