Author: Philip J Palin

More winter worries

Yesterday the North American Electric Reliability Corporation (NERC) released its 2023-2024 Winter Reliability Assessment for the North American grid. Here’s how NERC summarizes its findings:

…much of North America is again at an elevated risk of having insufficient energy supplies to meet demand in extreme operating conditions. The areas identified as being at elevated risk extend over much of the eastern two-thirds of the continent. In these areas, although resources are adequate for normal winter peak demand, any prolonged, wide-area cold snaps will be challenging due to generator outages and fuel vulnerability, extreme levels of electricity demand, difficulties in accurate forecasting and the risk of firm electricity transfer curtailments.

Below is a map with risk assessments for each of the regional bulk power networks.

Bloomberg explains, “The grid’s vulnerabilities have been revealed during storms in recent years, notably a 2021 deep freeze in Texas that left more than 200 people dead. While utilities and power generators have made efforts to weather-proof equipment, the NERC report determined that many are still at risk. Gas and coal deliveries can both be hampered during extreme weather and plants can be forced offline, just as cold temperatures drive up power consumption.”

There was also a very close call late last year impacting MISO, PJM, and SERC (both C and E). Here and here are some related reports by this blog. As usual I tend to emphasize demand dynamics. Here is the FERC plus NERC report on that event. Please read this report. It is clear, comprehensive, detailed, and helpfully frames the strategic (architectural?) and tactical (engineering?) challenges for moving forward. Here is a brief example:

From December 21 to 26, 2022, in the Event Area, a total of 1,702 individual generating units—47 percent natural gas-fired, 21 percent wind, 12 percent coal, 3 percent solar, 0.4percent nuclear, 17 percent other (oil, hydroelectric and biomass)—experienced 3,565 outages, derates, or failures to start… Ninety-six percent of all outages, derates, and failures to start were attributed to three causes: Freezing Issues (31 percent), Fuel Issues (24 percent) and Mechanical/Electrical Issues (41 percent). Of those outages, derates, and failures to start, 55 percent were caused by either Freezing Issues or Fuel Issues… Natural Gas Fuel Issues (a subset, but the majority, of Fuel Issues) were 20 percent of all causes, and issues with other fuels were four percent. In addition to the outages, derates, and failures to start caused by Freezing Issues, those caused by Mechanical/Electrical Issues also indicated a clear pattern related to cold temperatures—as temperatures decreased, the number of generating units experiencing an outage, derate or failure to start due to Mechanical/Electrical Issues increased.

Good news: The current long range winter forecast for North America calls for above-average temperatures and extended extreme cold seems to have become less common than extreme heat (not exactly good news in August). Bad news: our temperature averages increasingly include more extreme short-term events — such as Winter storms Uri and Elliott. In the Northern Hemisphere these sudden onset anomalies are often associated with the polar vortex. Halloween weekend much of the United States experienced a rapid cool-down courtesy of polar weather escaping to the south. As winter deepens, these quick holiday flights — Christmas, New Years, Ground Hogs Day — will get even colder.

Low pressure (not no pressure)

One prominent measure of global supply chain flow finds the least friction in a quarter-century. Please see the chart below. Average viscosity is represented by zero. In October the measure was 1.74 standard deviations below average.

According to the authors of the Global Supply Chain Pressure Index at the Federal Reserve Bank of New York:

The GSCPI integrates a number of commonly used metrics with the aim of providing a comprehensive summary of potential supply chain disruptions. Global transportation costs are measured by employing data from the Baltic Dry Index (BDI) and the Harpex index, as well as airfreight cost indices from the U.S. Bureau of Labor Statistics. The GSCPI also uses several supply chain-related components from Purchasing Managers’ Index (PMI) surveys, focusing on manufacturing firms across seven interconnected economies: China, the euro area, Japan, South Korea, Taiwan, the United Kingdom, and the United States.

Bloomberg explains, “The gauge has clocked nine straight months of negative readings. The cost of moving goods by rail, truck, sea and air has declined from record highs set during the pandemic.”

Good news for many is not good news for all. Maersk has announced significant layoffs. Looking at the October US freight market, Zach Strickland at FreightWaves observed: “After a year of loose conditions, transportation providers are running through cash reserves built up from the freight boom and starting to fall out of the market. Operating authorities for interstate carriers of property have fallen 6% since last July according to Carrier Details’ analysis of the FMCSA data.  The capacity ceiling is falling and will eventually run into demand and lead to increasing service disruptions.” (More and more.)

From August 2020 to August 2022 the US freight market substantially increased capacity to fulfill demand shifts and increased demand overall. Since August 2022 demand has softened. For two years content was chasing very tight spaces. Now space is chasing content. Demand is still decent or better. Shipments have not fallen off the cliff. But we no longer need all the freight capacity that was needed one year ago.

Global Supply Chain Pressure Index (GSCPI)

Threat resilience or vulnerability resilience

Last week I was asked to recommend a well-established private sector, business continuity process that focuses on all-hazards instead of specific threats. I was surprised — chagrined — that nothing immediately came to mind. If you have suggestions, please let me know…

In response I did send along two recent studies:

PwC has published a 2023 Global Crisis and Resilience Survey that found, “It is no longer sufficient for organisations to be in silos as they address today’s complex and interconnected risks. Enterprises are actively moving to an integrated approach to resilience, centrally governing and aligning multiple resilience capabilities around what matters most to the business, and embedding the programme into operations and the corporate culture.” Only one in five respondents self-assess they have a sufficiently integrated approach.

Accenture has recently published a similar analysis entitled Resiliency in the Making. Here’s one of several findings:

The turbulence of the last few years has forced many businesses to address the vulnerabilities in their highly globalized supply and production networks. Our research shows companies are reducing their dependency on sole sourcing strategic commodities in the next three years. Regional sourcing is also bouncing back. Numbers are set to leap from 38% of respondents today mostly sourcing regionally to 65% in the next three years. Leaders are also prioritizing proximity-based hubs that concentrate production facilities and sales within the same region to streamline logistics, improve inventory management and accelerate response to market demand. We found that the manufacturing of products across multiple plants is expected to rise from 41% today to 78% in three years’ time. 

McKinsey research has produced similar findings and related recommendations. Boston Consulting Group has a business resilience practice.

Many more consultancies seek to minimize commercial losses and seize comparative advantage through resilience practices. The consultancies are interested in generating new business. Consultants generate new business by persuasively articulating problems and offering plausible solutions to the problems articulated.

Increased attention to resilience reflects the after-effects of pandemic problems, climate change, increasing geopolitical risks, social-civil conflict, political gridlock, and related economic volatility. Surveys of current and potential clients also suggest unfulfilled demand. Please notice the anticipatory nature of the quotes above. The PwC survey found that only about one-fifth of respondents have “implemented initiatives to protect their workforce or physical assets from the impacts of climate risk.” Even implemented is not completed. Lots of need, lots of consulting opportunities.

The business enterprise that asked about an all-hazards approach currently takes a threat-specific approach. In other words: here’s what we should do in case of this kind of impact to this kind of asset. Were our lives ever that simple? With some rare exceptions, yes — for many firms operating in many places this sort of limited, rather linear risk management (perhaps emergency management) was mostly sufficient.

What has changed over the last thirty-plus years is that scale — both population and wealth — has exploded. As both effect and cause of this increased scale, speed (really velocity, both speed and direction) has dramatically accelerated (more). Given the capital costs required to serve this scale with speed there has been much more intense concentration of productive assets, both in terms of physical places and corporate ownership. As as result, for our most capable firms, risk profiles are much more complicated and extended — increasing the likelihood of experiencing hard hits someplace, sometime. Then, given increasingly tight concentration of capacity, a hard hit in any one place is much more likely to escalate, accelerate, and cascade consequences across the entire networked system.

The same systems that speed fulfillment of high-volume demand will also speed the effects of high-impact hits. Depending on context, our greatest strength can become our greatest weakness.

How do we imagine and prepare for our greatest strength failing?

Vulnerability assessment is hardly new, see Sun-Tzu, Thucydides, Sophocles, and Genesis among many more. The distinction between threat-based and capability-based planning has become common in the post-Cold War era. The now venerable SWOT method even offers the chance to consider potential relationships between strengths and weaknesses before taking up threats. But it is my experience that threats are more inherently motivating of change than any other factor. Fear of losing even trumps the opportunity to win. Some psychological studies find that most humans feel the pain of loss twice as intensively as the equivalent pleasure of gain (here and here). We can blame several thousand years of evolution under quite urgent threat conditions — and our reluctance to really, seriously, self-critically think — especially about variably emerging futures.

Given the scope and scale of our most capable enterprises and the complexity of our most serious threats, a vulnerability focus absolutely makes sense. Many threats are beyond prediction or even much influence, but our vulnerabilities are almost always self-created. We can engage and reshape vulnerabilities to reduce hazards — if we can gin-up the honest self-awareness, courage, key relationships, and practical sustained commitment this requires.

Focusing on all-hazards does not ignore threats. Considering weaknesses or vulnerabilities begs the question: vulnerable to what? Effective risk reduction involves both threats and vulnerabilities. But leading with our vulnerabilities while giving primacy to alleviating vulnerabilities (to typically uncertain threats) requires an uncommon sort of institutional culture.

I appreciate the request. I regret the insufficient response. Look for more on this topic over the next few weeks.

Realistic expectations for China flows

Recently there have been signs of economic recovery in China. For example, here and here and here. It is a huge economy that has demonstrated considerable resilience despite several very hard knocks (some self-administered). It would be a mistake to under-value current conditions or future potential. But I don’t yet see evidence for much sustained, significant improvement in domestic demand, European demand, or US demand (for China’s output). Ergo, why should we expect major growth in outbound flows? I also see plenty of cause for continued — even systemic — sluggishness. This morning I heard Leland Miller give a great summary of a reality that fits what I seem to perceive — and unlike me he has the chops to offer more than wild guesses. The interview begins at about the 40:15 mark. [Please see update below video.]

+++

October 31 Update: The Financial Times reports, “China’s manufacturing activity unexpectedly contracted in October, damping hopes of increasing momentum in the world’s second-largest economy. The country’s official manufacturing purchasing managers’ index came in at 49.5 this month, missing forecasts and trailing a reading of 50.2 in September. A reading below 50 marks contraction against the previous month.” Reuters offers this explanation: “The weak PMI data may reflect some of the weakness in demand related to the housing slump and a slowdown in infrastructure spending,” said Xu Tianchen, senior economist at the Economist Intelligence Unit. “Although there are signs of exports bottoming out, a strong recovery in external demand is probably elusive,” he added. Both new export and imports orders shrank for an eight consecutive month, suggesting that manufacturers were struggling for buyers overseas and ordering fewer components used in finished goods for re-export.”

November 7 Update: The Wall Street Journal reports, “Chinese exports fell 6.4% in October compared with a year earlier, to $275 billion, China’s General Administration of Customs said Tuesday (November 6), a steeper decline than the 6.2% fall recorded in September… Diminishing exports show global demand for Chinese goods is subdued as consumers and businesses contend with slowing growth and higher borrowing costs. Other Asian export powerhouses, such as South Korea and Taiwan, have also reported months of feeble overseas sales.”

Winter Preparations

In an October update Emily Becker with the US National Oceanic and Atmospheric Administration (NOAA) forecasts, “El Niño will continue through the spring, with a 75-85% chance it will become a strong event. A stronger El Niño… means it is more likely that we will see El Niño’s expected thumbprint on winter temperature and rain/snow patterns around the world.”

In yesterday’s Sunday New York Times, three economists argued:

El Niño’s warming builds on top of the already warmer average temperatures that come with climate change. This makes El Niño’s ancillary impacts — higher food prices, more infectious diseases, and even civil war — increasingly more likely, and dangerous. It also provides a warning sign of what is to come as climate change worsens. Our research suggests that this year’s El Niño could lead to events like crop failures that push up to 6.8 million children into severe hunger. (Their original research is here.)

Depending on location El Niño and La Niña periods can have opposite effects (see map below). More rain for the US Southwest and Texas is not necessarily bad news, but major flooding would not be welcome. It is hard to find a silver lining for high heat and low precipitation across South Asia or the Amazon basin or Southern Africa.

Where I sit today, it is a bright day in early autumn. As recently outlined here and elsewhere, the US economy is bustling about and surprisingly strong. Many leading indicators are fine or better than fine. I live in that dark green (cool and wet) spot over the Southeast United States. It has been too dry. We need the precipitation.

Probabilities are not certainties. But we ignore plausible patterns at our peril. When I combine climatological probabilities with troublesome economic probabilities (here and here and here) and geopolitical patterns (here and here and here) — well, an icy winter seems all too likely despite warm sunshine here and now.

Even for those reasonably well-prepared, a collision of hard hits can cascade tough consequences across demand and supply networks. Hidden vulnerabilities are unveiled. Systemic risks are amplified. Given the interdependencies of contemporary supply chains, the ill-prepared are unlikely to be the only ones left dancing (see farther below).

Pulling push persists

To the extent that demand pulls, sizes, and organizes supply — and in most advanced economies, this is mostly the case — then consumption can be said to fuel supply. According to the Bureau of Economic Analysis:

Personal income increased $77.8 billion (0.3 percent at a monthly rate) in September. Disposable personal income (DPI)—personal income less personal current taxes— increased $56.1 billion (0.3 percent). Personal outlays—the sum of personal consumption expenditures (PCE), personal interest payments, and personal current transfer payments—increased $175.1 billion (0.9 percent) and consumer spending increased $138.7 billion (0.7 percent). Personal saving was $687.7 billion and the personal saving rate—personal saving as a percentage of disposable personal income—was 3.4 percent in September.

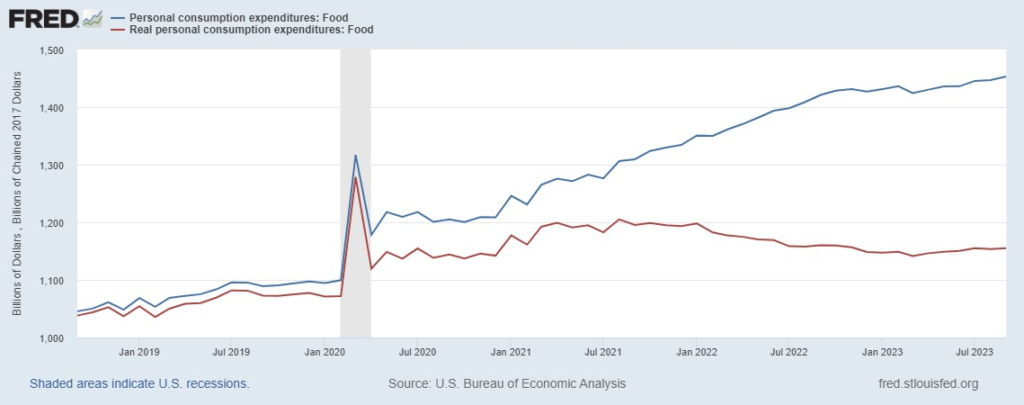
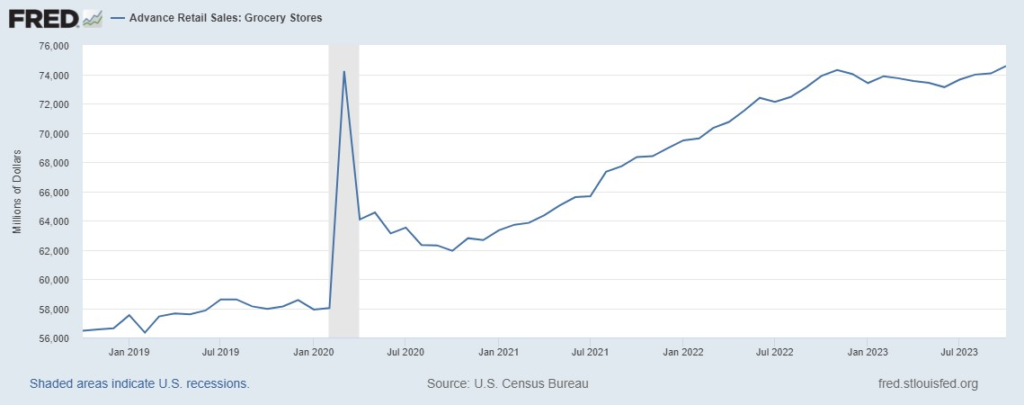
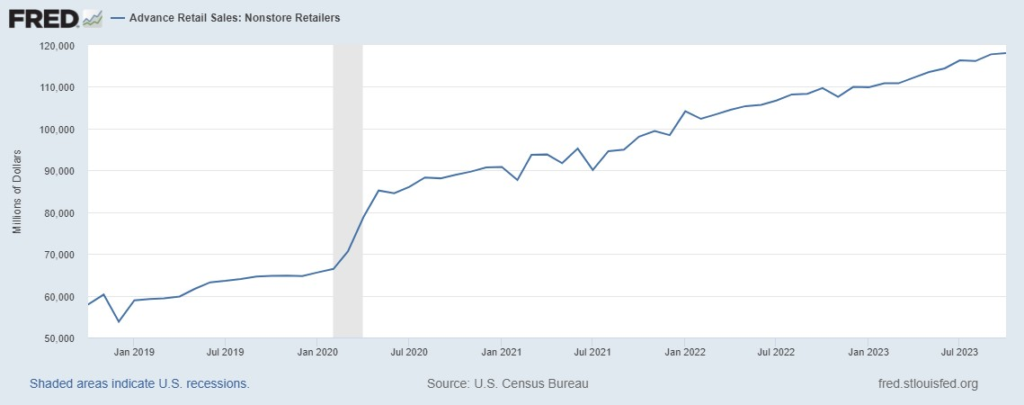
The first chart below displays a five year trend for overall nominal PCE and Real PCE. The second chart is focused on nominal and real expenditures on food-at-home. It is meaningful to me that in September 2023 US consumers spent 1154.9 billion inflation-adjusted dollars on food compared to 1160.1 billion inflation-adjusted dollars in September 2022. This suggests more careful shopping by millions.

Still, on the whole Americans continue to spend more. In September expenditures on cars, pharmaceuticals, and travel showed particular strength (more). Personal outlays grew at a rate more than double personal income. Bloomberg quotes two economists who say, “Consumers continued to live beyond their means in September, with personal spending growth far outstripping income gains … We think that dynamic cannot persist much longer.” I wonder about the implications of potentially very different expenditure patterns by the top two income quintiles compared to the bottom three quintiles.

In any case, this year the overall US economy has continued to show rather amazing strength (see third chart below and more). Wages are increasing. Over 9.6 million jobs are currently “open“. Given recent demand — and the prospects of similar demand — I expect the current level of supply activity to persist at least through the end of the year.

Hearing does not always mean listening

Yesterday I watched/listened to most of a hearing conducted by the Budget Committee of the United States Senate entitled: Bottlenecks and Backlogs: How Climate Change Threatens Supply Chains. The link provides access to a video of the hearing and separate links to the prepared testimony of five expert witnesses. The testimony of Kathy Fulton and Scott Kelly each offer particular attention to supply chain capacity concentrations, a frequent focus of this blog.

In one way or another, explicitly and not, all five witnesses give attention to capacity concentrations, climate change, and supply chain adaptation. There were five different angles on reality. Each angle is worth your time to scan and consider.

I do not recommend watching the video rehash the hearing’s political theater. I did not hear many — perhaps not any — authentic questions. I heard too much posturing and positioning regarding pre-cooked political/ideological angles. I wish the senators would have listened more carefully to the witnesses and given more time to supply chain related questions.

The hearing began shortly after 10AM Eastern Time. I pulled up the hearing a few hours into watching Hurricane Otis explode into Acapulco (more and more and more and see the NASA time-lapse below). Then just as the hearing opened Hurricane Tammy surprised me. A fresh NHC update for this North Atlantic cyclone noted, “sustained winds have increased to near 105 mph (165 km/h) with higher gusts.” This late-stage rapid intensification is an increasing challenge. Just last week a new study reported, “Mean maximum Tropical Cyclone intensification rates are up to 28.7% greater in a modern era (2001–2020) compared to a historical era (1971–1990).” The last two years I have seen a similar threat spin up too close to Tampa. There are plenty of other crucial capacity concentrations that are as vulnerable.

On two screens I watched weird weather swirling with real-time force, while on a third screen I heard a weird debate regarding climate-related epistemology: What can we know? What do we know? How can we appropriately adapt to what we know?

Especially in terms of supply chain risk there can be a range of plausible answers to these questions. It often depends on the particular network, its innate vulnerabilities, and the specific threat (Force-On-Target) involved… an earthquake is different from a cyclone which is different from a cyber-attack which is not the same as a sudden loss of labor regardless of cause…

But we can know, we do know — as Kathy Fulton and Scott Kelly set out (and at least two other witnesses seemed to agree) — that supply chain capacity is increasingly concentrated. This concentration of demand and supply is often happening in places susceptible to extreme weather (climate change or not), seismic activity, and other aspects of punctuated equilibrium (here and here). This increased exposure to risk (and, plausibly, increased risk frequency and intensity) can have catastrophic consequences when, in Kathy Fulton’s words, “these capacity concentrations are disrupted due to extreme weather events, bottlenecks become chokepoints, and the impacts can ripple far beyond the communities in which they exist.”

Too often the human mind is fixated on the urgency (or not) of a perceived external threat rather than the implications of self-created vulnerabilities. External threats are almost always tough to predict and manage. Many of our vulnerabilities are self-created and, as a result, fully susceptible to self-managed mitigation… if we will accept that reality and our related responsibilities.

“The above animation shows Otis in the eastern Pacific Ocean as it’s making its way northward towards the southwest coast of Mexico.  The animation begins with a 24-hour time loop of surface rainfall estimates from NASA’s IMERG precipitation product starting at 7:11 a.m. CDT (12:11 UTC) Oct. 23 when the center was about 400 miles (640 km) south-southeast of Acapulco…” NASA Global Precipitation Measurement

Bad but getting better?

Below are the USGS water gage outputs for the Mississippi River at Memphis. Last week an all-time recorded low was reported (blue line), even lower than last year’s (brown line). According to Yale Climate Connections:

In Memphis, Tennessee, the river dipped to a new record-low water level of -10.81 feet on Saturday, October 22. The previous record was -10.70 feet, set on July 10 during the notorious summer of 1988. That year had America’s costliest drought since at least 1980, with $51 billion in damages. Data for the Memphis gauge goes back to 1933. (Typically, the zero level on a river gauge is set so that values go negative only during prolonged, intense dry spells.)

Extended drought across much of the great river’s watershed (here and here) has meant reduced agricultural yields in many places. (But as the harvest moves into the second half, I am hearing reports of better yields than expected in some places. A few random showers and better genetics are being credited.) Midstream flows of export crops are being constrained by the reduced stream flows (more and more and more). Further downstream an even more urgent threat has emerged as the reduced flow of fresh water is allowing salt water to move upstream threatening drinking water supplies (more and more).

Fragile and Unstable Equilibrium

That’s an accurate distillation. A whole host of flows demonstrate a rough current balance of demand and supply. There are manifold endogenous and exogenous sources of instability. While many flows are huge, there are so many active sources of instability and potential chokepoints it would be foolish to deny innate fragility.

This helpful phrase is how the International Gas Union describes the 2023 market for natural gas:

Gas prices have cooled in 2023, largely due to demand-side adjustments in Europe and Asia, yet they remain above pre-covid and pre energy crisis levels. The shortage of global supply, which was the key reason behind last year’s shocks, is still there: the market is in a state of a fragile and unstable equilibrium. This cooling has been driven by demand contraction, marginal supply growth and infrastructure debottlenecking. Nonetheless, Europe’s growing dependence on LNG has rendered global gas prices increasingly vulnerable to global LNG supply risk.

Most of the IGU Global Gas Report was completed before the October 7 explosion of conflict between Hamas and Israel — with potential significant repercussions for global energy markets. In a last-minute preface, last week the IGU warned:

While Europe’s commendable rapid development of new infrastructure and efficient utilisation of existing gas networks has been critical in rebalancing the regional situation, we should not forget that it does not eliminate the lingering supply risk, as global gas supply remains just as constrained. Undoubtedly, we saw greater focus on energy security by governments, energy companies, and financial institutions, with investments in infrastructure for source diversification and alternative energy sources. This helped to establish a new equilibrium in the gas market, although it remains unstable and seems already challenged by the new conflict in the Middle East between Israel and Hamas.

“Fragile and unstable equilibrium” can also describe flows for rice, wheat (more), diesel, many semiconductors, whole categories of pharmaceuticals, and much more.

+++

October 24 Update: S&P Global provides the following angle on potential instability in European gas flows — even with winter inventories topped off. “The Platts assessed Dutch TTF front-month contract jumped 45% to a 9-month high of Eur55/MWh Oct.13, despite near full European storage levels. This rally coincided with the start of the Israel-Hamas war, announced industrial action at Chevron’s Australian LNG facilities, alleged “external activity” damaging the Balticconnector pipeline. A series of bullish news over the Oct.7-8 weekend sparked geopolitical and supply uncertainty in an already volatile natural gas market.”

Geopolitics, Energy Transition, and Demographic Change

Yesterday the team at Bloomberg Surveillance interviewed Alex Brazier from BlackRock. It was an often nerdy, but strategically valuable conversation. The Great Moderation is over. Mega forces point to significant regime changes. We are on the edge of a generational re-set. We will experience a series of “negative supply shocks”. Geopolitics, the energy transition, and demographic shifts will be the principal drivers. The discussion begins at about the 57 minute mark, it continues for about seven minutes.