According to both the company and the union a new wage agreement has been reached. On top of other contract adjustments mutually undertaken before the early July breakdown in negotiations, this should be enough to avoid a strike, significant economic disruption, and delayed/congested flows of essential healthcare products. According to Bloomberg:
The Teamsters won several concessions important to its members, including eliminating a class of drivers who earned less, air conditioning in new vehicles and an additional paid holiday… The unionized workers also got pay gains. Existing full- and part-time UPS union workers will get $2.75 an hour more in 2023 and $7.50 per hour over the five-year contract, according to the union. Part-time workers will get a raise to no less than $21 an hour compared with the starting part-time wage of $15.50 for 2023 in the existing contract. Delivery drivers will have an average top rate of $49 an hour…
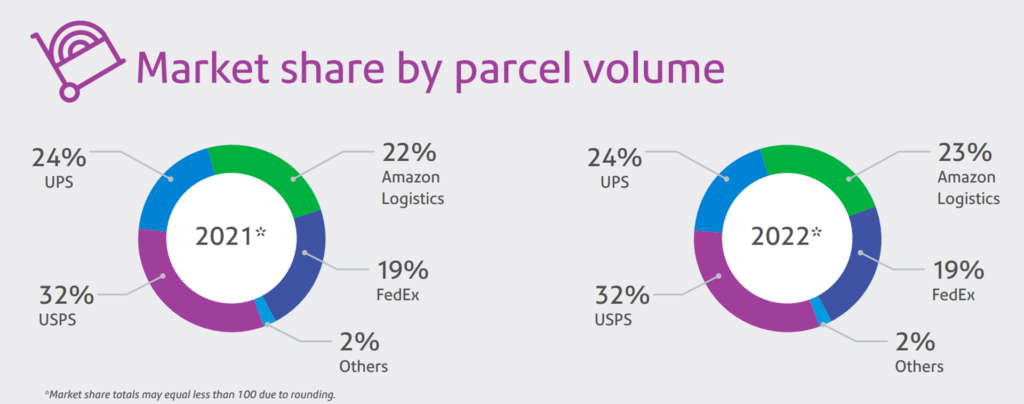
Whew… As previously addressed here and here and here, a strike was going to be bad. Some substantial portion of parcel and other UPS flow capacity would have gone missing. There is no ability to “replace” the roughly one-quarter of national parcel flows operated by UPS. Congestion in parallel channels would have slowed and complicated surviving capacity in many — sometimes surprising — places.