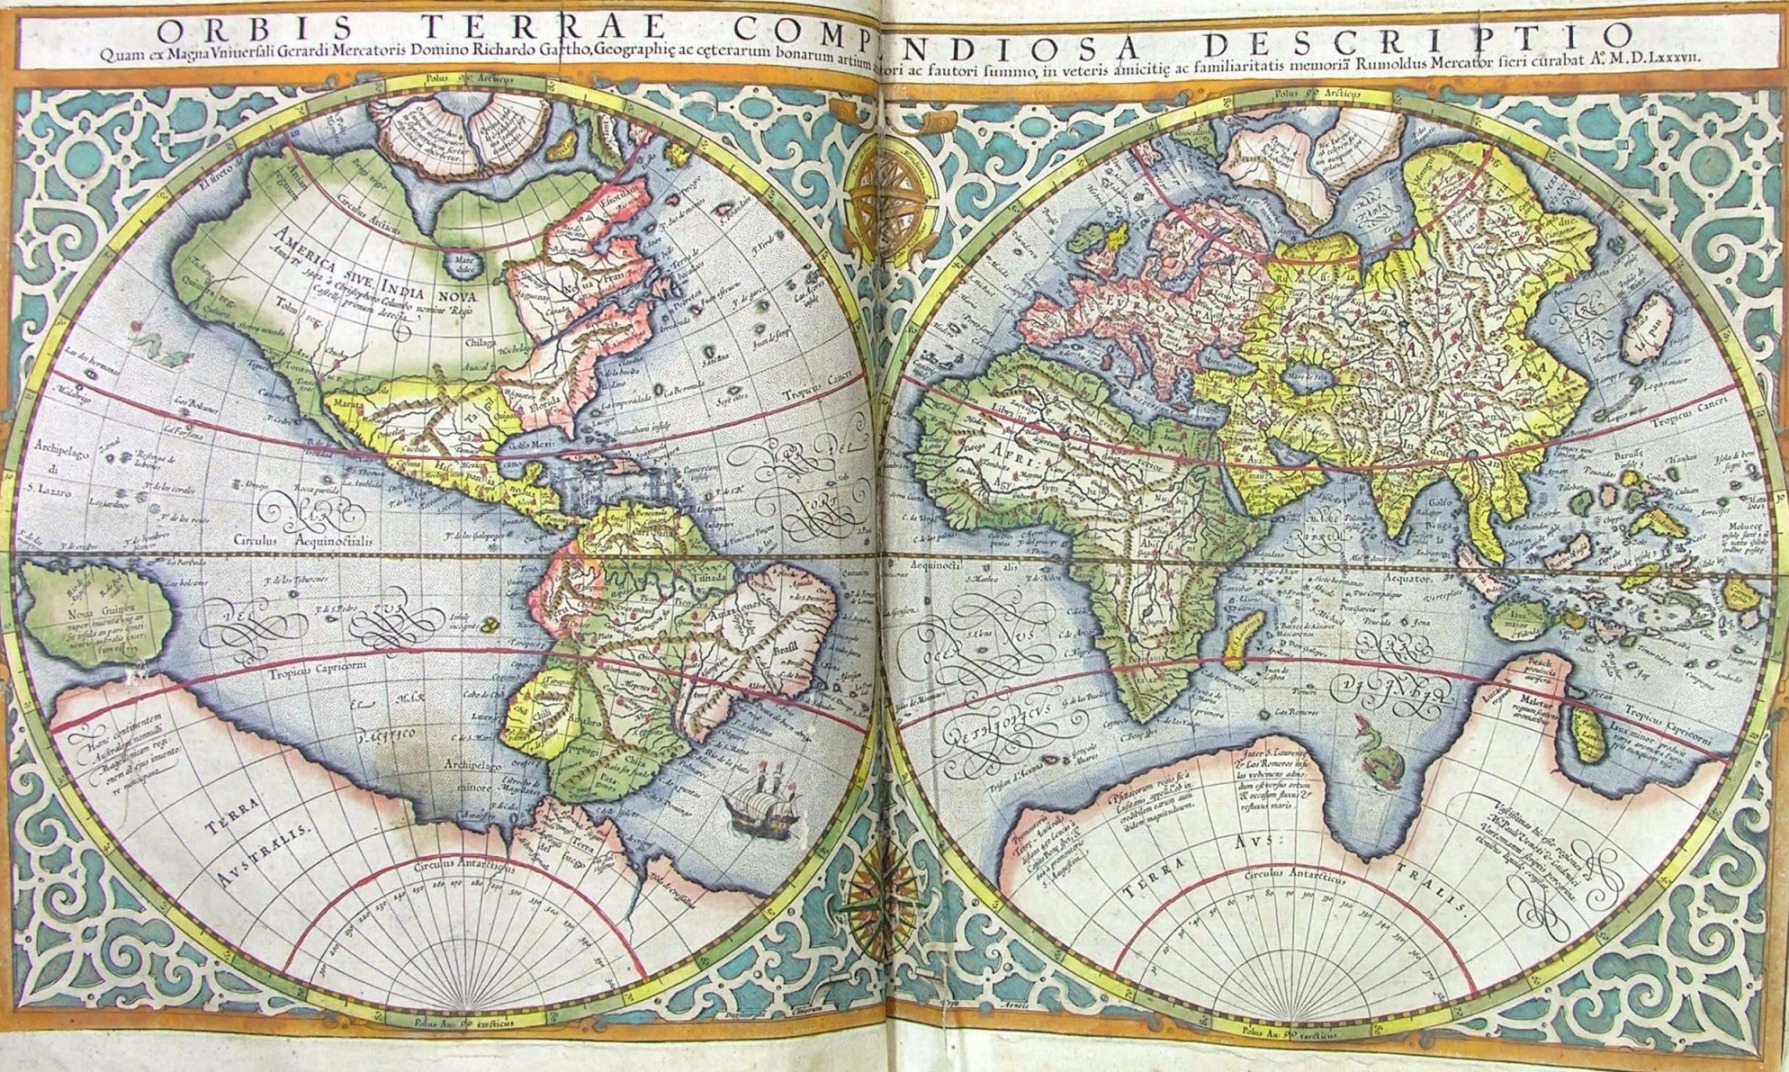
As outlined yesterday, many minds are now working to more accurately characterize supply chain flows. At the enterprise (species) level a multi-billion dollar tracking industry is well-underway. At the ecosystem level maps and models are proliferating. We have probably progressed beyond Ptolemaic methods. But we have not yet achieved (it seems to me) even the rough accuracy of Gerardus Mercator.
But because others are diving deep into complex, data-driven, algorithmically shaped “objective” forms, I can — we can — bring to these increasingly rigorous methods a self-aware reductionist discipline.
To meaningfully consume and digest the rich streams of information now being made available, it is helpful to deploy my own heuristic, my core — even simple-minded — notion of how the world works. In my experience, judgment (especially under duress or urgency) is more likely to recognize external correction, clarification, or correction when externalities are being filtered through a set of lenses for which both strengths and weaknesses are well-known.
I am interested in demand, supply, and movement that matches supply with demand. These three factors are wickedly interdependent and on a global scale beyond my capacity to precisely comprehend. But it helps if I can develop a mostly accurate sense of overall scope, scale, direction, and duration.
To anticipate US flows, I am interested in both domestic and global behaviors. There are important feedback loops each way. Monthly updates are usually the best I can get (I would prefer nearer-term). For demand I prefer financial indicators of money being spent and/or available to be spent. For supply and related movements, I prefer physical instead of financial volumes. But inflation-adjusted financial volumes are often the best I can get. I don’t expect any source of data to be entirely accurate; I am especially skeptical of China’s official data sources.
Is demand increasing or decreasing? How rapidly which way?
How well or badly is supply capacity calibrated with demand?
Are movements of goods well-calibrated with demand (or not)?
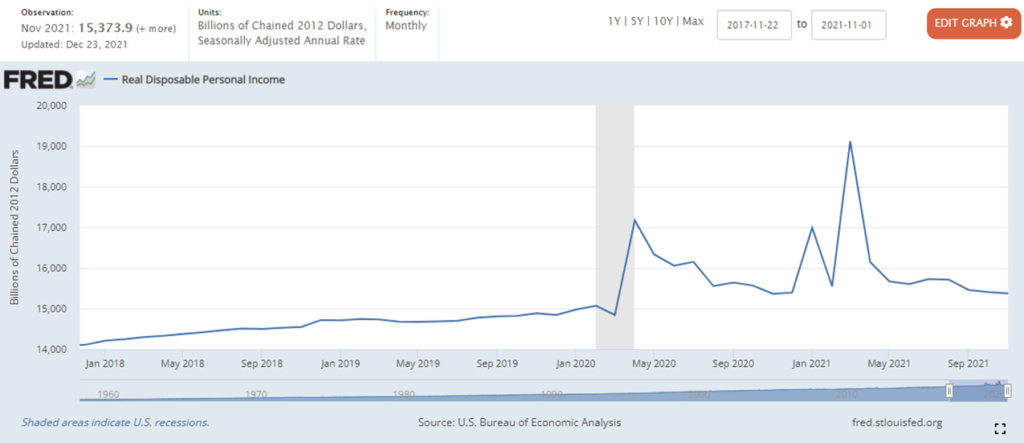
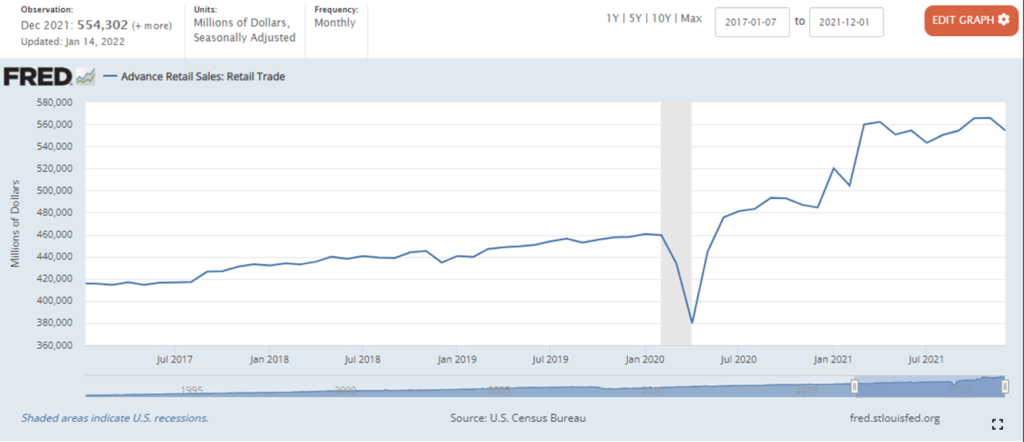
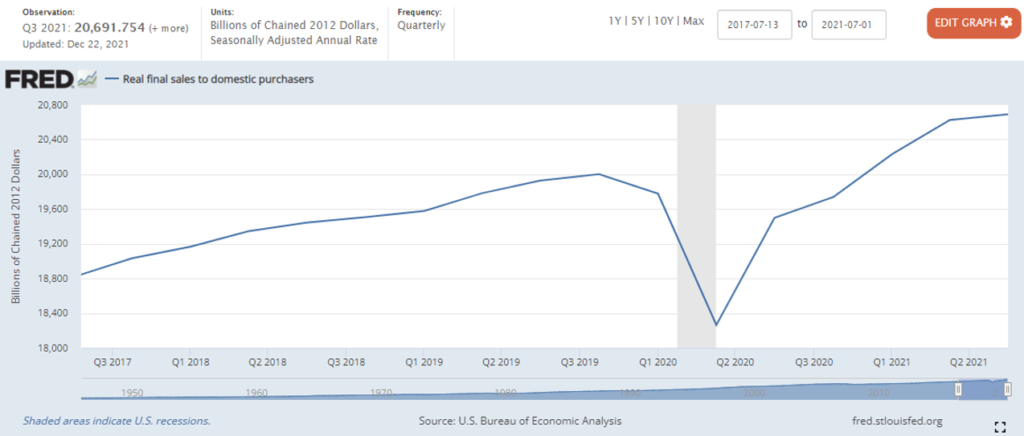
Household disposable income is a helpful measure of recent and potential flows. Here is a delayed measure for the G7 nations (from the OECD). Immediately below is the monthly US measure updated in December for November 2021. There has been considerable volatility in the weeks since. The December results should be released tomorrow (January 28). For me, this is a crucial forward leaning indicator. Supply organizes around demand.
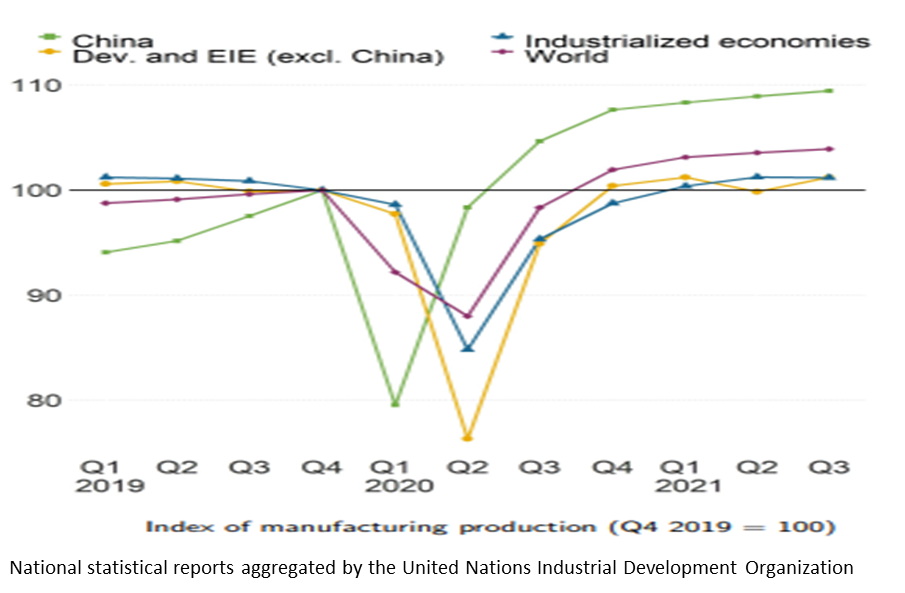
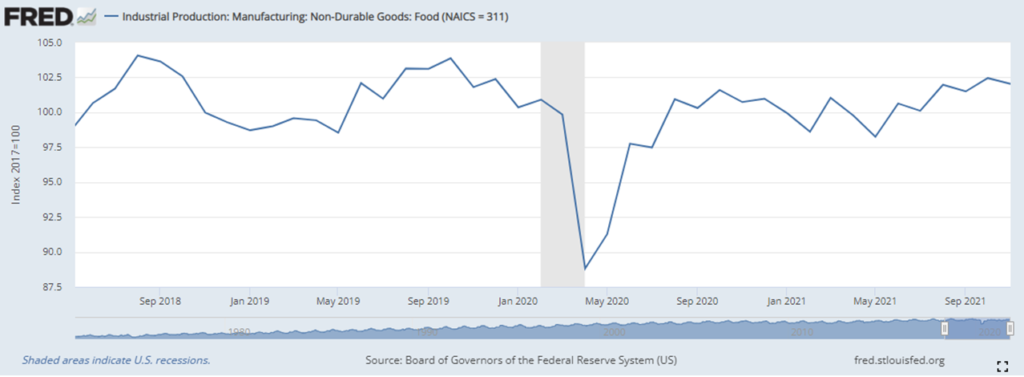
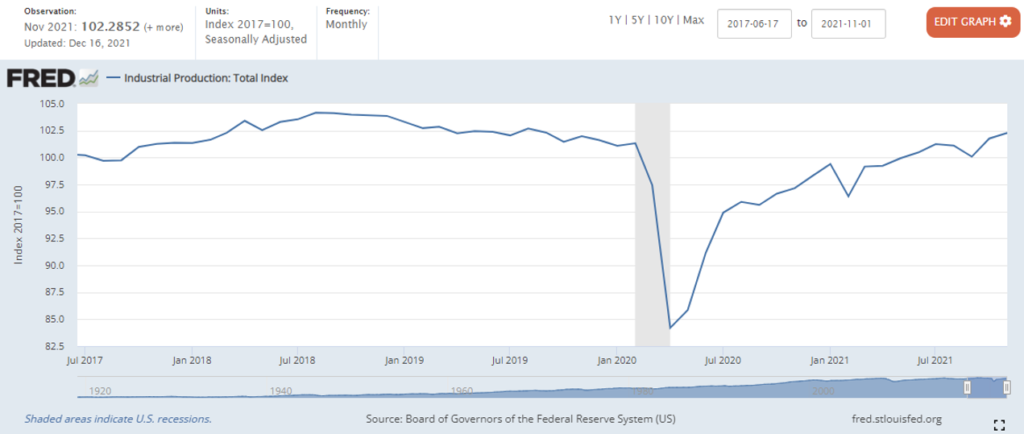
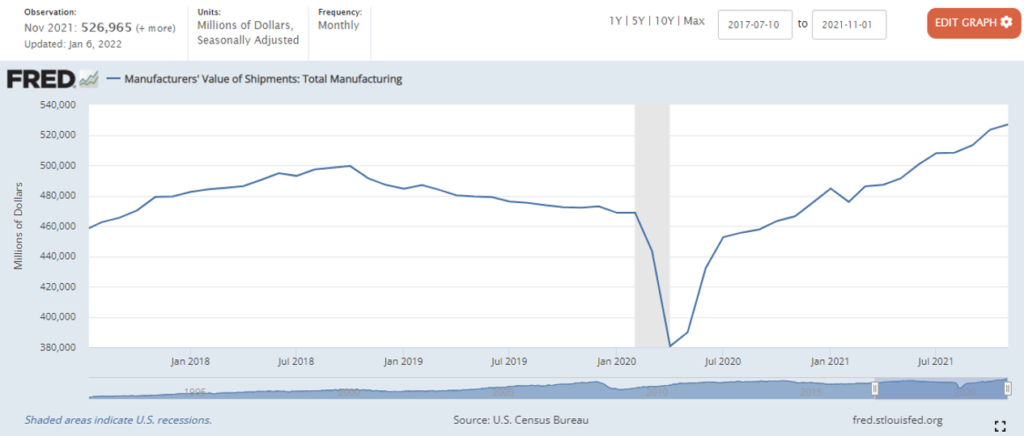
Domestic measures of industrial production are helpful. I am especially attentive to food and beverage manufacturing. But given the significant role of global supply in satisfying US demand, I want something that tells me about total flows serving US consumers. Here’s a new quarterly measure from the United Nations Industrial Development Organization. Too generic? Too unwieldy? Potentially. But again: I want a lens that helps me contextualize other more detailed sources. Immediately below is UNIDO’s manufacturing index organized around a pre-pandemic (early pandemic?) baseline.
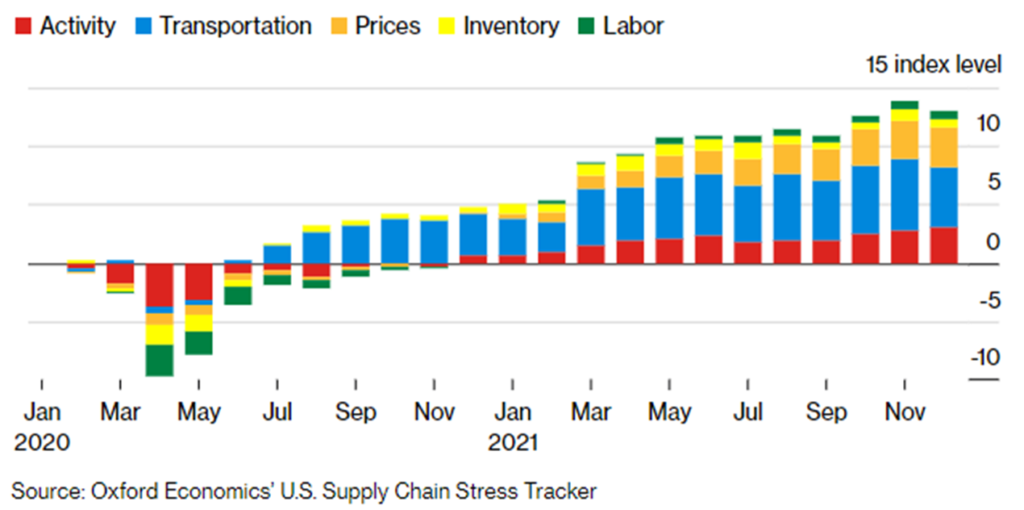
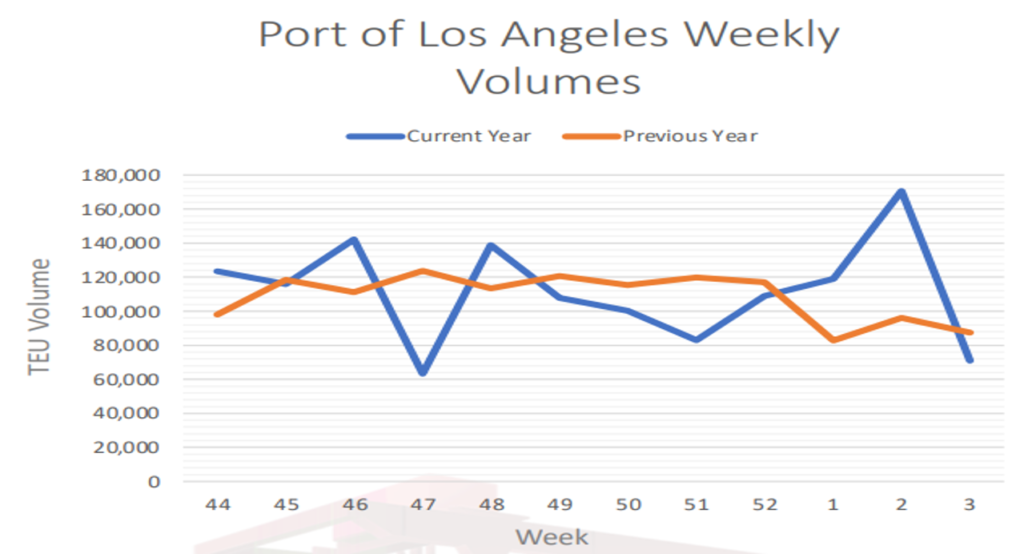
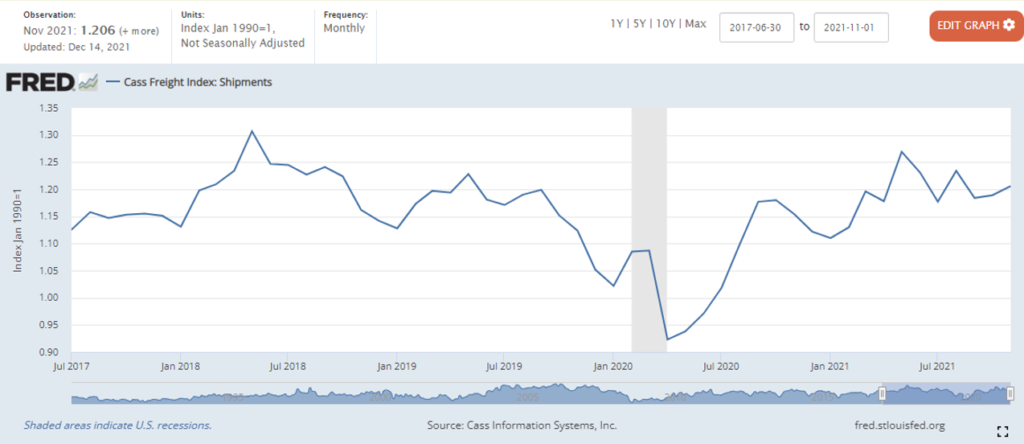
Yesterday I outlined the Kiel Trade Indicator. This is a great resource for assessing how well globally sourced goods are moving toward US demand (or other demand). But given my US focus, I am even more interested in the ability of trucks to deliver. There are many measures (more and more). Below is one authoritative monthly measure: the Cass Freight Index of Shipments.
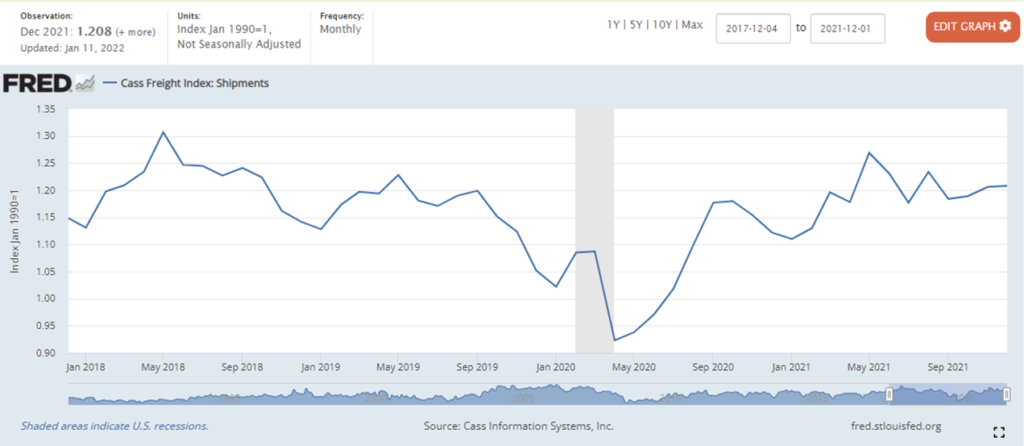
Using the three “lenses” charted above, I discern that during much of 2021 US demand was much higher — even one-fifth higher — than pre-pandemic demand. Current and potential US demand remains a small percentage higher, but is now much more coherent with pre-pandemic patterns. Global supply capacity has expanded since 2020, especially in China. This supply capacity was insufficient for the early 2021 surge in demand, but is mostly sufficient for current US demand. Post-pandemic US freight capacity has not been much different than pre-pandemic capacity (even a bit less than 2018 capacity). So… 2021’s disequilibrium of demand and supply, including flow congestion and related delays makes sense. Now that demand seems to be softening flows should find much less friction, especially once current congestion is cleared. This is more a hypothesis to test than a confident conclusion. But having this over-simplified view helps assess and digest more nuanced measures being generated by more sophisticated analyses. When this simple three-factor test is contradicted by any of the multi-factor indices mentioned yesterday (and others), the divergence should help focus critical attention — and, if necessary, an informed decision — where the most good can be done.
+++
The preceding supposes a network predisposed to equilibrium. This is a fair expectation of mature networks with high volume, high velocity flows, such as most supply chains serving the United States. I also perceive that punctuated equilibrium is an equally reasonable expectation.
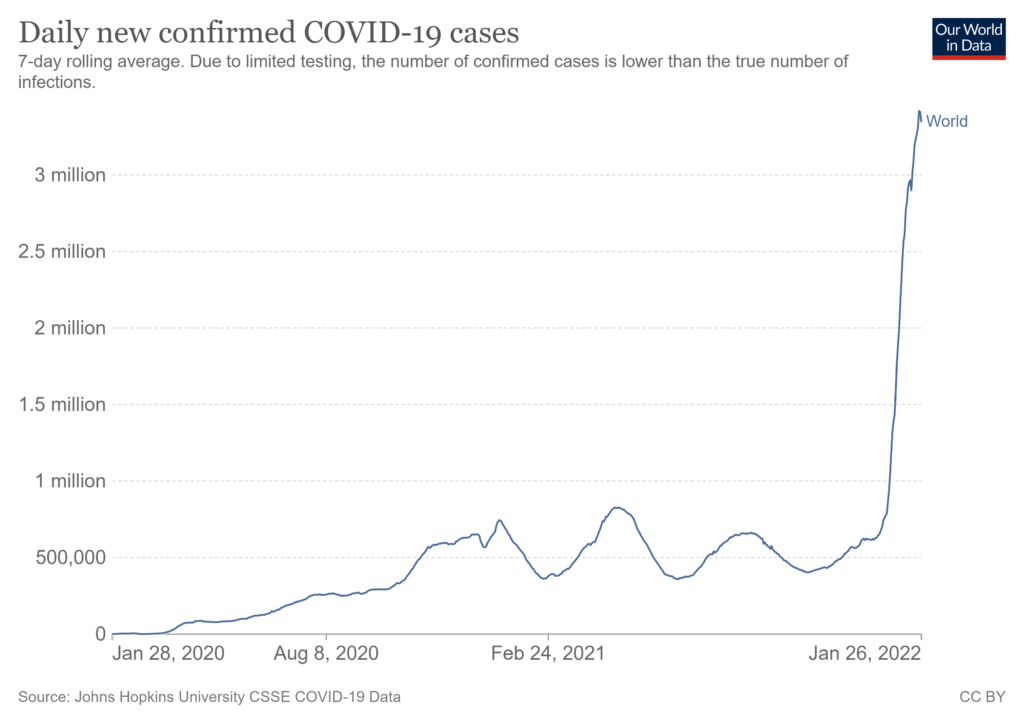
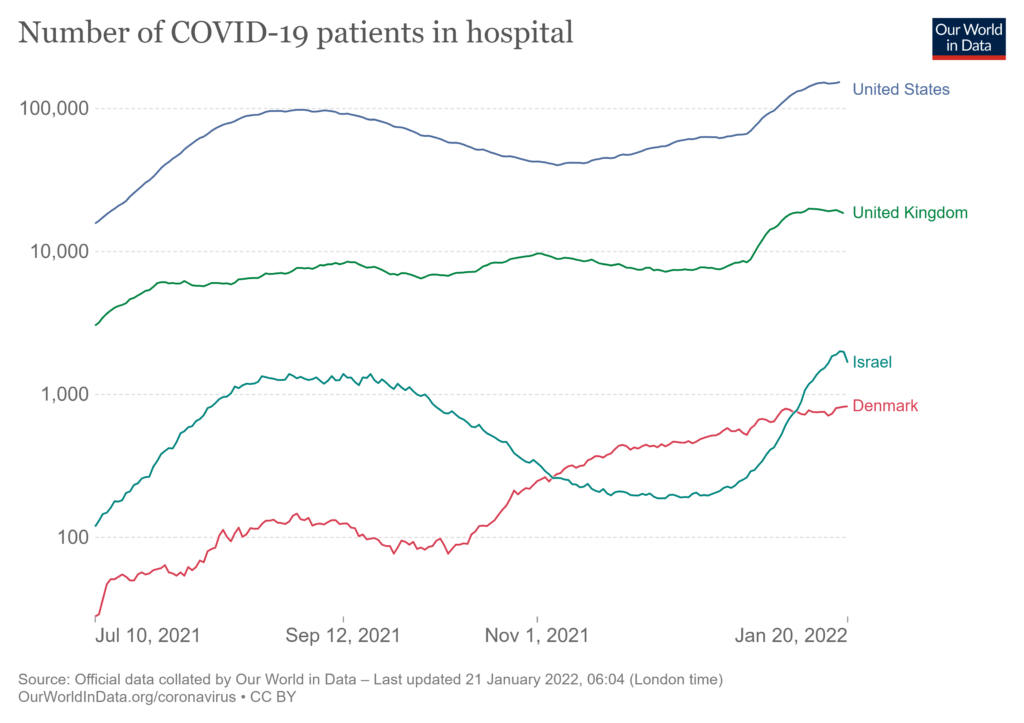
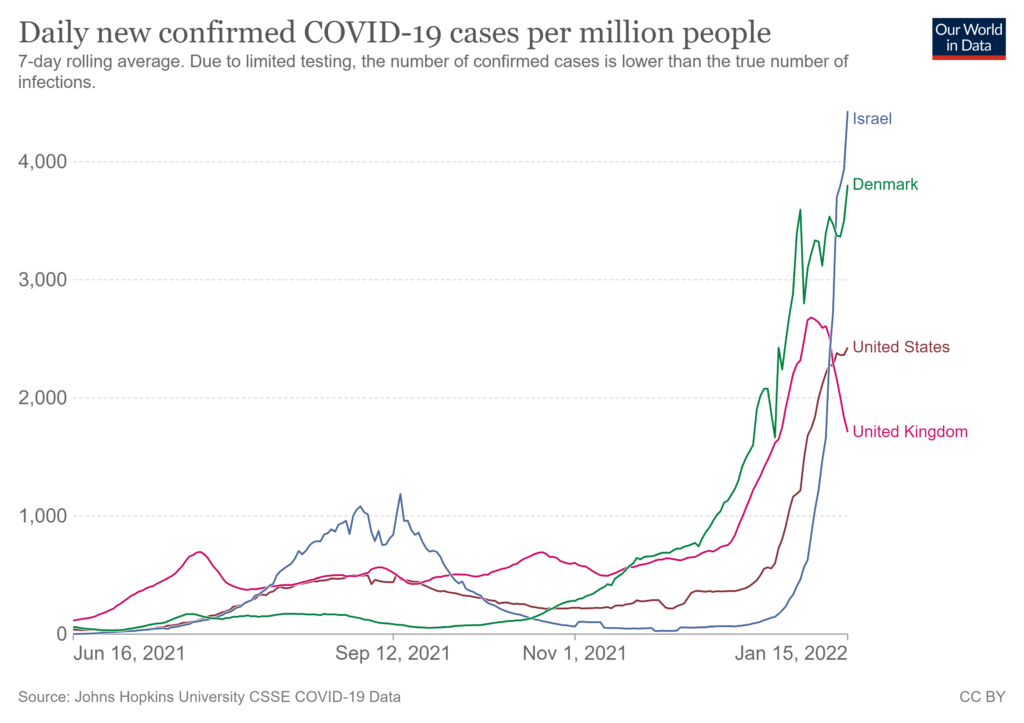
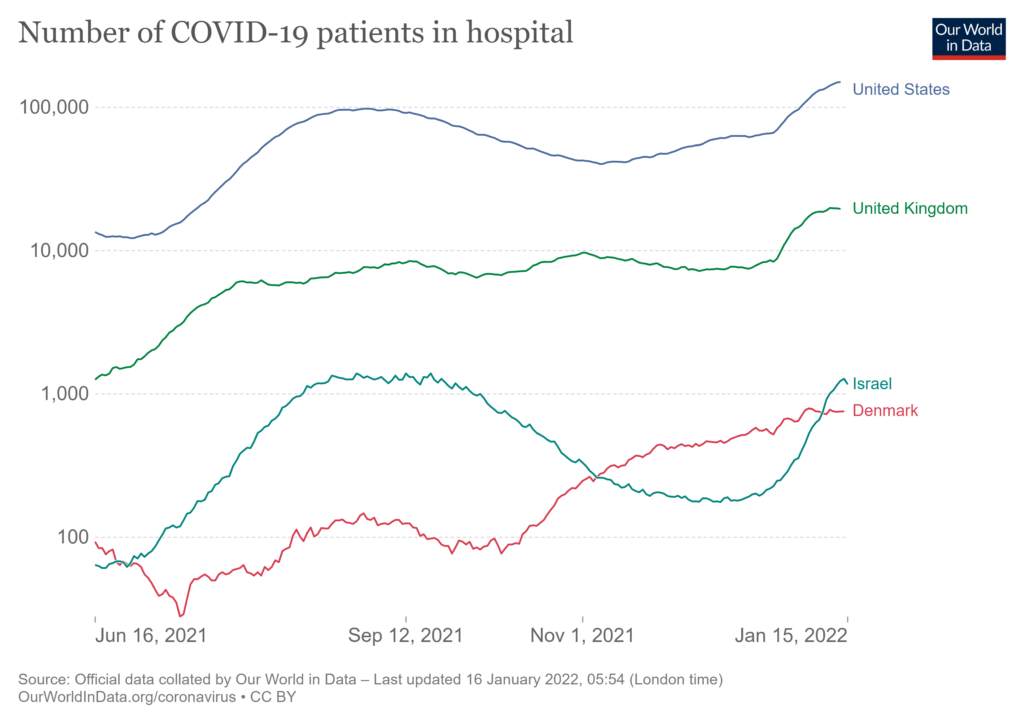
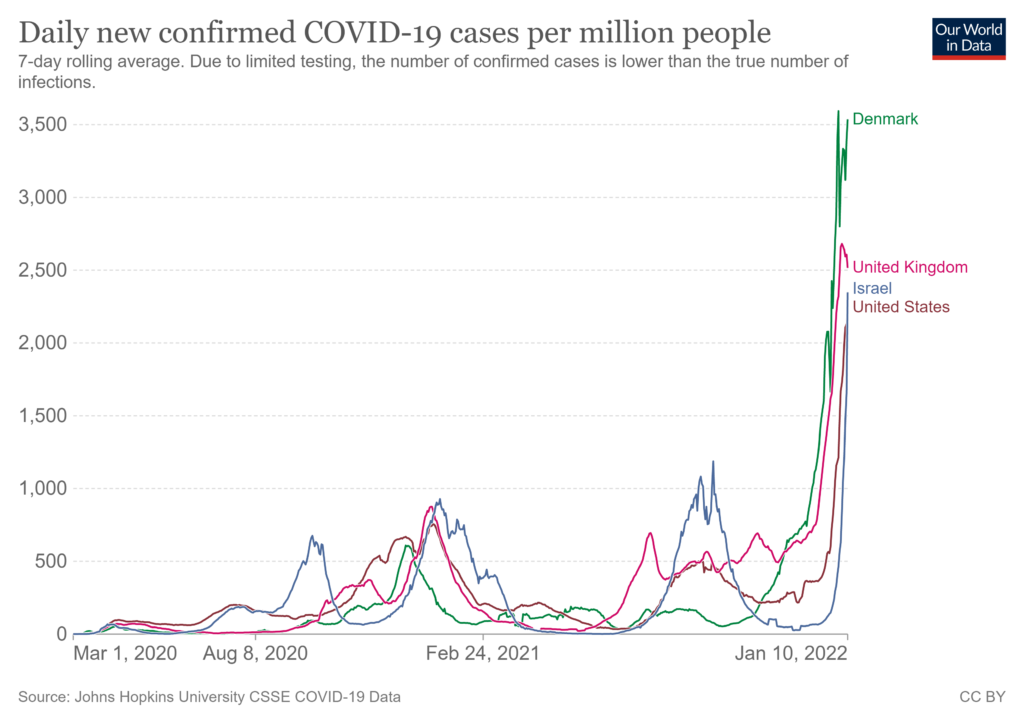
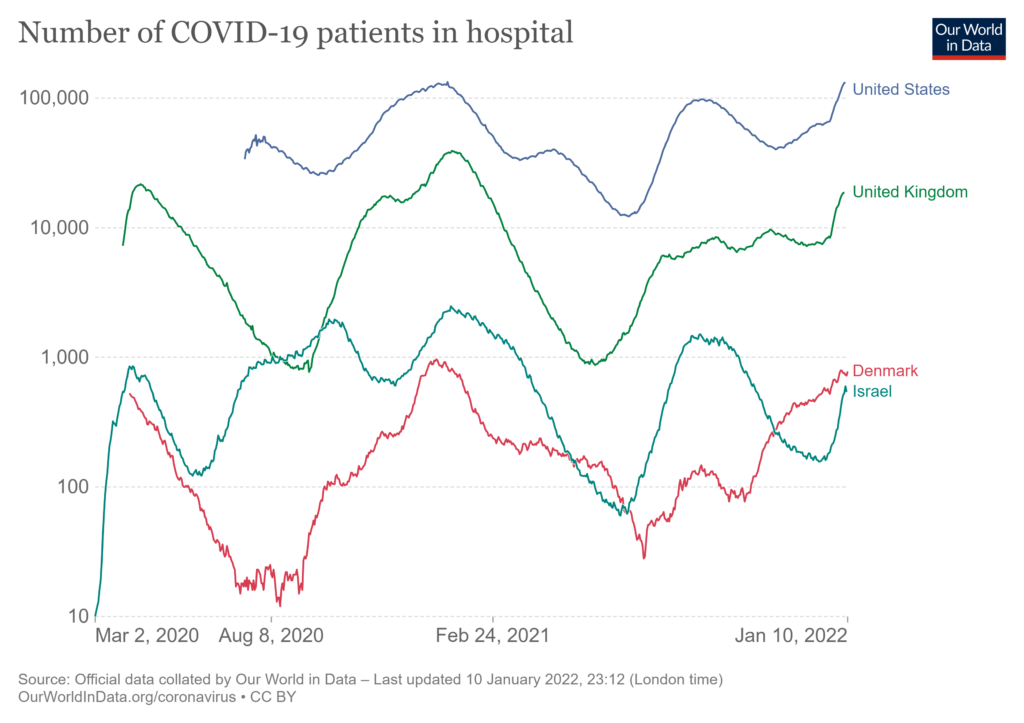
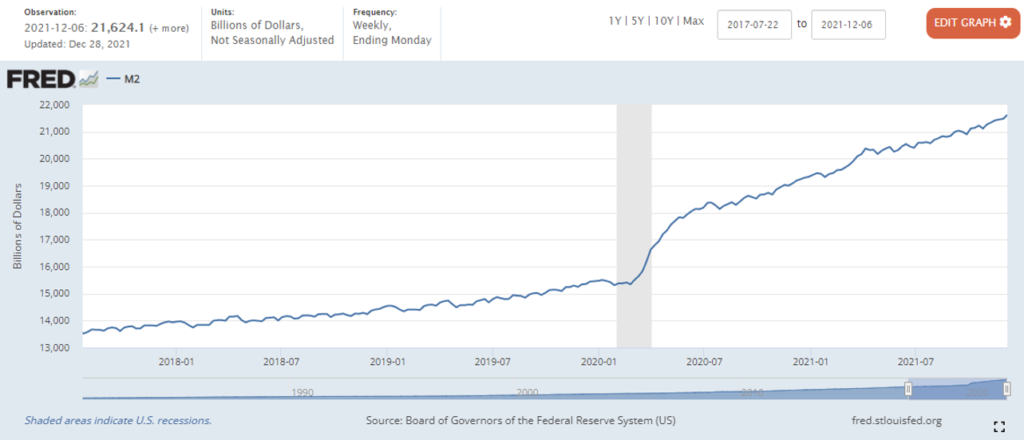
The pandemic has been such a punctuation. Further exclamation marks, periods, and ellipses are certain. The impact of omicron on zero-covid China could be an extended grawlix, painful for the whole world. The potential mutations emerging from the current surge of infections and re-infections is at least worth a triple question-mark. So, below is a fourth chart that I will continue to consider. Geo-political punctuations (e.g., Ukraine or Taiwan) are also possible. I don’t have a chart for those…

