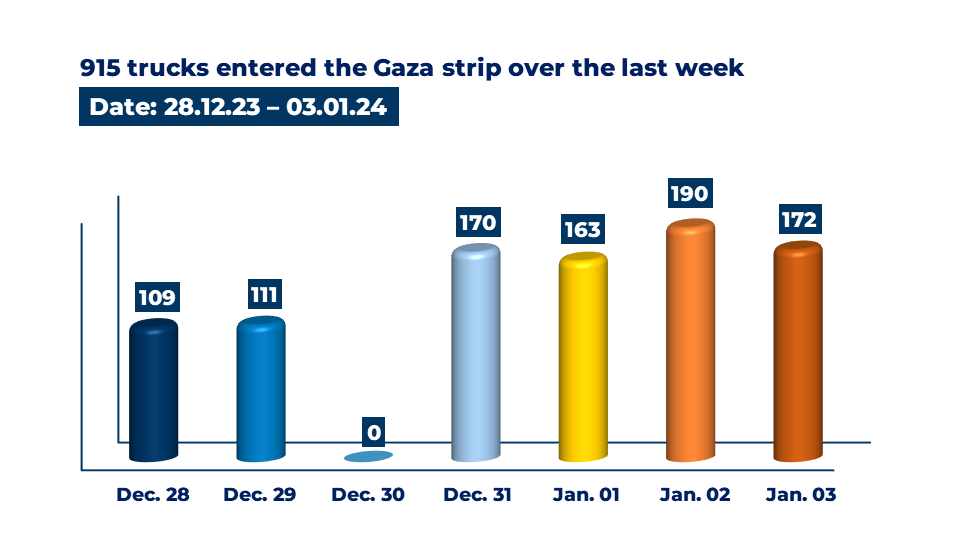
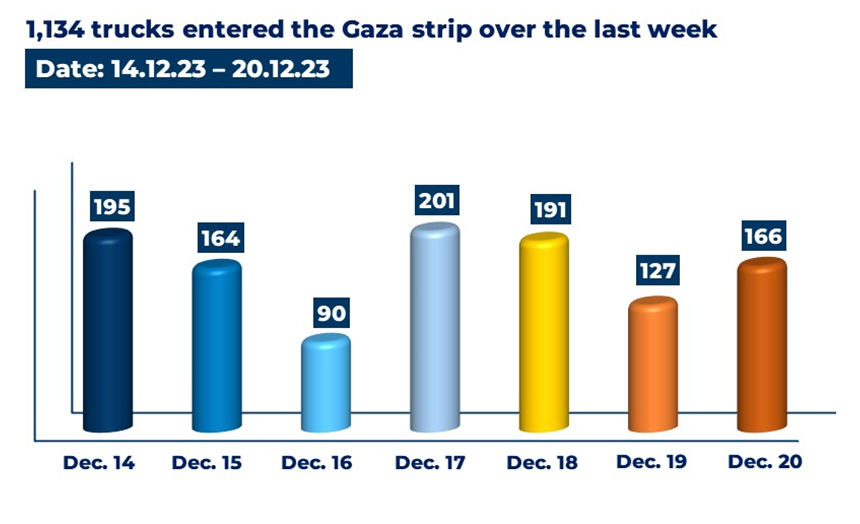
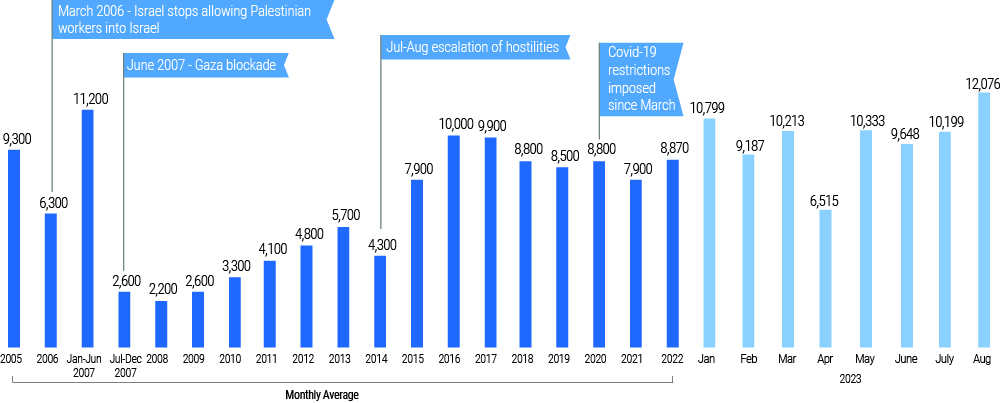
Category: Uncategorized

Gas tanks are almost full

The cold has started. EU residential demand for natural gas has increased. But Europe’s natural gas inventories and inbound flows are good. Storage remains over 90 percent full (more). According to S&P Global, “Norway’s pipeline gas exports to Continental Europe and the UK rose to a 10-month high in November, with supplies now running consistently close to capacity…” US natural gas output (see chart below), including LNG exports to Europe, are flirting with record-breaking territory (more and more). Prices are subdued (see chart below and more). Bloomberg offers, “Fears of shortages in Europe and Northeast Asia have all but disappeared. Weak industrial demand, particularly in China and Germany, and continued increases in fuel supply, are the main reasons for the lack of alarm.”

+++

December 11 Update: Nice round-up of Atlantic-area LNG market from S&P Global opening with, “Lacking seasonal support from the heating sector and ample availability of supply weighed on the global LNG market during the week ended Dec. 8, with sources still awaiting a demand catalyst to reignite activity.”

Catalyst becomes chokepoint

Bloomberg comments, “For more than a century, the Panama Canal has been a catalyst for consumer goods and raw materials flowing between the Americas, Asia and beyond. Thanks to climate change, it’s now a chokepoint.”

This blog has been watching as reduced water-levels have increasingly constrained daily canal throughput (here and here and here). An increasing number of ocean carriers are rerouting to avoid the Panama Canal altogether (here and here).

Suez would usually be next in line for East Asia to the US East Coast (or reverse). But recent Houthi attacks on Red Sea shipping requires comparing drought to drones to Cape of Good Hope gales.

No near-term improvement of Panama Canal flows are likely. December is the start of Central America’s dry season extending through April

December 7 Update: Splash247 reports, “The transit backlog at the interoceanic waterway today numbers just 77 ships, 13 below the average since the 2016 expansion of the locks, and down by more than 50 vessels in the space of just a fortnight. For those in the queue, however, wait times are long, especially for ships waiting for a northbound convoy where average wait times topped out at over 15 days earlier this week and currently stand at 14.5 days.”

+++

December 9 Update: The Financial Times reports, “Simultaneous disruption in the Panama and Suez canals, two vital corridors for global trade, is threatening global supply chains in the run-up to Christmas. Shipowners and importers have warned that a drought in the Panama Canal and a spate of attacks on cargo vessels 11,500km away near the Suez Canal risk constraining traffic ahead of the festive season.” The report also provides a helpful outline of the dilemmas involved in this dual disruption.

Pull persists

October real Personal Consumption Expenditures increased $41.2 billion (0.2 percent). Food expenditures were more subdued (see first chart below). September food-at-home expenditures — adjusted for inflation — were $1154.3 billion. October FAH spending was $1154.8 for a 0.09995 percent increase.

Most media commentary and stock market investors have focused on the implications for inflation, future Federal Reserve actions, and economic growth. Here’s how Bloomberg framed the results:

US consumer spending, inflation and the labor market all cooled in recent weeks, adding to evidence that the economy is slowing. Inflation-adjusted personal spending rose 0.2% last month after a downwardly revised 0.3% advance in September, according to the Bureau of Economic Analysis. Separate data Thursday showed recurring applications for unemployment benefits rose to the highest in about two years. The figures are consistent with expectations that the economy will moderate in the fourth quarter following the strongest growth pace in nearly two years.

From a Supply Chain Resilience perspective what I see is effectual demand vigorously pulling supply. The current PCE trajectory is consistent with the (non-pandemic) slope experienced since about 2015. In 2023 demand for groceries and other Food-At-Home has finally recovered its pre-pandemic slope. Demand for Food-Away-From-Home (see second chart below) has recovered something close to its long-time relationship with FAH.

I was reminded this week that a Complex Adaptive System — such as the US economy — features constant disequilibrium. But, so far, 2023 has been about as close to equilibrium as a system this big and dynamic can get.

Is something close to the current flow sustainable? If a dip in the real Gross Domestic Product can be avoided there is good cause to believe so (here and here and here). Many are concerned that consumers are over-spending and will at some point suddenly pull back (here and here and here). This is almost certainly happening for the less affluent one-third to two-fifths of households. Given the out-sized role of consumption in US GDP this could eventually prompt problems. A counter to this concern is suggested by the final chart below. Overall household debt service payments remain well below long-time averages as a percent of disposable income.

A couple of weeks ago a longish piece in the Wall Street Journal noted, “This year, the supply rebound finally showed up. Bottlenecks eased, rising immigration and workforce participation boosted the labor force, and a pandemic-era boom in newly built apartments hit the market. Those are tamping down goods prices, rents and wages.  Having more workers enter the labor force is a relief valve that is allowing “wage growth to slow without having a big correction in demand,” said San Francisco Fed President Mary Daly.”

Consistent or incrementally increased demand supports consistent employment which pulls supply by paying for recurring patterns of consumption. We should anticipate disequilibrium, but right now the tight rope connecting today to tomorrow has found an elusive sweet spot and winds are surprisingly calm.

White House Supply Chain Resilience Council

From the White House website:

Today, President Biden will convene the inaugural meeting of the White House Council on Supply Chain Resilience, which will advance his long-term, government-wide strategy to build enduring supply chain resilience. The Council will be co-chaired by the National Security Advisor and National Economic Advisor, and include the Secretaries of Agriculture, Commerce, Defense, Energy, Health and Human Services, Homeland Security, Housing and Urban Development, the Interior, Labor, State, Transportation, the Treasury, and Veterans Affairs; the Attorney General; the Administrators of the Environmental Protection Agency and the Small Business Administration; the Directors of National Intelligence, the Office of Management and Budget, and the Office of Science and Technology Policy; the Chair of the Council of Economic Advisers; the U.S. Trade Representative; and other senior officials from the Executive Office of the President and other agencies.

The President made some remarks inaugurating the Supply Chain Resilience Council. Embedding is not cooperating. But you can find a White House video here. There is also more information at the White House website here.

+++

November 28 Update: Mainstream media coverage of the announcement ranged from missing-in-action (WSJ Logistics Report) to mostly positive (Associated Press) to critical (Bloomberg).

EU Natural Gas

In March 2022 I started giving much more attention than ever before to EU natural gas sources, inventories, distribution networks, and consumption. In May 2022 I was invited to listen-in and ask occasional questions while European energy experts tried to decide what could be done regarding their dependence on Russia’s natural gas. Looking ahead six to nine months, in July 2022 I wrote here:

President Putin is depending on decadent demand. He is depending on European consumers and bourgeois politicians to succumb to high prices and chilly room temperatures. Putin has restored General Winter to a prominent place in Kremlin councils… In recent years natural gas has generally provided between one-fifth to one-quarter of the European Union’s total energy mix. There is considerable variation nation to nation. Natural gas fuels roughly one-fifth of EU electrical generation. This ranges from over 40 percent in Italy and Netherlands to less than 15 percent in Germany or barely more than 5 percent in Denmark… Maybe General Winter will descend on Amsterdam to Warsaw with the coldest temperatures in two centuries. He is confident that contemporary European consumers — and voters — are effete, weak, self-indulgent, and can eventually be distracted from any concern for Ukraine… much less what might come after Ukraine. Yesterday the host of the EU energy consultations said, “… everybody understands that this sacrifice is necessary. We have to, and we will, share the pain” (more).

By late summer 2022 a more resilient natural gas flow-map was beginning to emerge, but there was still plenty of cause for concern. In mid-September I outlined, “Efforts by the EU and its members states to reduce energy consumption began in the weeks following Russia’s invasion of Ukraine. As the summer ended, these efforts have escalated (more and more). Much will depend on winter weather.”

Fortunately, General Winter decided to extend his stay on the Riviera. On New Year’s Day 2023, this blog reported:

Europe’s second week of winter begins with Frankfurt breaking 60 degrees Fahrenheit. Autumn in Paris (and Berlin and Amsterdam) was remarkably mild. The EU has consumed one-fifth to one-quarter less energy than usual. Much higher costs have also contributed to declines in demand (more and more). EU natural gas storage facilities are more than 80 percent full (more and more). The price of a March futures contract for natural gas is now less than one-quarter the late August price per the Dutch TTF benchmark (see chart below). (The US Henry Hub price has also fallen.)

By late April 2023 the European benchmark price for natural gas was less than one-fifth its summer 2022 peak. Demand, supply, and winter weather all went much better than we had any good reason to predict in Spring 2022.

This week the first cold wave of the winter has descended on Europe. Next week will be even colder. Five days of snow is predicted for Berlin. Despite this early cold start, the long-range forecast is for another mild winter. Severe Weather Europe summarizes its seasonal forecast with “Europe is expected to have warmer-than-average temperatures over most of the continent. Colder temperatures will be more defined in the northern and northwestern parts of the continent.” Fingers-crossed.

Below is an S&P Global demand and supply update you first saw here in late September. This was a very encouraging set-up for early autumn.

On Tuesday Reuters headlined: Europe’s Gas Crisis is Ended but then added a comma plus “but not the painful adjustment.” John Kemp then reports:

EU and UK gas inventories peaked at a record 1,146 TWh on Nov. 6 which was +190 TWh (+20% or +1.97 standard deviations) above the prior ten-year seasonal average. Storage sites were a remarkable 99.6% full, which was more than 10 percentage points over the 89% average for the previous ten years… It is still very early in the winter heating season, so there is still considerable uncertainty about how much gas the region will consume and how much it will carry over to the summer 2024 refill. But based on storage changes in the last ten years, inventories are projected to be 591 TWh at the end of winter 2023/24 which would leave storage 52% full. Even a very cold winter would leave inventories of 401 TWh (35% full) while a very mild winter could leave as much as 804 TWh (70%).

The wise if not yet wizened Mr. Kemp then comments:

The region’s challenge is how to cope with relatively high gas prices in the medium term if relatively inexpensive pipeline gas from Russia is permanently swapped for more expensive liquefied natural gas (LNG). Greater reliance on LNG rather than fixed pipelines also means Europe’s gas prices will increasingly be determined by weather, business cycles and policies outside its borders, especially in Asia. Europe will always be able to outbid rivals to secure sufficient volumes LNG on account of its higher income and wealth but the prices it pays will increasingly be determined elsewhere.

Pull attracts push. Demand organizes supply. But every pool of pull is limited. Pulling this more expensive flow from here, leaves somewhat less pull to attract that from there.

Infographic: European gas, power demand set for first gains since crisis

Fifth National Climate Assessment

Last week the Fifth National Climate Assessment was released (more and more and more). There is focused attention to supply chains. The chapters on complex systems and economics are especially relevant to Supply Chain Resilience. For example, the concept map below is excerpted from the complex systems chapter.

I need more time with the report. I am struggling some to translate the evidence, arguments, and claims into Supply Chain Resilience parlance, issues, and strategies. Climate-related threats are obvious. But the Assessment’s treatment of supply chain vulnerabilities — and opportunities — is more derivative than well-defined (which is not necessarily a criticism).

Whatever my conclusions, you should reach your own. This sort of document — this sort of challenge — requires rigorous meaning-making by each person. This will be the foundation of those shared choices (and non-choosing) that will frame and initiate individual and collaborative action (or not). Every day each one of us is experiencing this story. How do we discern its meaning — including for supply chains?

The Assessment opens with a poem (please find the poem below the concept map). The poet reminds us, “If you sit by the riverside, you see a culmination of all things upstream.” Much later in the Assessment we read, “Upstream portions of supply chains encompass the range of activities needed to produce the product or service, while downstream portions encompass the range of activities needed to get the product or service to its final consumer.”

Supply Chain Resilience watches this river. More important, we work this river. We have long known that the river changes constantly (here). From deep experience we also know it is far beyond our ability to control the river. But we can anticipate, adapt, and in the process shape the river’s flows. Given the reality of constant change, how and when and where do we want these flows to go?

Interacting Climate Responses and Knowledges Across Scales

STARTLEMENT

by Ada Limón, 24th Poet Laureate Consultant in Poetry at the Library of Congress

It is a forgotten pleasure, the pleasure
of the unexpected blue-bellied lizard

skittering off his sun spot rock, the flicker
of an unknown bird by the bus stop.

To think, perhaps, we are not distinguishable
and therefore no loneliness can exist here.

Species to species in the same blue air, smoke—
wing flutter buzzing, a car horn coming.

So many unknown languages, to think we have
only honored this strange human tongue.

If you sit by the riverside, you see a culmination
of all things upstream. We know now,

we were never at the circle’s center, instead
all around us something is living or trying to live.

The world says, What we are becoming, we are
becoming together.

The world says, One type of dream has ended
and another has just begun.

The world says, Once we were separate,
and now we must move in unison.

A poem written for the Fifth National Climate Assessment.

Supply Chain Fitness

Supply Chain Resilience is especially attentive to wide-area, cross-sector, high volume, high velocity flows. Is there enough flow in the right channels to deliver what is needed when and where it is needed? This is analogous to the human body’s blood pressure being sufficient to feed oxygen and nutrients to our vital organs, but not get so fast and tight as to over-stress the cardiovascular system.

During the worst days of the pandemic, global supply chains were arguably experiencing dangerously high pressure. It was possible to perceive supply chain equivalents of multiple blood-clots emerging simultaneously. The Global Supply Chain Pressure Index tracked that high pressure for most of 2020 through 2022. But we have spent most of 2023 with pressure well-below historical averages. (See first chart below.)

Are we now in danger of hypotension — too-low supply chain pressure? There are some US producers, shippers, carriers, retailers and consumers that have experienced related symptoms. But no, as a whole, current US flow is strong, consistent, even athletic. In many cases pandemic stress has resulted in higher capacity, increased efficiency, and more effective flows.

Below are some current measures that — in combination with the GSCPI, Logistics Manager’s Index, and other more comprehensive efforts — may suggest where our fitness routine is most successful or needs some extra attention.

Agricultural Production: There are places having serious food production problems, such as Argentina, Ukraine, and North Georgia (US) and Wisconsin. But total world production is mostly higher. According to the November World Agricultural Supply and Demand Estimates (WASDE), “The global wheat outlook for 2023/24 is for increased supplies, fractionally lower consumption, less trade, and larger ending stocks… Global coarse grain production for 2023/24 is forecast up 4.8 million tons to 1,499.3 million… The 2023/24 global rice outlook this month is for higher supplies, consumption, trade, and nearly unchanged stocks… The global 2023/24 soybean supply and demand forecast includes lower beginning stocks, higher production, higher crush, and lower ending stocks. Beginning stocks are reduced 1.6 million tons, reflecting offsetting back-year balance sheet revisions for China and Brazil. China’s beginning stocks are reduced on lower soybean imports for 2021/22 and 2022/23 and higher crush for 2022/23. Conversely, Brazil’s beginning stocks are increased on a larger 2022/23 crop of 158 million tons due to higher-than-expected use to date.” Where there is increased supply, prices are — not surprisingly — falling (here and here and here).

Global Natural Gas Demand and Supply: This week Bloomberg reported, “European natural gas traders have started taking fuel out of the region’s record inventories as colder weather settles in, drawing from its buffer against winter supply shocks. Consecutive net withdrawals took place for the first time since April this week, data from Gas Infrastructure Europe show, and may accelerate as parts of Europe face below-normal temperatures over the weekend. For now the withdrawals are marginal, and storage facilities remain over 99% full.” Asia’s demand for natural gas reflects continued economic sluggishness across the region. According to Reuters, Asian “prices have so far failed to get their usual seasonal bump as demand remains relatively subdued and supply is more than adequate, especially from the United States.” US natural gas inventories and production continue to be strong. According to the EIA as of November 15, current domestic stockpiles are at the second-highest end-of-refill-season level experienced during the past five years. US spot prices are two-thirds below fourth-quarter 2022 benchmarks, even though US consumption is slightly above last year. This affordable abundance is not limited to natural gas. Diesel flows have adapted better than many (including me) were worried about last year. The collapse of fossil fuel prices over the last few weeks is unlikely to reverse without severe reductions in supply (not impossible, but…). [November 20 Update: Very helpful round-up of the current Atlantic LNG market from S&P Global.]

China Export Volumes and Value: During October Chinese exports fell 6.4% compared to October 2022 according to China’s General Administration of Customs. This was the sixth month of consecutive declines and reflects a steeper decline than September’s 6.2% reduction (more). It is, however, helpful to differentiate between volumes and value. For example Barron’s reports, “Beijing is selling as much as ever, if not more, volume-wise. It’s the price of exports that’s dropping—8% year over year at the last reading, says Duncan Wrigley, chief China economist at Pantheon Macroeconomics. “China has become a global disinflationary force,” confirms Larry Hu, chief China economist at Macquarie Group. The yuan is partly responsible: It is down 3% against the dollar over the past 12 months.” Given China’s proportion of global flows its current condition is relevant to the health of the whole. A body with a great pulse rate but circulation problems or arthritis in the feet is not likely to do well running a marathon. [November 19 Update: Related commentary by Ruchir Sharma in the Financial Times.]

North American Grid Capacity: Extreme weather is prompting demand spikes that challenge North American (and other) electrical grids. This challenge is compounded where — as in Texas — episodic demand piles-on sustained growth in systemic demand caused by increased population and economic activity (more and more). As recently outlined here, the US grid will face serious threats if — likely when — severe winter weather prompts simultaneous increased demand and disrupted supply. [November 20 Update: The New York Times compares US sources electricity generation with that of other nations.]

US Personal Consumption Expenditures: The US Census Bureau’s method for measuring retail sales is differentiated from how the US Bureau of Economic Analysis calculates Personal Consumption Expenditures. But a flattening of the growth rate for US retail sales during October will almost certainly be echoed in the October consumption data to be released in a couple of weeks. Slowed growth at the current high levels of demand (see second chart below) is not, however, a systemic threat. The US economy is very active, as such domestic consumer demand has been robust. Food, fuel and most other supplies are flowing as needed without much stress. There are aging edges. There are comparatively weaker bones and muscles. Some extra attention, coaching, even therapy is needed. But right now the overall flow between demand and supply is about as healthy as a body this mature and this big can usually get.

GLOBAL SUPPLY CHAIN PRESSURE INDEX (Federal Reserve Bank of New York)

US retail sales slow (?)

According to the US Census Bureau, after strong September retail sales, “Advance estimates of U.S. retail and food services sales for October 2023, adjusted for seasonal variation and holiday and trading-day differences, but not for price changes, were $705.0 billion, down 0.1 percent (±0.5 percent)* from the previous month, and up 2.5 percent (±0.7 percent) above October 2022. Total sales for the August 2023 through October 2023 period were up 3.1 percent (±0.4 percent) from the same period a year ago. The August 2023 to September 2023 percent change was revised from up 0.7 percent (±0.5 percent) to up 0.9 percent (±0.2 percent).”

Bloomberg explains, “Seven out of 13 categories posted declines, led by furniture and car dealers. Gasoline sales weren’t as big of a drag on the headline number as feared considering how much pump prices fell in the month. Meanwhile, outlays increased at personal-care and grocery stores… so-called core goods prices, which exclude food and energy commodities, fell for a fifth month in October. So the decline in retail sales — which aren’t adjusted for inflation — may reflect lower prices rather than fewer transactions.” (More and more and more)

Food-At-Home sales (see first chart below) increased to $73,962 million from $72,726 million in September. Grocery sales are up about 0.9 percent compared to October 2022. Food-Away-From-Home increased from $91,791 million in September to $92,079 million in October. Eating out is up 8.6 percent in compared to October 2022.

Non-store retailers — aka ecommerce — are seeing almost as much Year-Over-Year growth as the restaurant category at 7.6 percent, continuing the power-curve launched early in the pandemic (see second chart below). These non-store retail results motivate consumer-facing supply chains to focus on fulfillment velocity. (Here, the WSJ video emphasizes speed, but please note it is a matter of speedy delivery to particular persons/places.) November 16 Update: There are more than 4600 Walmart stores in the United States, it is not a non-store retailer and, still, for the third quarter just reported online sales increased 24 percent while overall revenue grew 5.2 percent.

Demand is strong while much less volatile than 2020 to mid-2022. In most categories supply is now sufficient to fulfill demand. Prices are moving in a manner coherent with demand patterns, competition, and several months of tighter monetary policy. These are flows well-within the capacity of current US networks.

Cyberattack on Australia’s ports

On Friday, November 10, DP World Australia container port operations in Melbourne, Sydney, Brisbane, and Fremantle were seriously disrupted by a cyberattack (more and more). DP World handles roughly 40 percent of Australia’s maritime throughput (in and out). This morning the BBC reported: “DP World Australia, a unit of the Dubai state-owned DP World, said its ports resumed operations at 09:00 local time “following successful tests of key systems overnight… The company expects that approximately 5,000 containers will move out of the four Australian terminals today.” Bloomberg is reporting that the three day slowdown prompted a back up of roughly 30,000 containers. Recovery of normal flows will require several days. But unless there are malware aftershocks or new attacks are experienced, Christmas retail should not be seriously impacted (a concern raised over the weekend in Australian media (here and here).

Restrained inland waterways

Sunday night the PBS NewsHour ran a helpful overview of how upstream drought has squeezed midstream flows to seriously reduce downstream discharge on the Mississippi River (more). The story offers an especially helpful comparison of capacity differences between barge, rail, and trucking alternatives (full story is eight minutes). Per the river gauge at Memphis, a slight recovery of still-very-low water levels during October’s second half of has now reversed (see chart below). The World Economic Forum recently updated its report of reduced flows on the Amazon, Rhine, Mississippi, and Yangtze. This blog has continued to watch as throughput at the Panama Canal is cut (more and more).