Several updates through March 17 included below.
Between late January and late February evidence accumulated of decreased congestion, friction, and stress in US and global supply chains. The US inventory to sales ratio improved more between November and December than at any time since the deep declines of Spring 2020 (fingers crossed for the January ratio due next week). The ginormous chokepoint at the Ports of LA/Long Beach is much less congested than Autumn 2021 (more). The Global Supply Chain Pressure Index researched and published by a team at the Federal Reserve Bank of New York, suggests that current constraints are similar to those in Spring 2021 — at the start of pandemic demand surge. The Fed’s researchers write, “Overall, we note that supply chain pressures have moderated relative to the peak reached in December 2021, but these pressures have remained at historically elevated levels through February. Going forward, there is the possibility that the current heightened geopolitical tensions might lead to more elevated supply chain pressures in the near future.”
“Geopolitical tensions” is, of course, code for Russia invading Ukraine and all the treacherous turmoil unwinding therefrom. So far actual reductions in commodity flows have been modest (e.g., natural gas from Russia through Ukraine to Western Europe). But the dramatic disruption of financial flows caused by sanctions and the prospective loss of spring planting in Ukraine all point to serious reductions — or at least complications — in availability of Russia’s oil (about 11 percent of global production) and both Russian and Ukrainian wheat (about 30 percent of global production). (More ) Significant proportions of global output for nickel, palladium, aluminum and much more are caught in the cross-fire (more). Duration of and distance from hostilities will influence who is cut off how much from what. The potential parameters of both duration and distance are deeply uncertain.
Vulnerability can be measured. Threat not (yet?) so much, so risks emerging from these geopolitical tensions remain ambiguous.
Another prospective threat to global supply chains: Is Hong Kong’s weeks long surge in coronavirus hospitalizations a leading indicator for what’s next across the People’s Republic? (More and more.) Changchun has been locked-down and Shanghai is seeing more covid cases than ever before (more). There is cause for some concern that China’s considerable success in minimizing transmission of the coronavirus could, paradoxically, increase population vulnerability to more contagious recent variants (and those to come).
So far, Beijing’s approach to fighting covid has, arguably, preserved economic productivity by limiting the scope and scale of lock-downs (and transmission and disease and death). But if there are wide-spread simultaneous breakouts of disease, the current “Dynamic Clearing” process would quickly amplify network-wide constraints. If Dynamic Clearing is superseded there is also a risk of significant disease penetration of China’s workforce and reductions in flow. There are no risk-free options. Whatever is chosen (or happens), “China’s big leap may affect the rest of the world as well. Unleashing COVID-19 on a population of 1.4 billion means a lot of people “will be brewing the virus,” says Gabriel Leung, HKU’s dean of medicine. That will provide ample opportunity for new variants to emerge. “It’s not just a national problem, it’s actually a global issue,” according to a March 1 report in Science.
Likewise for a significant loss of flows to or from China. According to Reuters, “For all of 2021, total [China] exports rose 29.9%, compared to a 3.6% gain in 2020. Imports [to China] for the year gained 30.1% percent, after falling 1.1 percent in 2020.” China is the source for 17 to 18 percent of global economic activity.
+++
March 14 Updates:
Foxconn, Apple supplier, shuts China plants as covid outbreaks grows (Financial Times) “The lockdown in Shenzhen is scheduled to last for six days and could compound disruptions to global supply chains that have contributed to rising inflation in the US and Europe.”
Russia-Ukraine war threatens wheat supply (Wall Street Journal): “Wheat stockpiles were already running low and prices were the highest in years thanks to two years of poor growing weather when Russia’s attack jammed up Black Sea trading and endangered nearly a third of the world’s exports. The invasion prompted fears of food shortages in countries fed with imported grain and pushed prices to new highs.”
March 15 Updates:
Druzhba oil pipeline continues to supply Russian oil to Central Europe (Financial Times) “Russia’s state-owned Transneft, which operates Druzhba, aims to deliver roughly 914,000 b/d to Europe down the pipeline in 2022, of which 261,000 b/d will flow to Poland and 388,000 b/d to Germany, according to S&P Global. Transneft said flows via the pipeline were continuing. In total it provides a quarter of Germany’s crude oil.”
Shenzhen lock-down will impact US ports (Bloomberg) “The number of container vessels waiting to berth in the eastern city of Qingdao has climbed to 22 from 9 just a week ago… and the queue is also growing at the biggest port in Shanghai… This will affect the U.S. in the next month or so, because fewer vessels will leave for the West Coast… And if a big surge of cargo into the Los Angeles-area ports follows once restrictions are lifted, it could seize operations already stressed by equipment dislocation, labor shortages and congestion on the docks.”
March 17 Updates:
China lock-downs cause supply chain shocks (Financial Times) “China is digging itself into a deep hole with its zero Covid policy,” said Olaf Schatteman, a supply chain expert at Bain, the consultancy. “As the restrictions are hurting suppliers and logistics operations, companies are moving beyond containing the current crisis and towards diversifying production locations, undermining China as the supply chain hub of the world.”
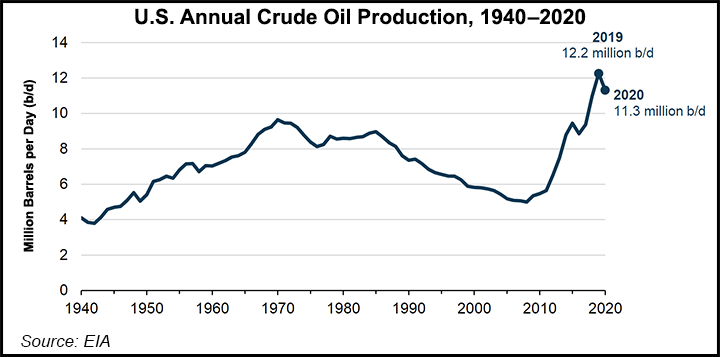
Crude oil capacity continues to be constrained (S&P Global) Prices are volatile. Loss of Russian flows are expected to hit hard in the next few weeks. “Supply losses of this magnitude would be more than enough to keep the market in deficit for at least the next two quarters…” The IEA expects a long-term loss of more than 1 million barrels per day of global refinery outputs. But US crude flows and inventories are strong. Global demand may be easing. US crude oil production exceeds domestic demand. US refineries have recently operated at less than 90 percent capacity. US domestic fuel supplies are in rough equilibrium with domestic demand. Global disequilibrium of demand and supply will continue to prompt domestic price increases (though potentially at a rate less sharp than anticipated last week). (More)