In this February 16 report, NBC news provides a two-minute summary of causes and consequences of disrupted flows serving the people of Gaza. More detail is available here and here and here and here. Particular midstream logistical complications are outlined in this January 8 report by the World Food Program’s LogCluster.
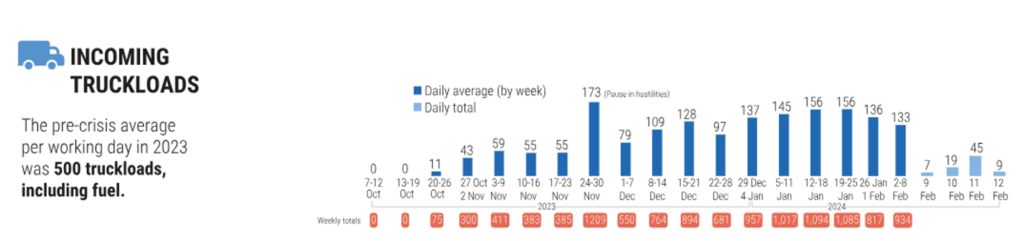
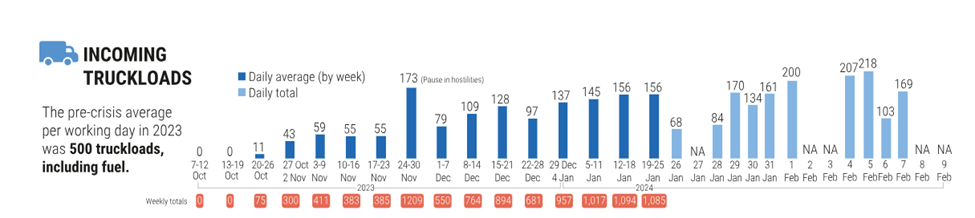
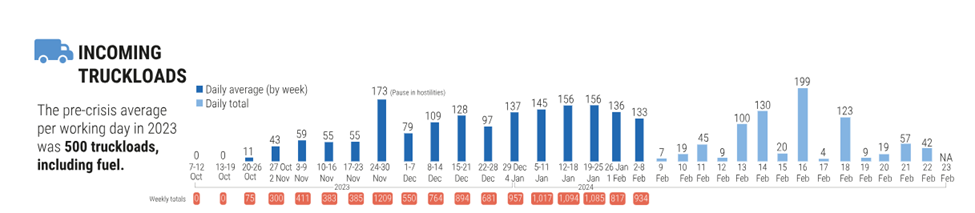
According to the United Nations Office for the Coordination of Humanitarian Affairs (OCHA), below is inbound freight flow to Gaza since October 7.
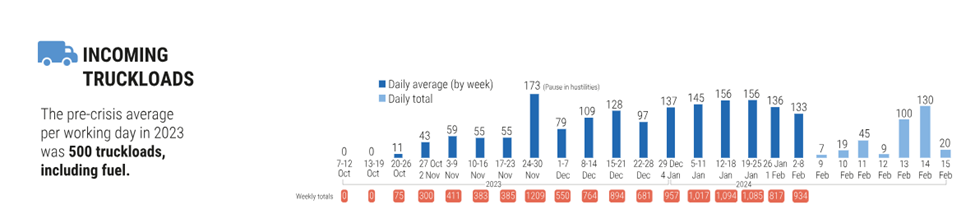
The precise number of truckloads received differs by what is counted when and where. For example, below is an accounting of truckloads by Coordination of Government Activities in the Territories (COGAT). In either case, flows are insufficient to fulfil fundamental human needs of 2.3 million people trapped in the crossfire.

February 22 Update: Yesterday National Public Radio reported on Gaza food flows with details very similar to what this blog has reported since early January. I appreciated the confirmation drawing on alternative sources.
February 24 Update: The Brookings Institution has produced a brief, helpful overview of challenges involved in providing humanitarian support to the people of Gaza. Kevin Huggard interviews Tania Hary, CEO of the Israel-based NGO Gisha – Legal Center for Freedom of Movement. Ms. Hary’s observations are consistent with what has been reported here since December. I agree with her summaries related to context, causes, and effects. Ms. Hary also offers, “Only a cease-fire will allow humanitarian actors to even begin to address people’s needs in the strip.” A sustained ceasefire would clearly support much more effective flows of humanitarian resources . And… in catastrophic contexts — tsunamis, earthquakes, plague, war, and more — there is a need to conceive and commit to doing what can be done here and now to serve survivors. As the inbound flows reported below indicate, there is a desperate and urgent need for much more. But we begin each day with as much as creativity and courage as we can find — many in Gaza and nearby have now been doing this for over 140 days.
Personal Note: Given other commitments, this is likely to be my last post until March 2 or so.