Category: Uncategorized

PJM Problems: Demand and/or Supply?

PJM is a regional transmission organization (RTO) that coordinates grid operations for Ohio, Pennsylvania, New Jersey, Delaware, Maryland, West Virginia, District of Columbia, and significant parts of Virginia, Illinois, Michigan, Kentucky and North Carolina.

About 4AM eastern on December 24 I sent several clients personalized messages that included something like:

This morning’s PJM Stage 2 emergency (more) is the result of an unprecedented (and unpredicted?) spike in demand, prompted by this bomb cyclone’s geographic scope, speed, and extraordinary rates of temperature change.  In my judgment, PJM is probably the most operationally capable of the North American reliability operators.  It also serves some of the densest demand.  Dense demand tends to be more volatile — and this bomb cyclone is causing a rate of change in power demand that will challenge system capabilities. 

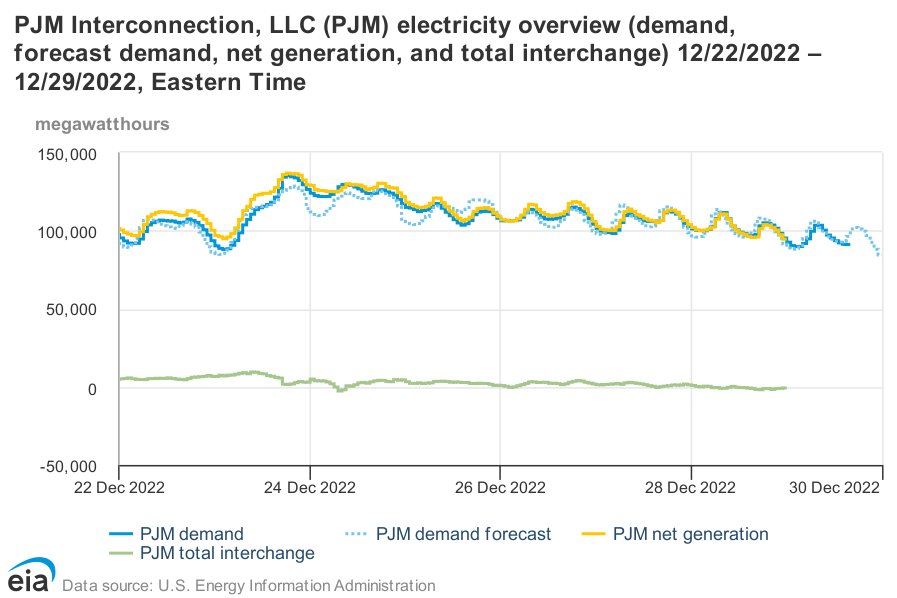
Below is a screen capture of the near-real-time chart that I spent two days watching at least as carefully as any magi watched any star.

The Friday night before and early Saturday morning of Christmas Eve is not the most promising moment for an outsider to figure out what is happening (and not happening) with grid operations anywhere. But what my sparse contacts and sources were telling me was also what Bloomberg reported, “Demand soared more than 9 gigawatts above forecasts Friday evening — much faster and higher than anticipated. That’s the equivalent of about 9 million homes just popping up on the grid on a typical day.”

Yesterday PJM reported out its own After-Action (please see 32 screen PowerPoint). In the PJM report, I perceive the demand component — and especially the rate of change aspect — is confirmed. PJM also provides very helpful background on the push to fulfill pull… and several problems that constrained push.

As reported by S&P Global,

PJM said it called over 155,750 MW into the operating capacity for Dec. 23. Based on generator availability data, “we believed we had almost 29 GW of reserve capacity available to absorb load and generation contingencies and to support our neighboring systems,” the grid operator said. Since Capacity Performance was implemented, PJM has typically seen a forced outage rate of about 5% with that going up to about 10% in extreme weather but the forced outage rates observed during this event “grossly exceeded” those averages, Bryson said. Capacity Performance requires that generators must meet their commitments to deliver electricity whenever PJM determines they are needed to meet power system emergencies and generators that exceed performance commitments will be entitled to funds collected from generators that underperform. “Generation outages were unacceptably high, and they occurred at the worst possible time for system operations,” he said. On the evening of Dec. 23, generation outages reached 34.5 GW and on the morning of Dec. 24 they reached 46 GW, or 23.2% of PJM’s total capacity, the grid operator said.

A full assessment is expected by mid-April. The final report will clearly — appropriately — go beyond the demand or supply question, both demand and supply issues are involved. But for broader purposes of Supply Chain Resilience, I suggest attention to demand’s rate of change is especially important because this risk accelerant is too often discounted or neglected.

Even robust high volume, high velocity supply systems will usually lag sudden and sustained demand spikes that exceed one-fifth of credible capacity. Sudden and sustained demand spikes are almost always associated with unusual, specifically unpredictable, factors that will complicate supply capacity. (Please also see toilet paper, canned chicken soup, N95 masks, semi-conductors, gasoline, and more.) But what cannot be specifically predicted can be strategically anticipated.

Update on US Diesel Stocks

A late December deep freeze — even along the Gulf Coast’s refinery row — resulted in reduced petroleum processing. But production quickly came back strong. Earlier today Reuters reported:

The U.S. Energy Information Administration (EIA) said crude inventories jumped by 19.0 million barrels last week, the third biggest weekly gain ever and the most since stocks rose by a record 21.6 million barrels in Feb 2021. Last week’s increase came as refiners were slow to restore production after a cold freeze shut operations in late 2022.

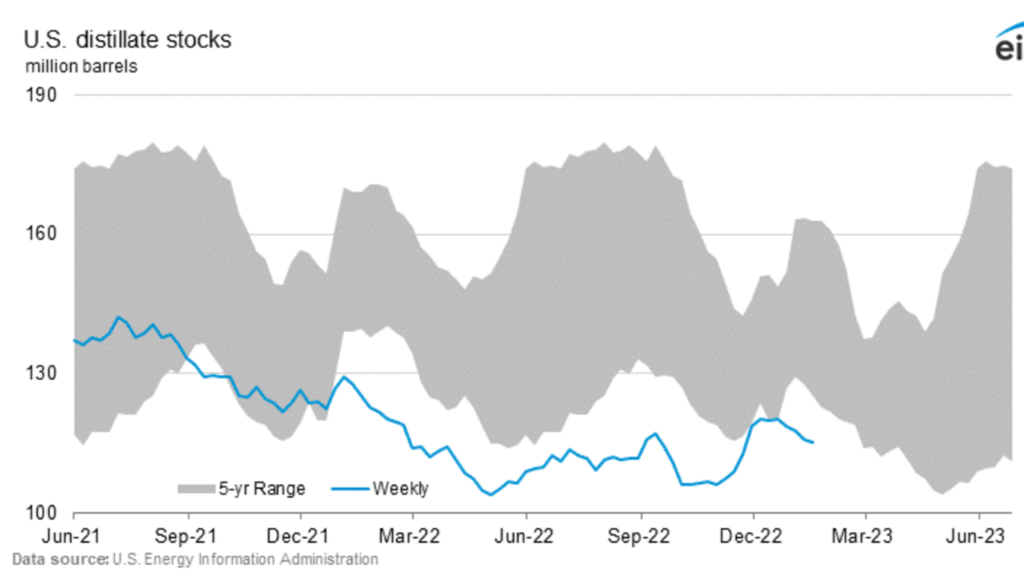
There has been particular concern regarding diesel stocks, especially for the mid-Atlantic and New England. But even these inventories have continue to build (see chart below for the mid-Atlantic).

Managing Risk

[Updates Below] Tuesday, January 3, the World Health Organization’s Technical Advisory Group on Virus Evolution (TAG-VE) met to review new information on SARS-CoV-2 variants. Here are excerpts from the January 4 TAG-VE statement:

As of 3 January, 773 sequences from mainland China have been submitted to the GISAID EpiCoV database, with the majority (564 sequences) collected after 1 December 2022. Of those, only 95 are labeled as locally-acquired cases, 187 as imported cases and 261 do not have this information provided. Of the locally-acquired cases, 95% belong to BA.5.2 or BF.7 lineages. This is in line with genomes from travellers from China submitted to the GISAID EpiCoV database by other countries. No new variant or mutation of known significance is noted in the publicly available sequence data… WHO will continue to closely monitor the situation in the People’s Republic of China and globally and urges all countries to continue to be vigilant, to monitor and report sequences, as well as to conduct independent and comparative analyses of the different Omicron sublineages, including on the severity of disease they cause.

Surveillance capabilities in most nations range from partial to pitiful. Accordingly this blog has long focused on covid hospitalizations as the most meaningful (if lagging) indicator. Reuters reports, “China’s COVID-19 data is not giving an accurate picture of the situation there and underrepresents the number of hospitalisations and deaths from the disease, a senior official at the World Health Organization said on Wednesday.” Today, January 5, China released new hospitalization data. If anything, the results confirm widespread skepticism regarding official veracity.

A “new” variant is a source of increasing concern in the United States. Here is how XBB.15 was explained in an American Medical Association January 4 update:

Scientists are really still in the early stages of studying that XBB subvariant and that even newer version, the XBB.1.5. Preliminary studies have shown that the newer version is adept at evading existing immune response and at binding to human cells. Both XBB and XBB.1.5 are recombinants of the BA.2 variant. And according to CDC data, over 40% of COVID cases in the U.S. are now caused by the XBB.1.5 subvariant. And that’s doubled from the previous week. And if you look at the data in the Northeast, about 75% of confirmed cases are reported to be XBB.1.5. So these appear to be very contagious. I think the good news so far is there’s no indication at this point that it causes more severe illness than the other Omicron variants do. I think experts do agree that getting that bivalent booster dose to bolster your immune system against these newer subvariants is the most important thing to do and we’ll definitely continue to watch as things progress with these variants.

The Financial Times explains:

XBB.1.5 is informally called Kraken after the mythological sea monster, one of a number nicknames that scientists have applied “to help people keep track of the ever-growing variant soup”, said Ryan Gregory, an evolutionary biologist at Canada’s University of Guelph in Canada. “There are now more than 650 Omicron subvariants.” Kraken is descended from XBB or Gryphon — itself a hybrid of two Omicron BA.2 descendants. A key mutation enables XBB.1.5 to transmit rapidly between people by evading antibodies conferred by previous infection or vaccination, while at the same time binding more tightly to human cells. “While there’s still much to learn about this variant, it doesn’t have the look of a ‘scariant’,” said Eric Topol, professor of molecular medicine at Scripps Research in California, referring to the term he coined for strains that sound scary but are not really dangerous. “This one is the real deal and we’re betting on our immunity wall of infections, vaccinations, boosters and their combinations to help withstand its impact,” he added. (More)

Meanwhile California is flooding in yet another example of increasingly extreme weather, the winter war worsens, political dysfunction persists, global effectual demand declines, immediate threats of hunger and violence drive desperation, displacement, and large-scale human migration…

Risks abound. Threats proliferate. Vulnerabilities escalate. Consequences multiply. Our data is incomplete and too often unreliable.

Because this is our reality, we can benefit by being widely observant, avoiding or resisting over-reaction, while fully prepared to probe, decide, and actively care for ourselves and others as prudently, creatively, urgently, patiently, and persistently as possible.

+++

January 6 Update: Linked via “More” at the close of yesterday’s FT quote (above) is a Bloomberg piece on XBB.1.5 (Kraken). This morning that story is listed at the top of the “most read” on the Bloomberg website… encouraging evidence of decision-makers being widely observant.

January 11 Update: Based on what I can see and hear out of China, worst-case probabilities related to coronavirus mutations are easing (here and here and here and here). Today the economic horizon seems to be opening to improved demand and supply from China, with significant implications for supply chains.

But my ability to see and hear is too constrained to be confident. The viral pot could still boil over, especially in the aftermath of the current Lunar New Year holiday. From a supply chain resilience perspective, premature risk discounting could still unfold into flow disruptions, volatility, and destruction (more and more).

Writing in the Financial Times, Robert Armstrong and Ethan Wu comment:

The bear case is rather less precise, but comes down to reopening being very hard, and very hard to predict. An even bigger second wave of Omicron cases, a politically intolerable death toll that prompts lockdowns, a collapsing healthcare system, a deadlier variant — any of these could blow apart market optimism. An on-again-off-again approach to lockdowns would crush the economy and shatter markets’ newfound confidence.  

Humility is a very practical virtue, especially for 2023.

January 13 Update: In late November China began to re-open. December’s economic momentum reflected prior counter-covid constraints. (So will January and, probably, February. After that?) One of my five “vital signs” for global supply chain fitness is the volume and value of China’s exports. According to this morning’s Financial Times, “China’s exports suffered the sharpest decline in almost three years in December… Exports declined 9.9 per cent year on year in dollar terms in December, according to official data released on Friday by China’s general administration of customs, worse than November’s 8.7 per cent fall but slightly outperforming expectations of an even greater contraction. Imports slid 7.5 per cent last month, up from a 10.6 drop the month before.”

January 14 Update: Reuters reports, “Between Dec. 8 and Jan. 12, the number of COVID-related deaths in Chinese hospitals totalled 59,938, Jiao Yahui, head of the Bureau of Medical Administration under the National Health Commission (NHC), told a media briefing.” This increase reflects a change in the standard of measurement being utilized. While much higher than previously reported, this number is still treated skeptically by many who expect reopening will produce much higher fatality rates. (More and more)

January 17 Update: Bloomberg reports, “The nearly 60,000 Covid-related deaths China reported for the first five weeks of its current outbreak, the largest the world has ever seen, may underestimate the true toll by hundreds of thousands of fatalities, experts said… Using a report from the National School of Development at Peking University that found 64% of the population was infected by mid-January, he [Zuo-Feng Zhang, chair of the department of epidemiology at the Fielding School of Public Health at University of California, Los Angeles] estimated 900,000 people would have died in the previous five weeks based on a conservative 0.1% case fatality rate. That means the official hospital death count is less than 7% of the total mortality seen during the outbreak.”

January 27 Update: For the last two weeks covid reports out of China have been ambiguous. The official line is clear enough (more), but the subtext is a like a Keith Moon drum set sharing the stage with a Mozart concerto. Here’s an example from this morning’s Financial Times, “Chrysanthemum flowers, a symbol of mourning in China, are selling out in cities across the central province of Hubei, with prices rising sharply as demand surges following a wave of Covid-19 deaths.” There is a steady drum-beat of death. I am especially concerned about mutations, but over the last two weeks nothing definitive. From a global supply chain perspective, if the official line is accurate and sustainable, China’s export engine will continue to chug along and, gradually, China’s less-constrained domestic demand will play its part in simulating global economic activity, improving chances for a rising tide that will lift all boats — especially — container ships (more). But a virulent mutation would undo this quickly — and recent increased transmission rates spike the chance for a more varied range of mutations. So… several years ago I was awakened in my hotel room by thuds and screams from the room behind my bed. It was either some unusually vigorous sex or deadly violence. My heart-pumping uncertainty was finally resolved when the convulsive pounding assumed a more rolling rhythm… and I returned to sleep. What would have I done if the acid-rock drum-roll had continued?

European energy flows

[Updates Below] Europe’s second week of winter begins with Frankfurt breaking 60 degrees Fahrenheit. Autumn in Paris (and Berlin and Amsterdam) was remarkably mild. The EU has consumed one-fifth to one-quarter less energy than usual. Much higher costs have also contributed to declines in demand (more and more).

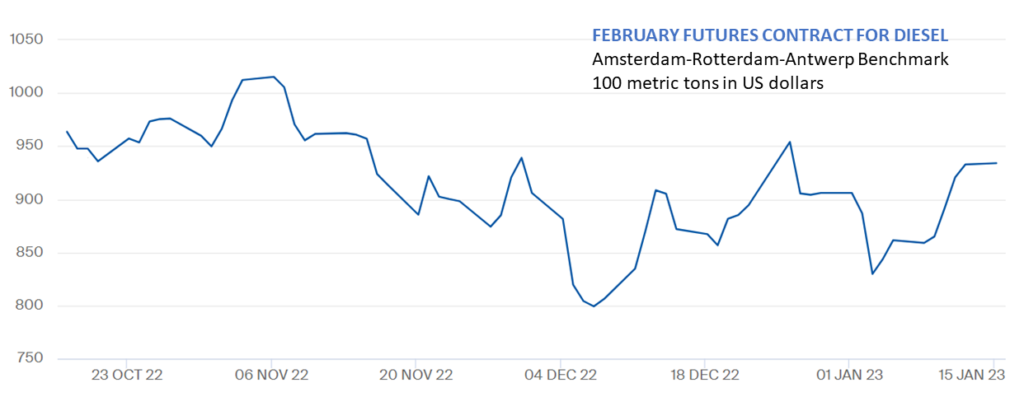
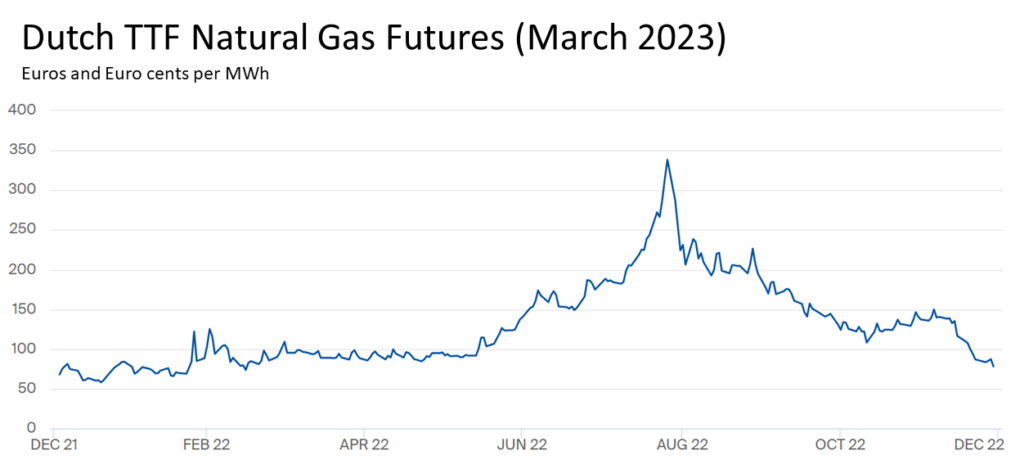
EU natural gas storage facilities are more than 80 percent full (more and more). The price of a March futures contract for natural gas is now less than one-quarter the late August price per the Dutch TTF benchmark (see chart below). (The US Henry Hub price has also fallen.) Even diesel supplies are slightly higher while the price is slightly lower compared to one month ago (more and more).

Happy New Year.

So far, President Putin’s plan to weaponize Western Europe’s winter is not going well. Farther East, today even Kyiv is feeling the upper fifties Fahrenheit. But Putin’s direct attacks on Ukraine’s grid (here and here and here) are a very present and escalating threat to millions.

In a December 28 address to Ukraine’s parliament, President Zelenskyy said, “Today we have to get through and we will definitely get through this winter. Russian missiles and, as they say, “shahed” strikes at our energy sector, at the energy supply of Ukrainians, are an obvious challenge — not only to our state, by the way. When terror strikes against the civilization of life, the world can stand up for both civilization and life.”

In the same speech Zelenskyy offers a Supply Chain Resilience, network-science-oriented vision for rebuilding his nation’s grid, “Now, when the enemy has set himself the goal of destroying us, destroying our energy sector, we set ourselves the goal of becoming a leader in the transformation of our energy sector to counter any threats, any challenges – military, political, economic or even climatic. We have to become – and we will become, as there is no other option – a leader in building modern green energy. This will allow us to create a decentralized energy system that cannot be destroyed by anything, any missile strikes. Today – everyone can see – it is dangerous when cities depend on several large thermal or power plants. A modern city needs decentralized sources of energy.”

+++

January 2 Update: Bloomberg reports, “Benchmark futures settled higher on Monday after initially falling to the lowest level since before Russia invaded Ukraine. While weather forecasts point to temperatures above seasonal norms for most of the region in the next two weeks, Europe still needs to manage its stocks carefully as it goes through the winter.”

January 5 Update: S&P provides a helpful analysis of demand and supply, concluding: “European power prices have fallen to pre-Ukraine invasion levels for winter contracts, as a combination of ample LNG supply, mild weather and a weak economy weighed on the market, while prices further out were firmly higher on the year…”

Vital signs updated

[Updates Below] There are several helpful tools to assess the overall health of supply chains, including the Global Supply Chain Pressure Index and the CSCMP Logistics Managers Index. Toward the end of November, I suggested five indicators for fitness of emerging global flows focused on the next six months or so. Here’s an updated assessment:

Southern Hemisphere Agricultural Production: Argentina’s corn crop is forecast to be less than last year’s harvest and at the low end of average production levels (more). Anticipated Brazilian soybean yields have bounced back from last year’s disappointing harvest (more). Australia seems to be on track for a record wheat harvest. Wheat futures have been trending lower since September and are well-below their peaks in May.

Global Diesel Demand, Production, and Price: The IEA December analysis of November outcomes reported, “Global refinery runs surged by an estimated 2.2 mb/d last month, to 82.3 mb/d, the highest since January 2020. Increased supply of diesel and gasoline coincided with a seasonal lull in transport fuel demand, boosting product stocks which pulled refinery margins lower. In the US and Europe, diesel cracks made record monthly falls from October’s historical peaks, but remain high.” US diesel stocks were up in most US regions for the week ending December 23. US diesel prices were slightly lower. The bomb cyclone that drove south after December 23 has reduced production and increased prices, how high for how long is not yet clear (more and more). Future contracts for January/February New York Harbor deliveries remain off-peak. Same for Amsterdam-Rotterdam-Antwerp diesel futures. (Related)

Covid Hospitalizations (and mutations): Transmissions and morbidity are up, especially in the Northern Hemisphere (see chart below). The situation in China is very tough to assess. Since late November public health policy and practice in China has radically changed (more and more and more). There is clearly much more transmission and much more movement of infected people. The virulence associated with this surge — and any related mutation trends — will require a few more weeks to unfold. But, so far, no new variants have been detected (more).

Chinese Export Volumes and Value: According to China’s General Administration for Customs and TradingEconomics, “Exports from China plunged 8.7% yoy in November 2022 to USD 296.1 billion, worse than market consensus of a 3.5% drop and following a 0.3% fall month earlier. This was the second straight month of decline in shipments, and the steepest fall since February 2020, amid weakening global demand due to high inflation and aggressive monetary tightening by major economies and production disruptions lingered.”

North American Electricity Demand and Supply: The bomb cyclone (more) played havoc with energy demand forecasts, prompting last minute efforts to reduce demand and increase supply across much of North America east of the Rocky Mountains (see chart below, please note divergence between demand forecast, demand, and generation especially on December 23 and 24 ). The Wall Street Journal editorial board commented:

Utilities and grid operators weren’t prepared for the surge in demand for natural gas and electricity to heat homes, which occurred as gas supply shortages and icy temperatures forced many power plants off-line. The PJM Interconnection, which provides electricity to 65 million people across 13 eastern states, usually has surplus power that it exports to neighboring grids experiencing shortages, but this time it was caught short. Gas plants in the region couldn’t get enough fuel, which for public-health reasons is prioritized for heating. Coal and nuclear plants can’t ramp up like gas-fired plants to meet surges in demand, so PJM ordered some businesses to curtail power usage and urged households to do the same through Christmas morning. Rolling blackouts were narrowly averted as some generators switched to burning oil. (More and more and more.)

Compared to one year ago, flows have slowed. Given the war in Europe — with direct effects on food and energy flows — this is unsurprising. Reduced demand for China’s output — by both domestic and international customers — is also a factor. Efforts by North American and European Central Bankers to reduce inflation is another constraint. Given the risks, flows are better than many credible mid-summer projections. War is a perpetual wild card. A wider war — and any new wars — could seriously impede flows. Many worst-case and best-case projections now depend a great deal on what happens in China. An invasion of Taiwan would be catastrophic. If the current dismantling of counter-covid constraints unfolds without spawning a surge in global deaths, then a combination of American and Chinese consumer demand could pull enough to substantially increase both volume and speed of global flows… for better and worse.

+++

January 2 Update: Reuters reports, “China’s factory activity shrank for the third straight month in December and at the sharpest pace in nearly three years as COVID infections swept through production lines across the country after Beijing’s abrupt reversal of anti-virus measures.” More context is available in my December 19 post with several updates.

January 3 Update: Bloomberg reports, “Nearly a dozen major Chinese cities are reporting a recovery in subway use, a sign that an ‘exit wave’ of Covid infections may have peaked in some urban areas… The rise is evidence to support an official statement on Sunday that the Covid outbreak has peaked in the southern manufacturing hub of Guangzhou, where the number of patients at fever clinics have been declining since Dec. 23. Last week, health authorities said infections have peaked in Beijing, Tianjin and Chongqing.” Meanwhile, the Wall Street Journal reports, “In a Dec. 29 article published in Frontiers of Medicine, a medical journal sponsored by China’s Ministry of Education, a team of researchers warned that some provinces in central and western China and in rural areas would be hit by a wave of infections in mid- to late-January. The duration and magnitude of the coming outbreak “could be dramatically enhanced by the extensive travels” during the Lunar New Year, the researchers wrote.” (More and more.) Based on currently available data, the European Centre for Disease Prevention and Control reports, “The variants circulating in China are already circulating in the EU, and as such are not challenging for the immune response of EU/EEA citizens. In addition, EU/EEA citizens have relatively high immunisation and vaccination levels. Given higher population immunity in the EU/EEA, as well as the prior emergence and subsequent replacement of variants currently circulating in China by other Omicron sub-lineages in the EU/EEA, a surge in cases in China is not expected to impact the COVID-19 epidemiological situation in the EU/EEA.”

Increased real US consumer demand for food

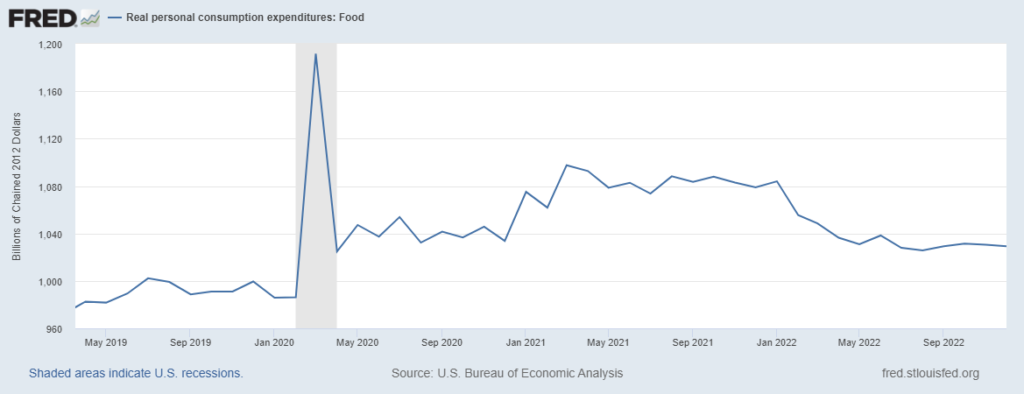
In November 2018 US consumers spent 983.7 billion chained-2012-dollars on food-at-home. In November 2019, 991 billion chained-2012-dollars were spent on food. This November (according to this morning’s report and Federal Reserve analysis) the amount spent was 1033.6 billion chained-2012-dollars. This is an inflation-adjusted figure. We are spending above trend on food-at-home — establishing a new trend? — despite inflation (which eased again in November), despite other increased costs (e.g. energy and shelter), and despite very robust competition for consumer spending. See chart below.

Demand-driven shortages

This morning Dr. Ashish Jha responded to a reporter’s question making the crucial — and too often neglected — distinction between demand-driven or supply-driven disequilibria. In terms of strategic — and responsive — potential actions, this is a crucial differential diagnosis. Below I have teed-up the full four minute interview. The push-pull distinction begins about the 1:55 mark. Dr. Jha’s explanation is accurate in response to the specific products the reporter references. This has also been a recurring feature of so-called supply chain “shortages” for a wide array of products over the last three years.

Wind-blown rolling waves never stay

[Updates Below] In late 2019 and early 2020 something strange was happening in China. Sparse reports and lush rumors swirled. As is often the case with China, we were left listening to the contours of silence much more than anything else.

I watched and listened with increasing alarm, but also with deep uncertainty. It was not until the third week in January that I decided to risk my own credibility and start raising concerns among my colleagues and clients.

Humility is a practical virtue. Fear of ridicule is never helpful. I should have written and said much more, much sooner.

Today’s reports on coronavirus in China are more prominent than three years ago. Yet too much still depends on listening to “silence as a cancer grows.” (Here, here, and here, to sample just a few.) But there are also plenty of signals. Here is what Reuters reports this morning:

China’s chief epidemiologist Wu Zunyou on Saturday said the country was in the throes of the first of three COVID waves expected this winter, which was more in line with what people said they are experiencing on the ground… Beijing city official Xu Hejian told reporters on Monday COVID was spreading fast in the capital, putting pressure on medical resources. Still, more restrictions will be lifted, with previously-closed venues located underground, from bars to internet cafes, allowed to re-open, Xu said.

Over the last three weeks — following widespread protests — China has diverged from a rigorous process of required testing and radical social distancing. The sudden shift has, so far, prompted a fearful self-distancing that quickly gutted the protests and has probably slightly slowed virus transmission. But transmission is well-underway and will not now be contained… during winter in a dense population that is unevenly-vaccinated and in which immunity to a wide range of viral activity is now reduced (as we have seen with seasonal flu and RSV in the United States).

Recent strains of the 2019 novel coronavirus are not as lethal to otherwise healthy hosts as earlier variants. But in coming months the scope and scale of illness and death in China is likely to be extreme. The Institute for Health Metrics and Evaluation has projected a sharp spike early next year. This will seriously disrupt China’s economy. Over the next six months this disruption is likely to be more troublesome than the economic constraints that the Zero-Covid policy caused. This has global supply chain implications with reduced outbound flows from China and less predictability just about everywhere.

The coronavirus continues to evolve. Future mutations are beyond confident prediction, but more evasive and lethal versions are possible. The more infections, the more mutation possibilities. Several million more mutation factories will open in the months ahead.

Risk is the outcome of threats interacting with vulnerabilities to a range of consequences. Likelihoods — best guesses — involve both upside and downside potential. Especially with the virus that causes covid, there are very few certainties.

But there is a strong likelihood of discounting risk. We see discounting (or denial) on a wide range of risks, but it was especially obvious in 2020 as illness and death in Wuhan and elsewhere was being reported. From the December solstice to the March equinox much of the world behaved as if what happens in China stays in China. When this perception was disproven, much of the world responded with a level of surprise that amplified risks too-long denied.

As we approach Wednesday’s 2022 solstice, deja vu all over again?

I hope not. It is, however, in our shared self-interest to soberly, systematically recognize this emerging risk; thinking and talking through appropriate mitigation measures: personal and social, local and global, especially in regard to flows of water, food, fuel, pharmaceuticals, and other critical freight. If we had 2020 to do over, what would we do differently? I don’t suggest the answers are obvious. But meaningful discussions now can displace surprise and amplify readiness (instead of risk).

The title of this post is taken from a Tang dynasty poem:

九曲黄河万里沙
浪淘风簸自天涯。
如今直上银河去…

My translation:

Nine bends of the Yellow River flow with sand from far away
Emerging of sky’s edge wind-blown rolling waves never stay
Searching for the source I travel deep into the Milky Way…

My making of meaning: Knowing source and cause may well be beyond our capacity, but flow and its contents are clear enough. Given what we do know, we should prudently engage flows to minimize harm and maximize benefit.

Too poetic? Insufficiently empirical? Probably. But confronted with deep uncertainty, I have experienced the poetic and empirical to be effective partners.

Best wishes for the New Year fast approaching.

+++

December 20 Updates: A reader has sent me a new World Bank update on China. Thank you. Here is an excerpt from the Executive Summary:

High frequency indicators suggest another growth slowdown in the fourth quarter amid a return of high COVID-19 cases. Despite fiscal and monetary policy support, real GDP growth is expected to slow to 2.7 percent in 2022—1.6 percentage points lower than projected in the June China Economic Update. In 2023 growth is projected to recover to 4.3 percent but remain below the potential rate. China has been moving quickly toward reopening since November 2022, with public health measures being eased rapidly. During the initial stage of reopening COVID infections will rise sharply and might lead to voluntary reduction in social interactions, which will weigh on consumer demand and may lead to continued disruption even after restrictions are lifted. These impacts of the initial exit wave are expected to be concentrated in the first quarter of next year…

Later in the report China’s strategic risks are summarized, including climate change, an unstable real estate market with related macroeconomic challenges, and “uncertain global growth prospects, sharper-than expected tightening in financial conditions, and heightened geopolitical tensions…” The World Bank authors do note, “In China, 69 percent of over 60-year-olds had received a booster dose as of mid-November 2022, but the vaccination rate was just 38 percent for over 80-year-olds…” Risks of the so-called exit wave spawning mutations are not referenced. The report is titled, “Navigating Uncertainty: China’s Economy in 2023“.

The Washington Post editorial board apparently shares the concerns I have outlined above. The headline: China’s new covid nightmare could become a global catastrophe.

December 21 Updates:

Bloomberg reports: Chinese cities and factories tell people with covid to go back to work and China’s covid tsunami could spark a dangerous new variant that infects the world

Reuters reports: Corporate China struggles with supply snags and demand slump as covid cases spread

South China Morning Post reports: China to track covid mutations through national hospital network

December 22 Updates:

Wall Street Journal reports: Undercounted deaths cloud China’s zero-covid exit

Reuters reports: Shanghai hospital warns of ‘tragic battle’ as covid spreads

December 23 Updates:

The Financial Times reports: Covid overwhelms Beijing’s hospitals

Bloomberg reports: Shanghai port strives to keep global trade moving despite covid (successfully so far) and China’s soaring covid cases push economic activity off a cliff.

In the South China Morning Post, Wang Xiangwei comments: Morgues overwhelmed: why China’s new covid crisis is all of its own making

In the Wall Street Journal, Dr. Ezekial Emanuel comments:

Over the past three years, there have been more than 650 million confirmed Covid cases world-wide. Public-health authorities have identified six “variants of concern”—those that have increased transmissibility, increased disease severity, reduced neutralizing antibodies or reduced effectiveness of existing treatments and vaccines… Having 800 million people in China infected will increase the likelihood of dangerous new variants. Making matters worse, the Chinese New Year is Jan. 22, and hundreds of millions of Chinese will travel and gather to celebrate. (Three years ago the city of Wuhan went ahead with a massive New Year’s banquet amid the original outbreak.) The easing of China’s international travel restrictions will disperse any new variants to other countries.

January 12, 2023 Update: “Poetry knows we are as close as a feather to disaster.” Marianne Boruch

Farther horizons

[Updates Below] In three weeks, a new year. In three months, the likelihood of another million-plus deaths from covid (more) and, almost as certainly, a worsening war in Europe.

In three years?

The sharp slope of pandemic demand has eased (even as core demand increases). Compared to one or two years ago, many wealthy people are not quite as wealthy (but there is a continuing tendency for wealth to flow to those already wealthy). Billions in poverty or close-by are now less able to pull what they need. Flows are slowing.

The velocity of demand since 2020 was not sustainable, but there is now increasing risk of peripheral pull (aka low-margin demand) being shed as overall flows are narrowed.

Supply capacity is increasingly volatile. Food sources and flows are disrupted by natural and intentional complications (more and more). Ditto for energy flows (more and more).

There is increasing cause to anticipate more frequent and severe natural disruptions. There is no reason to expect intentional disruptions to dissipate, even if particular conflicts run their course.

Given this risk environment there is — and will be — incentives to diversify sources, nodes, and channels. But this will take time and treasure. In the meantime higher costs will further constrain fulfilling demand. Higher costs for core commodities and transportation will decrease demand for more discretionary consumption, depressing demand across several sectors. Such continuing constraints raise the likelihood of discarding lower-margin pull; increasing the likelihood of political volatility among those with much less pull capacity.

There are various and sundry efforts to arrange autarkic separation of demand and supply. Especially if widely adopted, this would undermine the potential capacity of all flows and expand the size of peripheral populations being shed (more). Aging populations in North America, Europe, and East Asia will pay more to consume less. Youthful populations everywhere will have less to spend and need to pay more for basics.

As you know — and I readily confess — I am a kind of catastrophe-kid (or now, I guess, catastrophe geezer). Yet, over the years I have often warned against assuming the worst. Large-scale complex adaptive systems are predisposed to rebalance over time. We have seen this again and again. But time-scales can vary widely — and for many inside these temporal loops achieving a positive equilibrium takes more time than they (we) have.

There are many projections for a 2023 economic slowdown or recession (here and here and here). The litany above references several potential reasons why. Time-required can often reflect how well capacity concentrations survive impact (physical, fiscal, or policy-driven). Are there potential sources of acceleration?

Given the immediate context, Europe and Britain seem unlikely candidates. Russia‘s economy will continue to suffer from sanctions. Argentina, Australia, Brazil, Canada, and Indonesia could benefit if all commodity prices increase at least as much as fossil fuels. China’s domestic demand is likely to be covid-constrained for considerable time. China, India, Japan, South Korea, and other East Asian economies will reflect some aggregate of global demand. Mexico faces similar dynamics. Turkey is a very special case.

It seems to me that much depends on wither goest American consumers, whether war and covid become more or less deadly, and whether the world’s farmers find the weather extreme or benign.

+++

December 16 Update: Live Science reports,

Since the COVID variant omicron emerged in late 2021, it has rapidly evolved into multiple subvariants (opens in new tab). One subvariant, BF.7, has recently been identified as the main variant spreading in Beijing (opens in new tab), and is contributing to a wider surge of COVID infections in China… BF.7 is believed to have an R0, or basic reproduction number, of 10 to 18.6 (opens in new tab). This means an infected person will transmit the virus to an average of 10 to 18.6 other people. Research has shown omicron has an average R0 of 5.08 (opens in new tab)… The symptoms (opens in new tab) of an infection with BF.7 are similar to those associated with other omicron subvariants, primarily upper respiratory symptoms. Patients may have a fever, cough, sore throat, runny nose and fatigue, among other symptoms. A minority of people can also experience gastrointestinal symptoms like vomiting and diarrhoea. BF.7 may well cause more serious illness in people with weaker immune systems.

This morning the Financial Times is reporting, “Evidence of a wave of Covid-19 deaths is beginning to emerge in Beijing despite official tallies showing no fatalities since an uncontrolled outbreak began sweeping through China’s capital this week.” (More)

The immediate risk presented by the BF.7 subvariant is potentially amplified by the threat of new mutations as several million new cases suddenly flare in the coming weeks (here and here).

Diversifying flows

In a good overview, the Wall Street Journal reports, “The hierarchy of U.S. ports is getting shaken up. Companies across many industries are rethinking how and where they ship goods after years of relying heavily on the western U.S. as an entry point, betting that ports in the East and the South can save them time and money while reducing risk.” Below is a chart showing the shift in container volumes over the first nine months of this year. There are certainly several factors at play here, some ephemeral, some that will probably be more persistent. What is fundamentally true: diversifying nodes and channels increases resilience.