[Updates Below} Yesterday, Friday, September 9, US railroads began to prepare for a possible strike. Here is what BNSF told its customers, “Due to the possibility of an interruption of service when the cooling off period expires September 16, we will begin to take steps to manage and secure the shipments of hazardous and security-sensitive materials as early as Monday, September 12.”
Reuters reports, “A railroad work stoppage would cost the U.S. economy $2 billion per day in output and require 467,000 long-haul trucks daily to handle shipments diverted from rail – [far, far, far (Palin note)]exceeding supply… “Additional insecurity placed on the still fragile U.S. supply chain – as we recover from COVID and other supply chain stressors and move towards the holiday season – will harm the economy at large and individual Americans,” according to the American Trucking Associations (more and more).
Bloomberg explains, “Railroad workers’ complaints are similar to those of other employees who have threatened to walk out in the wake of the pandemic: They’re overworked, understaffed, and underpaid, and they’ve been operating without a contract for more than two years.” (more and more)
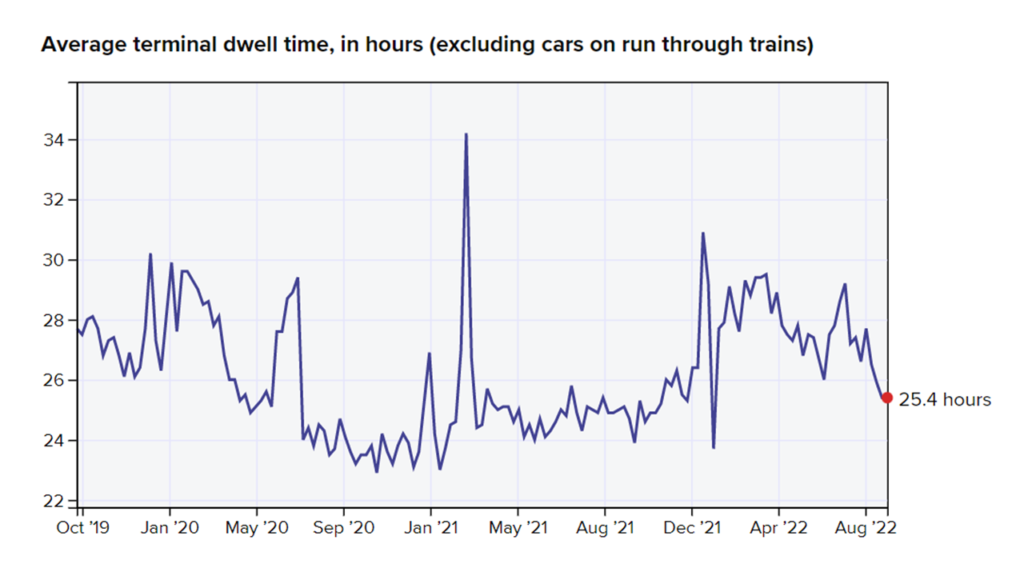
The United States Surface Transportation Board gathers significant near-time data on railway performance. Supply Chain Dive has created a visual dashboard that converts some of this data into comparative reports over time meaningful to the human mind. (An example below for BNSF through September 7.) Please see their railway performance dashboard. Many thanks to Matt Leonard and Nami Sumida.
September 12 Update: Nice overview of current railway flows and bottlenecks from Bloomberg (more and more).
September 14 Update: Very helpful breakdown of commodity impacts of the potential strike from S&P. Good overview of current status of negotiations from Reuters.
September 15 Update: Early this morning a tentative agreement was reached (more and more). Threat of an imminent strike has been avoided.