Category: Uncategorized

Just In Time, Just In Case, or just right?

JIT is taking plenty of punches. At recent conferences I have heard speakers accuse “Just in Time” of causing shortages of canned soup, diesel fuel, and baby formula.

A recent survey of 400 business decisionmakers by SAP found that almost two-thirds are moving from “just in time” supply chains to “just in case” supply chains featuring more stored inventory. An SAP executive explained, “Over the last couple of decades, the ‘just in time’ approach traded resiliency for efficiency and lower costs, which in turn made the supply chain fragile. The pandemic and the snowball effect of related disruptions exposed this fragility, which has organizations refocused on resiliency.”

Listening to those who blame JIT, I mostly hear complaints that contemporary supply chains have gone too far in reducing inventories. We need more stock in various back rooms they claim. This angle is especially emphasized by those pushing the so-called “Just In Case” approach.

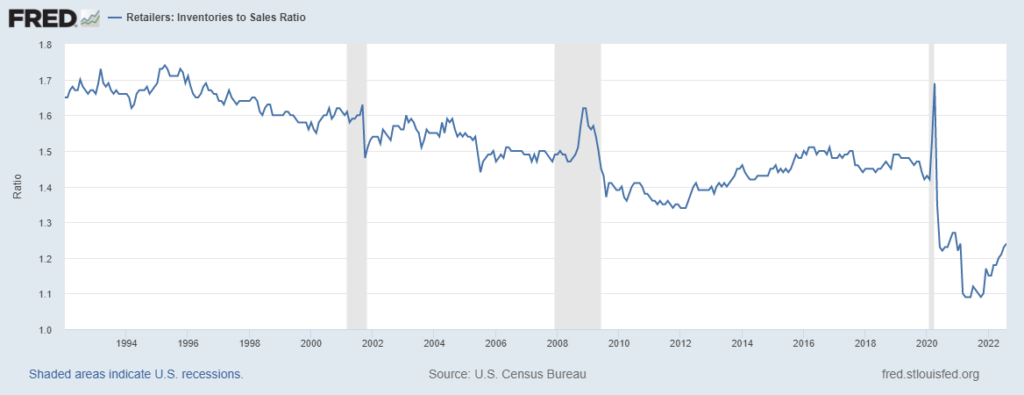
There is evidence for reduced inventories. According to US Census Bureau surveys (see chart below) prior to 2002 the ratio of retail inventory to sales was usually above 1.6 to one. Between 2002 and 2008 the ratio declined to about 1.5. After an inventory surge — also-known-as demand destruction — early in the Great Recession, the ratio fell below 1.4 before recovering to about 1.5 for most of 2015-2019.

Clearly these aggregated data can obscure significant product-specific variations (and tell us next to nothing about upstream stocks). But if you perceive (as I do) that JIT has been an increasingly common characteristic (aspiration) of contemporary supply chains, these data suggest that for the last two decades JIT has been roughly predisposed toward a 1.5 to 1.0 retail inventory to sales ratio. In other words, for every three units expected to be consumed there is a well-demonstrated tendency for two more units to be on the shelf or in the “back room” (and more are supposed to regularly arrive).

Not enough? Too much? If not enough, how much more should be stored just-in-case? Just in case of what? A sudden demand for one-fifth more than ever before (as some products experienced in March 2020). Losing one-fifth of production capacity (as with refining capacity between 2019 and 2021). A weeks-long loss of Mississippi River barge flows or Suez Canal container flows or a long-term rail strike or… name your threat. We have also seen that increased inventories increase financial and operational vulnerabilities in case of lost demand… as many US retailers have recently learned.

Just-In-Time is not — should not be — an inventory minimization strategy. That is a misleading goal and risky measure. JIT inventory management is one element in a whole-system process to better calibrate supply with demand. JIT is part of a flow optimization strategy — involving production, procurement, distribution, inventory, sales, consumption, and more — to better ensure delivery of what is needed, where it is needed, when it is needed, at a price that consumers can afford, and at a cost consistent with sustainable capacity.

The interplay of these variables can be treacherous. Failure to deliver what is needed when and where it is needed suppresses potential financial outcomes — and opens opportunities for competitors. Consistent failure to deliver what is needed will threaten the survival of the enterprise. Depending on the product, failure to deliver what is needed can threaten lives. Regularly delivering more than is needed wastes resources, increases overall costs, reduces potential financial margins, and diverts constrained assets — human, financial, operational, and more — that could be used to more effectively fulfill higher priority needs.

It is wasteful — and in many cases, practically impossible — to establish buffer stocks sufficient to fulfill high volume, high velocity demand in the aftermath of worst-case events (more). Blaming insufficient buffer stocks for pandemic-related supply chain challenges is analogous to blaming too few dining room chairs for problems in the kitchen (or grocery store or garden) or the arrival of sixty unexpected guests. The prescription is not to abandon JIT, but to ensure that whole-system planning and development deploy JIT disciplines to mitigate worst case risk. How this is done depends a great deal on the nature of each product and patterns of demand. There are, though, three strategic factors that — so far — I have found to be universally applicable.

Diversity of players and places across demand and supply networks enhances structural resilience. Avoid single points-of-failure. Instead of concentrating production or distribution or other throughputs in one place, invest in portfolios of critical capacity (more and more). Control related marginal costs through active management including strategic specifications, standardization, and interchangeability.

Distance is directly relevant to potential costs and time. Capacity closer to dense demand can mitigate possible delays and enhance supply velocity. But diversification still applies. Having all our eggs in any single henhouse (seismic zone or hurricane alley) amplifies the potential threat of the most unlikely fox.

Demand matters most. Too many supply chain decisionmakers watched demand crash between March and May 2020 and apparently could not see around the corner. Demand shifted dramatically, but did not disappear (see second chart below). The most successful firms understood their consumers (and suppliers) well enough to adapt to these shifts (and ongoing volatility). In many cases inventory ratios were suppressed by accelerated demand and higher sales. This is a happy problem.

Diversification of supply chain capacity will almost always involve marginal costs compared with maximized concentration. Proximity to diverse demand clusters will involve variable costs and some increased marginal costs related to labor rates, real estate, and other local conditions. Deep understanding of and creative engagement with demand emerges from sustained investments.

Non-resilience is also costly. In 2020 research by the McKinsey Global Institute found:

A single prolonged disruption can destroy half—or almost all—of a company’s yearly profits, depending on the industry. Based on those results and the probability of actual occurrences, we estimate that, on average, companies can expect disruptions to erase almost 45 percent of one year’s profits over the course of a decade. These are not distant future risks; they are current and ongoing patterns. On top of those losses comes the additional cost of rebuilding damaged physical assets, not to mention the risk of permanently losing market share to competitors that are able to sustain operations, recover faster, or seize on a crisis to innovate successfully.

Just In Time is a rational tactic that for seventy plus years has reduced wasted time and physical resources even as it has facilitated speedy, affordable fulfillment. As with any tactic JIT can be deployed strategically or stupidly. Stupid is as stupid does — too often the result of myopic management measures. Smart strategy requires an expansive sense of space, time, and behaviors. Trite but true (even if Sun-Tzu did not say it): Strategy without tactics is the slowest route to victory, tactics without strategy is the noise before defeat.

Improved equilibrium of demand and supply?

The October Consumer Price Index cooled. According to the Bureau of Labor Statistics, “In October, the Consumer Price Index for All Urban Consumers increased 0.4 percent, seasonally adjusted, and rose 7.7 percent over the last 12 months, not seasonally adjusted. The index for all items less food and energy increased 0.3 percent in October… up 6.3 percent over the year…”

The Wall Street Journal describes this morning’s report as, “the smallest 12-month increase since January 2022. The reading was down from 8.2% in September. June’s 9.1% inflation rate was the highest in four decades.” Several stock market indices jumped with joy at this news.

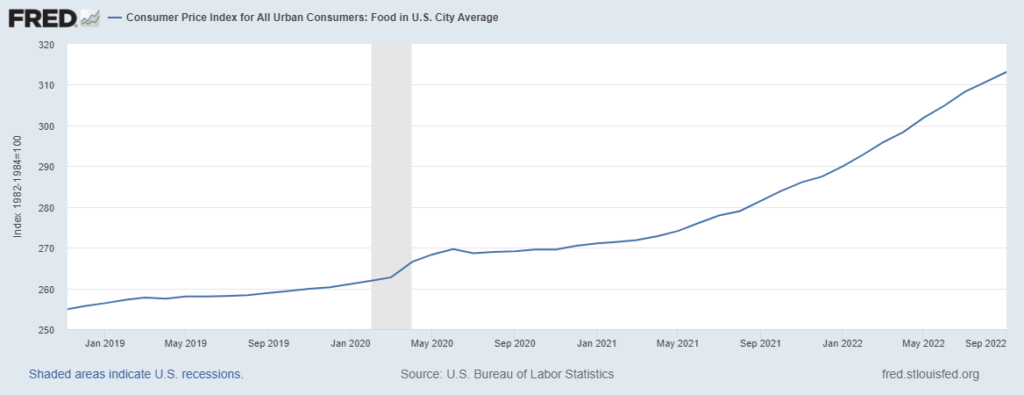
Specific to food (see chart below), the BLS reports:

The food at home index rose 0.4 percent in October, the smallest monthly increase in this index since December 2021. Four of the six major grocery store food group indexes increased over the month. The index for other food at home increased 0.9 percent in October, after rising 0.5 percent in September. The index for meats, poultry, fish, and eggs rose 0.6 percent over the month while the index for cereals and bakery products increased 0.8 percent in October. The index for nonalcoholic beverages rose 0.5 percent in October, after rising 0.6 percent last month. In contrast, the index for fruits and vegetables fell 0.9 percent over the month after increasing 1.6 percent in September. The index for fresh fruits fell 2.4 percent and the index for fresh vegetables fell 0.5 percent. The index for dairy and related products also declined in October, falling 0.1 percent.

As a supply chain guy my focus on inflation is rather narrow. I am mostly interested in what inflation suggests about the balance between demand and supply. Inflation signals an imbalance exists: there is more demand than capacity can currently fulfill and/or increased production/distribution costs are pushing retail prices higher. At some point persistent inflationary patterns will result in demand destruction.

As previously confessed (and complained about), I have been surprised that despite historically very high inflation, demand for Food-At-Home has remained well-above pre-pandemic levels even as Food-Away-From-Home purchases have fully recovered. Supply capacity for food (here and here) has incrementally increased, but remains challenged by consumer pull (here and here) that is elevated both nominally (as a result of inflation) and substantively (in terms of volume/value being consumed). Each month US consumers are continuing to spend at least 20 billion more inflation-adjusted dollars on food beyond pre-pandemic trends (this is much closer to trend than in January 2022, but still surprisingly high… seems to me).

Given the limits of wage-growth and the savings rate, I don’t see how this level of food demand can be sustained. I am not alone in this judgment, which is one of the reasons that food manufacturing capacity has not filled the gap. Sooo… to move closer to equilibrium, demand needs to decline just a bit more. Today’s CPI can be read to imply this is happening. The Personal Consumption Expenditures report later this month will be more directly informative.

Der Krieg ist eine bloße Fortsetzung der Politik mit anderen Mitteln

[Update Below] S&P Global has, once again, delivered a helpful visualization of the intended (likely? possible?) outcomes of G7 price caps on Russian oil and refined products (see below). S&Ps analysis and commentary highlights ambiguities, especially for shipping markets and related insurers. In any case, this is a further deployment of financial markets and mechanisms to make it more difficult for Russia to continue its war against Ukraine. Since the February 24 invasion, the G7 nations — Canada, France, Germany, Italy, Japan, United Kingdom, and United States (and EU) — have closely coordinated sanctions on Russia. According to an October 11 G7 statement, “We have imposed and will continue to impose further economic costs on Russia, including on individuals and entities – inside and outside of Russia – providing political or economic support for Russia’s illegal attempts to change the status of Ukrainian territory.” These actions are part punishment, part constraint, part setting the stage for future negotiations. Echoing Clausewitz (title’s German phrase ), this too is a “continuation of policy by other means” — perhaps two steps removed from direct violence. (More and more and more)

+++

November 29 Update: The Financial Times delivers a very helpful “Big Read” on prospects for the price cap on Russian oil, with considerable attention to implications for network structures. S&P offers a skeptical angle on the entire effort.

Diesel’s dance with demand

[Update Below] Global refining capacity is very tight (more). Most North American and European refineries are just fulfilling demand by operating at well-over 90 percent capacity. The most significant current concentration of “excess” capacity is in China — which is producing about one-third below capacity (perhaps 18 million barrels per day) due to its domestic economic slowdown (and is not, in any case, organized to export significant flows of refined fuels).

Disrupted flows of Russian crude have complicated refining operations in Europe. Impending constraints on Russian refined product have complicated fulfilling current demand. Recent strikes at French refineries reduced EU fuel inventories, raised prices, and caused spot shortages. Nigeria’s new Dangote refinery has suffered several delays in opening. New capacity in the Persian Gulf and East Asia is not scheduled to begin production until late 2023 or beyond.

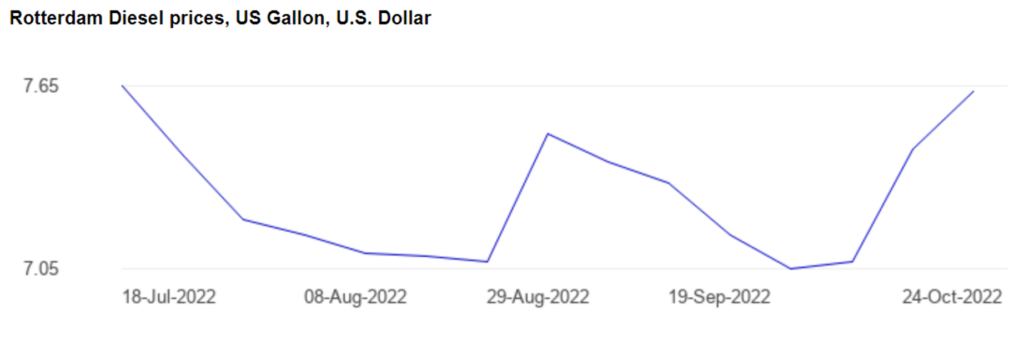
The United States is exporting diesel at volumes not seen since pre-pandemic (see first chart below). Latin America has long been a significant consumer of US refined products, especially from US Gulf Coast refiners. This year European demand for US diesel has surged (more and more). Since Russian flows have been disrupted, there has been a particular tug-of-war between diesel demand (and prices) at New York Harbor and Amsterdam-Rotterdam-Antwerp (see second and third charts below). Depending on week-to-week differentials, NYH can still attract diesel flows that would otherwise serve diesel-thirsty Europe. Volatility has been the most discernable pattern (more).

This volatility is reinforced by a structural feature of fuel networks serving the the US east coast — and especially the mid-Atlantic (say, New York to Norfolk). From Maine to Florida (PADD 1) there are only seven operational refineries with total capacity barely above 800,000 barrels per day. Total consumption along the Atlantic is typically more than 7.5 million barrels per day. A big part of the difference is filled by 2.5 to 3 million barrels per day of refined product transported from Texas and Louisiana by the Colonial Pipeline. Another 700,000 barrels per day of Gulf Coast product is carried by the Plantation Pipeline. Maritime deliveries to Florida of about 840,000 barrels per day originate with the same Gulf Coast sources. About 1 million barrels per day of refined product imports serve the east coast, mostly from Canada and OPEC.

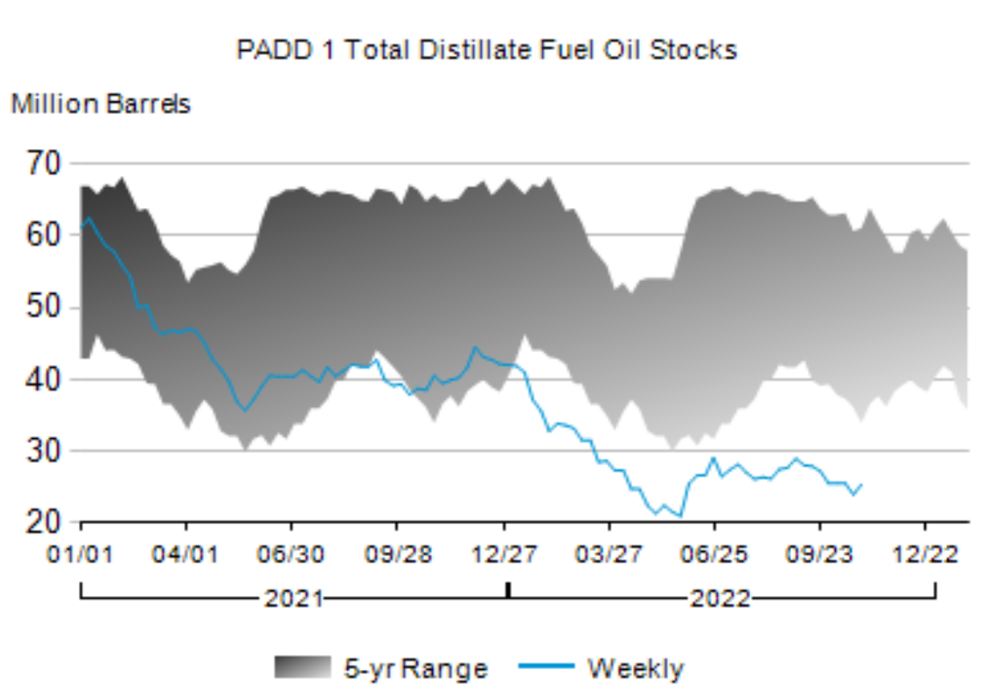
This gives Gulf Coast refiners plenty of sales options: Rio, Rotterdam, Riga, and really wherever. Since the Russian invasion of Ukraine there have been plenty of days when non-US consumers were ready to pay way more for Gulf Coast diesel than prices being paid where the pipeline ends near New York Harbor (more). Especially when pipeline capacity is fully allocated, there is a clear incentive to sell where margins are best… and, supposedly, where demand is most desperate. But this also means that East Coast diesel inventories — already suffering late-pandemic anemia — have not been restocked even as pre-pandemic demand patterns re-emerge (here and see final chart below). On a proportional basis diesel stocks are equally low or even lower in Amsterdam-Rotterdam-Antwerp and Singapore than in the United States.

If recent global diesel demand persists, it is unlikely that East Coast diesel stocks will be refilled any time soon (despite the increase last week). If US Gulf Coast refineries continue to operate at 90 percent or better capacity, the Colonial and Plantation pipelines are likely to be fully allocated through this winter. If so, East Coast inventories will probably not see materially deeper deficits per the five year range. If the US economy slows and diesel demand declines, recovery in regional diesel stocks becomes more likely.

+++

November 10 Update: According to Reuters, “U.S. gasoline stocks were down by 900,000 barrels in the week to 205.7 million barrels, the EIA said, compared with analysts’ expectations in a Reuters poll for a drop of 1.1 million barrels. ​Distillate stockpiles, which include diesel and heating oil, fell by about 500,000 barrels, a smaller-than-expected decline.” Here’s the baseline data from the Energy Information Administration’s Weekly Petroleum Status Report. Nice overview of diesel prices and prospects by the New York Times.

Channels tend to persist

Russia said it would no longer participate in the Black Sea Grain Initiative, accusing Ukraine of using the export corridor to cover attacks on Russian naval assets. Despite this Saturday announcement, bulk cargo ships have continued to depart Ukraine’s designated ports (see map below) and inspections have continued consistent with the UN-Turkey brokered agreement. According to Ukraine, on Monday, October 31, 354,500 tons of agricultural products were extracted through the corridor. (Even more quickly than usual? Many more ships departed than arrived.) When commodity markets opened on Monday, trading volumes surged and so did prices (see chart below)… before softening late in the trading day. Today, November 1, early trading on December wheat has opened lower (but then moved up about 2 percent, more and more and more and more and more). [November 2 Update: UN and Ukrainian sources indicate eight vessels are expected to transit the grain corridor on November 3 (more and more). Later on November 2: Never mind, Putin says Russia will resume its participation in the Black Sea Initiative… four more vessels departed with grain… Wheat futures fell… (more and more).]

Bottlenecks persist, chokepoints shift

Concentrated capacity is a key feature of contemporary demand and supply networks. Well-designed bottlenecks enhance the speed, accuracy, and cost-efficiency of flows. But beautiful bottlenecks can become troublesome chokepoints, especially when demand is volatile or exogenous impediments emerge (e.g., natural disasters, government interventions, war…)

Here are three current examples: 1) Black Sea grain flows, 2) Gulf of Cadiz LNG flows, and 3) San Pedro Bay off Los Angeles.

The Black Sea Grain Initiative has been much more successful than I expected. Sustained demand has not surprised me. Prices have been bouncy, but comparatively higher. The level of Russian cooperation has surprised me. The risk-readiness of grain carriers has also surprised me. In recent weeks Russian cooperation has ebbed even as world demand and carrier readiness has, if anything, escalated. The outcome, according to the United Nations, is “There are currently over 150 vessels waiting around Istanbul to move and these delays have the potential to cause disruptions to the supply chain and port operations.” (See map below.)

Strong demand to build European winter inventories of natural gas resulted in higher prices that attracted more flows. Recent warm weather has reduced typical demand for autumn residential heating and a combination of an economic slowdown and high prices has reduced industrial demand for energy. LNG prices have fallen. Sooo… according to Reuters and others, “several” LNG vessels are anchored or cycling off European LNG ports. (See map below) “They are waiting for higher prices. If one single idling vessel discharges its cargo, the price will immediately collapse by affecting the other cargoes on the queue and this domino effect is so painful in terms of opportunity cost.”

Meanwhile, last week the Wall Street Journal reported, “The backup of container ships off Southern California’s coast that was at the heart of U.S. supply chain congestion during the Covid-19 pandemic has effectively disappeared.” In January there were over one-hundred vessels waiting to dock at LA or Long Beach. More recent queues are in the single digits. The Journal explains, “U.S. import volumes are declining, according to trade data analysts, and a growing share of the shipments are heading to ports on the East and Gulf coasts as importers ship away from the Southern California backup.” Reduced demand (here and here) and agile velocity

Constraints on preexisting push cause price increases. Higher prices tend to pull more flow, which will increase congestion unless a way is found around the constraints or to fix the constraints. These three examples — at least so far — suggest that when 1) demand is more need-based than want-based and 2) need-based demand can be effectually expressed (when pull can afford to pay the price), that flow will find a way to connect supply with demand. Exceptions have been seen and can easily be imagined. But the power of pull should not be under-estimated.

Black Sea grain flows (and congestion)
Gulf of Cadiz LNG flows (and congestion)

Agile Velocity

Supply Chain Management is different than logistics. Logistics is a crucial component of Supply Chain Management. But compared to 5000-plus years of logistics, contemporary Supply Chain Management is much more able — and agile — targeting when and where and how flows are organized around demand. Supply Chain Resilience often depends on this agility.

A good example of this was briefly outlined in yesterday’s (October 25) ADM analyst call on Third Quarter earnings:

Tom Palmer (Analyst with J.P. Morgan)

I wanted to ask on the barge delays on the Mississippi River. Does this have much effect on your business as we look towards the fourth quarter? Is it — if there is impact, should we mainly think about it being in Ag Services, or just given the diversity of your business, are there offsets to consider?

Juan Luciano (CEO of ADM)

Yes. Of course, we have an unprecedented situation and especially in the Lower Mississippi River that will reduce the volume of exports for Ag Services North America. As it’s going to be a negative impact in Ag Services North America, of course, that — part of that is because of soy and we’re going to lose that volume. In the corn side, we’re probably going to extend the window of exports from North America into the first quarter. So part of the offset is you’re going to see that in the first quarter. I think also part of the offset is South America will be able to export more. We are a large exporter in South America, of course, and you’re going to see that.

And then normally, what we noticed or we expect to happen because we’ve seen it before, is when you export less from North America, where destination marketing sometimes get a little bit of a pop in margins, the products and destination become naturally more valuable, if you will. That was part of the original strategy of going into destination marketing. And then, the other impact is that as beans are not exported that matters not that much demand, local values come down, local bases come down and that may be a boost for crush that you may be able to crush lower-priced beans or maybe eventually lower-priced corn for Carbohydrate Solutions. So, we see some puts and takes. So probably negative for North America Ag Services and Oilseeds, maybe neutral for Ag Services and positive overall maybe for the whole.

My interpretation: Given current constraints on Mississippi barge traffic, ADM’s ability to export US soybeans is constrained. As a result, the company anticipates exporting a higher volume of South American soybeans than usual. By adapting available sources and channels, “destination market” demand for soy will be fulfilled (probably at slightly higher margins than otherwise). Because of current capacity to store the US corn harvest, these exports can be delayed until US river levels recover. US domestic flows not exported will be redirected to US domestic processing, perhaps with slightly better margins for ADM, slightly poorer margins for grain producers.

Sooo… by agile management of product flows across extended time and space, ADM can still fulfill high volume near-term demand despite chokepoints that have emerged. Logistical constraints are mitigated by creatively engaging the global “watershed” of supply to fulfill specific demand.

Global Fuel Flows

[Updates Below] Europe’s need to replace lost Russian energy supply has discombobulated markets, channels, and global flows. Nervous demand wants to pull more energy than long neglected and currently disrupted fossil fuel capacity can confidently — affordably — fulfill (more and more and more and more and more).

As a result of Europe’s precipitous pull on non-traditional channels (skewed by the prospect of a war-time winter) fuel prices are higher — which limits the ability of demand to pull much harder. European uncertainty regarding the ability to pull sufficient flows to fulfill minimum social and economic needs is a principal cause of global energy price volatility.

Given China’s zero-covid policies (more, and strengthened statism), Europe’s recession, and an induced counter-inflationary US economic slowdown, net global demand for energy is likely to remain off-peak for months ahead. But local shortages and price surges are also likely as mostly fixed capacity tries to adapt to (and exploit) the turmoil resulting from Russia’s invasion of Ukraine — and all its cascading consequences.

With care the behavior of this complex adaptive system can be broadly anticipated. It cannot — will not — be precisely predicted. In a personal effort to perceive emerging strategic context, I will give recurring attention to:

Frankfurt, Germany’s temperature (more and more, see below). This may be a meaningful indicator of energy demand in Europe’s densely populated industrial heartland.

Liquified Natural Gas (LNG) price futures, especially at Rotterdam (Dutch TTF, see below) and in comparison to the US Henry Hub. LNG constitutes a significant replacement proportion for lost Russian natural gas flows. Higher prices will signal supply falling below demand and/or fear of insufficient supply (more and more).

Diesel price futures, especially comparing Amsterdam-Rotterdam-Antwerp (ARA, see below) to New York Harbor ULSD. Even if LNG flows mostly match lost natural gas flows, there are myriad potential energy gaps. Diesel is a flexible gap-filler. But low diesel inventories and limited production capacity may be unable to close some crucial gaps (more and more).

Taken together these sources may provide early warning signals in terms of shifting directional balances between global demand and supply (admittedly with a trans-Atlantic bias).

+++

October 25 Update: Nice summary of immediate petroleum market realities from Bloomberg. Below is an Infographic from S&P Global that clearly complements the situational assessment I offered on Monday morning.

October 26 Update: Very helpful summary by S&P Global of the significant shifts in global demand for LNG as a result of Europe’s need to replace Russia’s pre-war supply of natural gas.

November 4 Update: Warm temperatures, less-heated economic behavior, full storage tanks, and better-than-expected supply have continued to suppress Europe’s immediate thirst for LNG. More than thirty LNG vessels are cycling off Europe waiting for prices to increase — some are even giving up and heading toward Suez searching for better markets farther east. EU access to LNG-alternatives — such as here and here — are watched almost as closely as the weather.

Global Food Flows

Demand is strong. Supplies are disrupted, but — so far — sufficient. Prices are comparatively high, but not as high as earlier this year. The September Food and Agriculture Organization’s cereal production forecast is close to the high end of the last decade’s volumes, but slightly less than last year (see charts below, more and more).

Several key channels for shipping food are constrained. Black Sea flows are limited by war, but since July an agreement brokered by the United Nations and Turkey has facilitated 285 shipments from Ukrainian ports carrying 6,429,098 metric tons of grains and other foodstuffs. (The current agreement will sundown in November unless renewed.) Canada’s rail capacity is struggling to deliver the flow needed for a strong harvest. Significant drought in both the Danube and Rhine River basins has reduced yields, complicated barge transport, and reduced supply velocity. The Yangtze River is also running very low (more). In recent weeks there have been more low-water closings than usual on the Mississippi River. Urgent dredging has been required to reopen flows. (To be sure, extreme weather is an equal-opportunity threat: floods have complicated commodity flows in Australia, Pakistan, and Thailand).

Food demand is often constrained by the consequences of a very strong US dollar. In more affluent nations, such as the United Kingdom and Japan, the cost of food imports, often priced in dollars, has increased substantially over the last six months. In less affluent nations, such as Lebanon and Sri Lanka — with sparse dollar reserves — the ability to pay is being tightly squeezed or exhausted (more and more).

In 2022 enough food is being produced to feed the world’s population. But production patterns are becoming less predictable as climate change accelerates and production costs increase (more). Sufficient distribution capacity exists, but is vulnerable to a wide variety of potential disruptions. Distribution capacity is especially shallow and fragile where the ability to express effectual demand — in other words, the ability to pay market prices — is weakest. According to some credible sources, of almost 8 billion residents of the planet, about four out-of-ten cannot currently afford to purchase a healthy diet.

US food demand remains elevated

[Update Below] According to the Federal Reserve, Americans continue to purchase food-at-home well above pre-pandemic patterns. In August 2019 US consumers expended $999.1 billion on groceries and related. This August we spent $1028.5 billion. (These are each chained 2012 dollars, see chart below). For further comparison, in August 2012 we spent $845.7 billion. The US population increased about seven percent over these ten years.

This higher demand has persisted even after we returned to restaurants and other food-away-from-home services in Spring 2021. In August 2019 Americans spent $65,191 million at food services and drinking places. This August we spent $86,760 million (not inflation adjusted, here you can see comparable grocery retail sales). Our personal savings rate in August 2022 was less than half that in August 2019.

Another angle on food consumption is offered by the research and consulting firm IRI which finds current cash-basis demand in early October 2022 to be at least seven percent above October 2021 — thirteen percent higher in the “general food” category. As a result, after several weeks of improved demand-supply equilibrium, stock-outs are, again, beginning to proliferate and deepen.

There has been a softening of inflation-adjusted grocery expenditures since January (again, see the chart below). This is probably the result of historically very high food inflation plus reduced cash reserves. But especially given the persistent disincentive of inflation, for food demand to still be at least three percent above pre-pandemic trend has material implications for production and distribution capacity — and therefore flow.

In June I offered the following:

I hypothesize that between May and September we will see food-at-home real consumption gradually decline by another seven to ten percent and then flatten or incrementally increase. I hypothesize that durable goods and services will begin to show slopes similar to 2022 food consumption. I also hypothesize a more rapid rate-of-change than that for food between last November and April. 

With two months of data left to ingest, we have barely seen a one-percent decline in food-at-home consumption. Durable goods spending has been stable. Real services spending has continued to incrementally increase. Given my perception of actual need and inflationary disincentives interacting with economic and geo-political risk, I expected much more consumer restraint to emerge by now. If anything the opposite is true (more and more).

From May 2021 until August 2022 US wage growth was not only consistently higher but the rate of growth was increasing too. Last month’s wages (September) were still growing, but at a slightly slower rate. So — maybe — with more nominal cash flow many American consumers have chosen to avail themselves of “retail therapy” and comfort food to manage accumulating stress. This is not a satisfactory explanation, but it is the best I have right now.

+++

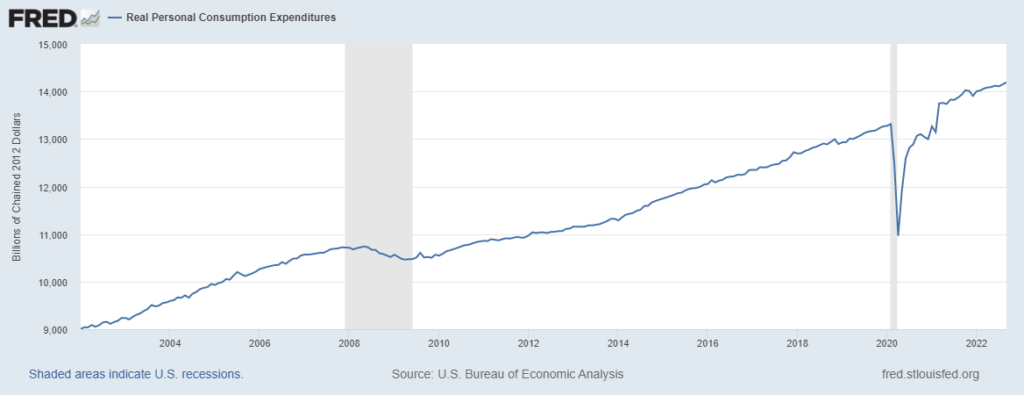
October 29 Update: Based on September’s real Personal Consumption Expenditures (see chart below), since the end of April constant dollar (inflation adjusted) expenditures on food-at-home have declined from $1,036.4 billion to $1,022.4 billion — or 1.4 percent. Real durable goods spending in September was basically flat. Expenditures on services, even in the most discretionary categories, seem very stubborn — much more stubborn than I expected.