The US grocery supply chain continues to close the gap between demand and supply.
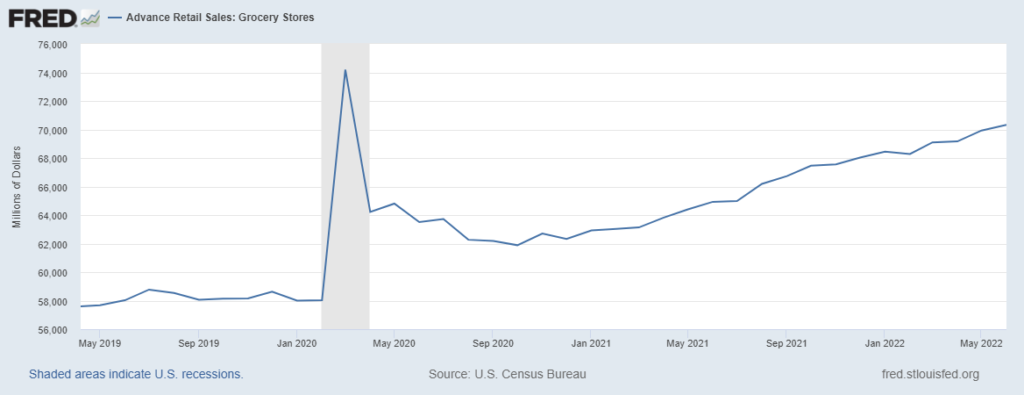
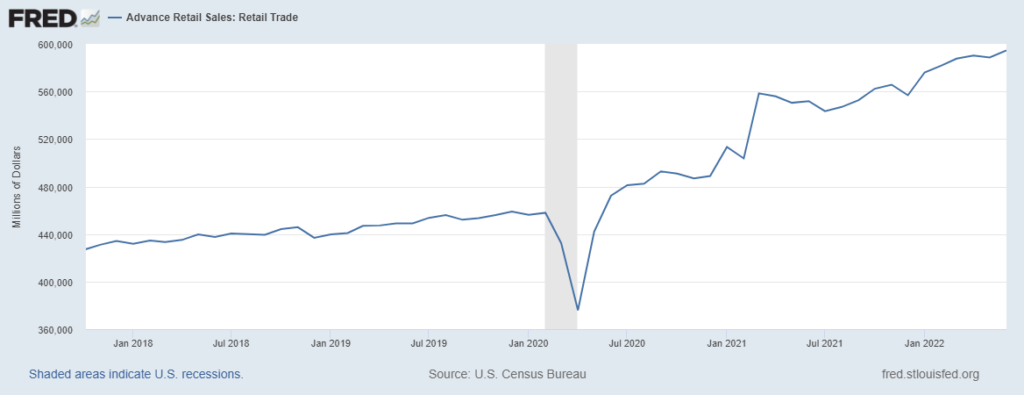
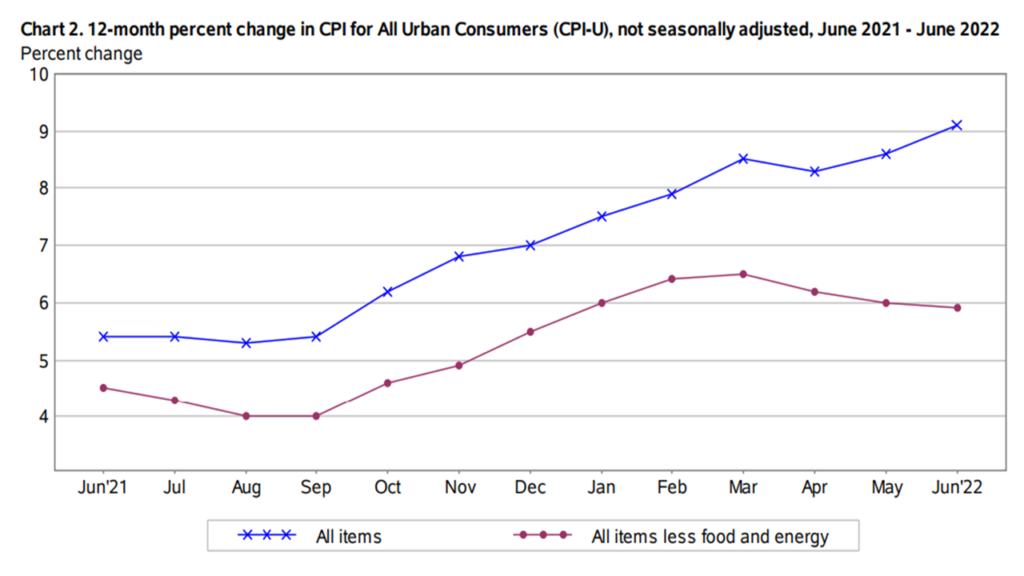
Despite (and because of) high food inflation and plenty of competition for spending (e.g. eating out and travel), in June US consumers spent almost one-fifth more on groceries than in June 2019 (see first chart below). Inflation-adjusted spending is flat or incrementally down, but Americans are still buying many more calories (not just spending many more dollars) than pre-pandemic (more and more and more).
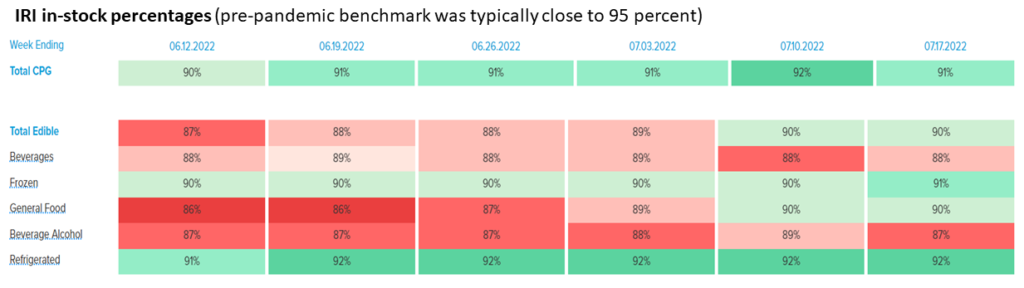
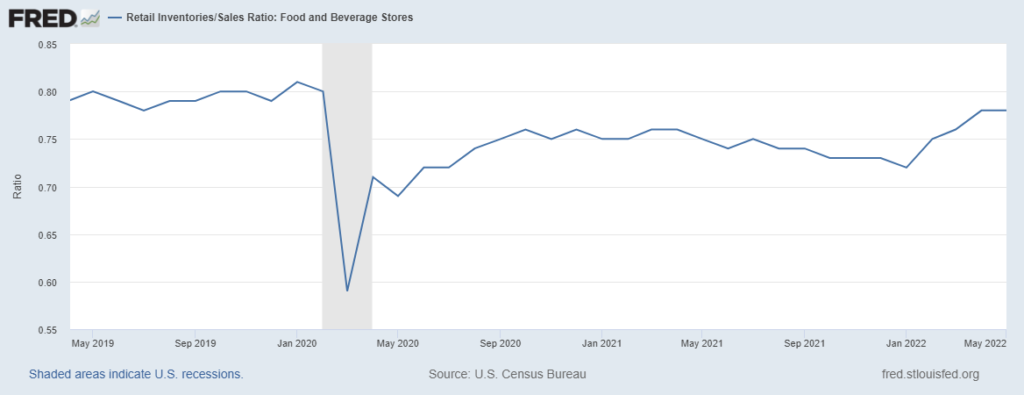
Despite this very strong pull, push is catching up. According to IRI, there are now fewer stock-outs than earlier this year (see second chart below. Since January there have been improving inventory levels for grocery stores (see final chart below). We are now very close to parity with 2019 grocery inventories. These are May numbers from the US Census survey. Based on what I have heard from grocery distributors, I bet the inventory to sales ratio further improved in June and July (more).
For my friends in the grocery industry — and for general economic reasons — I am glad that we have not seen significant demand destruction for groceries as inflation and spending-competition increase. I will also confess: such persistent pull so much higher than pre-pandemic surprises me. The response by production, distribution, and retail players has been creative, risk-taking, and — as demonstrated by the numbers — effective.