In today’s Financial Times, Rana Foroohar outlines the supply chain challenges involved in “too much power in too few hands.”
Unfortunately the FT has a fierce paywall, so here’s what I perceive to be the crucial paragraph:
Chinese mercantilism, European and US corporate price gouging, American Big Tech and Too Big To Fail banks are really all disparate parts of one problem — too much concentration of power in one place. This leads to market fragility, less innovation (which tends to come from smaller companies and more, rather than less, competition), security concerns and defensiveness on the part of states that worry they could be cut off from crucial supplies.
I agree with Ms. Foroohar’s assessment, admire her concise argument, and am even prepared to embrace her recommendations.
She and I may be less well-aligned on causes and corrections (this requires some reading between the lines). I hear Ms. Foroohar emphasizing human intention in creating these increasingly concentrated connections. In contrast, I perceive this sort of clustering, cascading, and intensification as innate to high volume, high velocity networks. Human intention less often drives concentration risk than is just along for the ride. Rather than masterful creators, we are more typically unindicted co-conspirators.
Where human intention and creativity can be quite influential is much more in the mindful, proactive, systematic, anticipatory mitigation of concentration risks. This is uncommon.
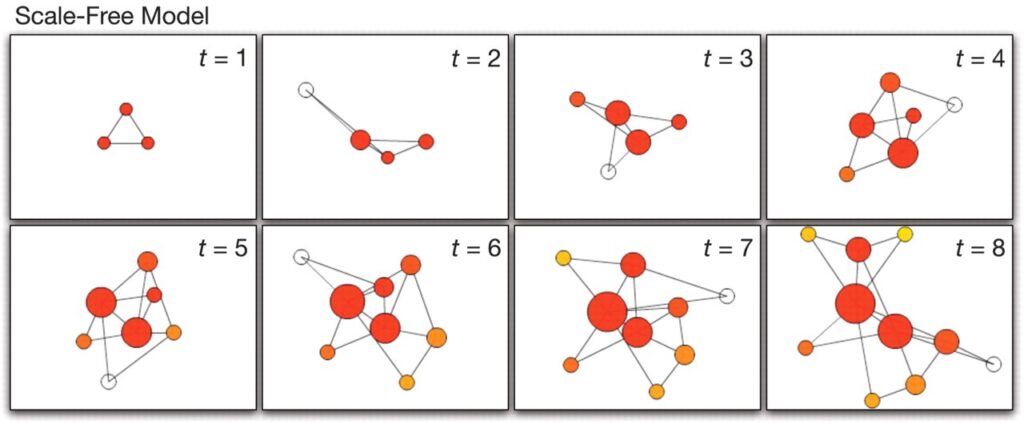
Scale Free Networks from Science (2009)