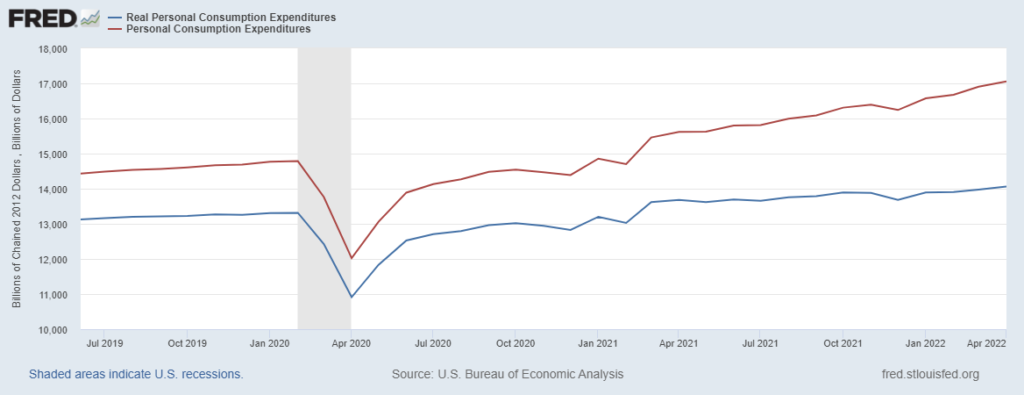
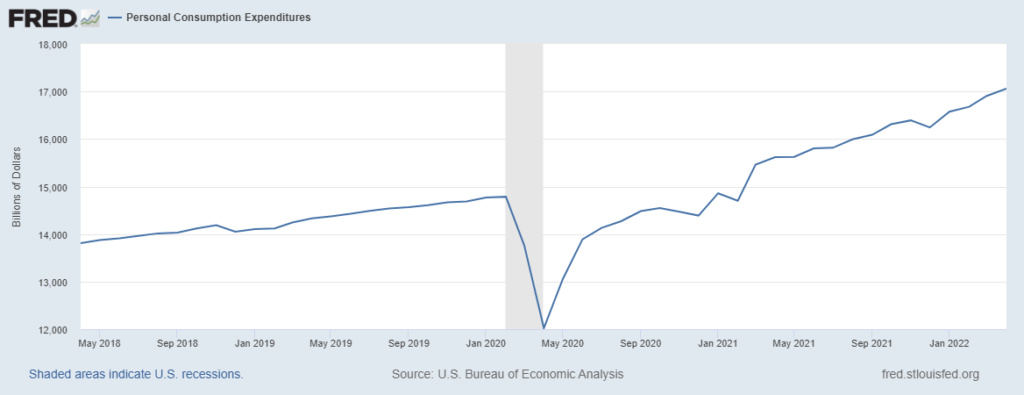
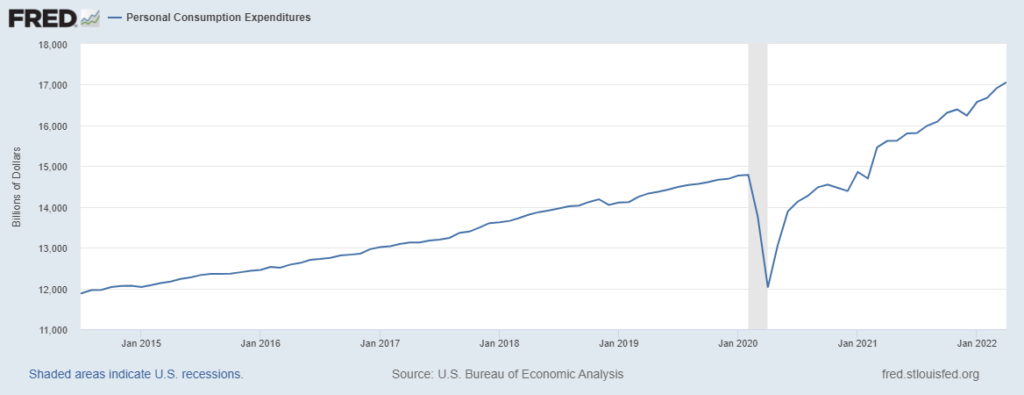
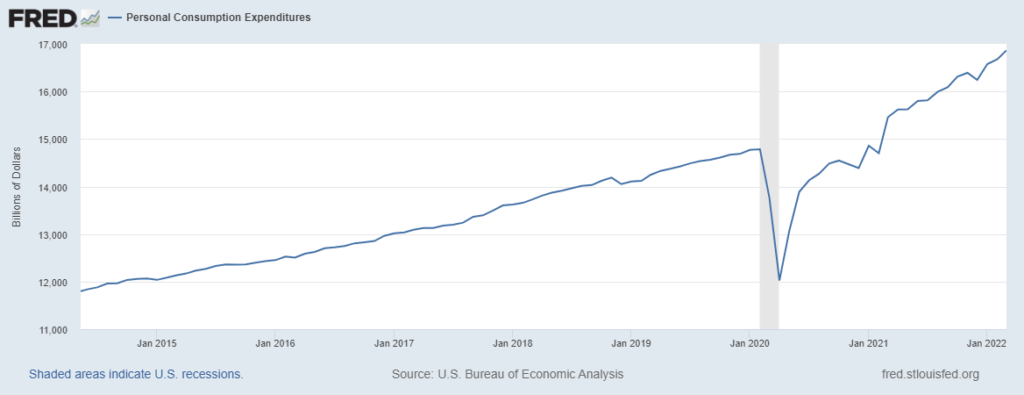
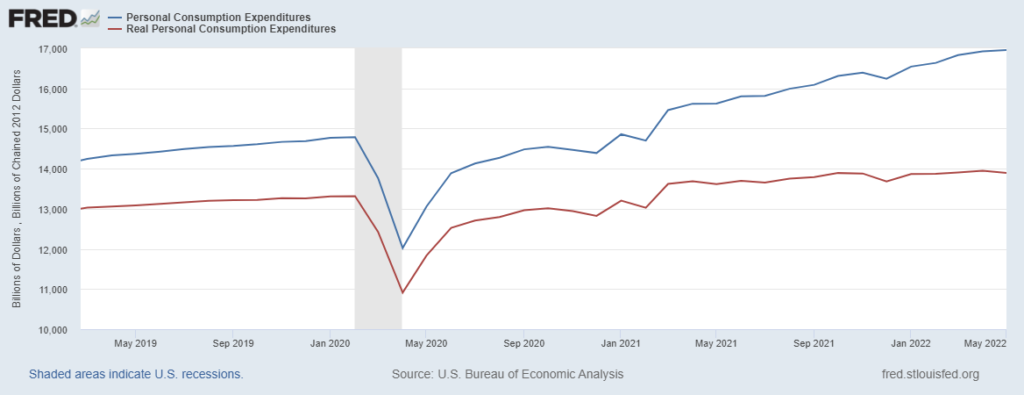
This morning’s report on May Personal Consumption Expenditures finds an increase in nominal spending that flattens considerably when adjusted for inflation. See chart below, blue is nominal, red is real. The absence of much real growth since about October should not obscure the almost six percent growth since May 2019. That pre-pandemic moment was widely considered a healthy economy. Even with fuel, food, and other inflation, the current pattern still suggests a robust US economy. Deacceleration and gradual de-escalation of demand should also constrain inflation. From a narrow supply chain perspective we are getting closer and closer to equilibrium.
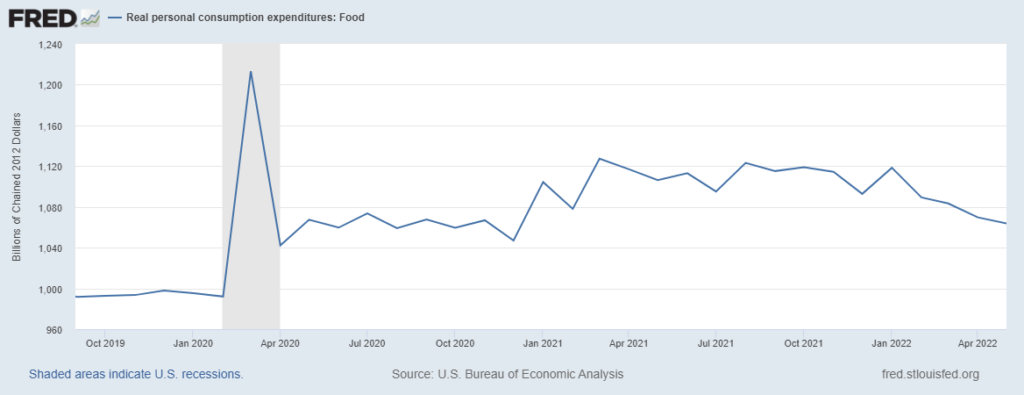
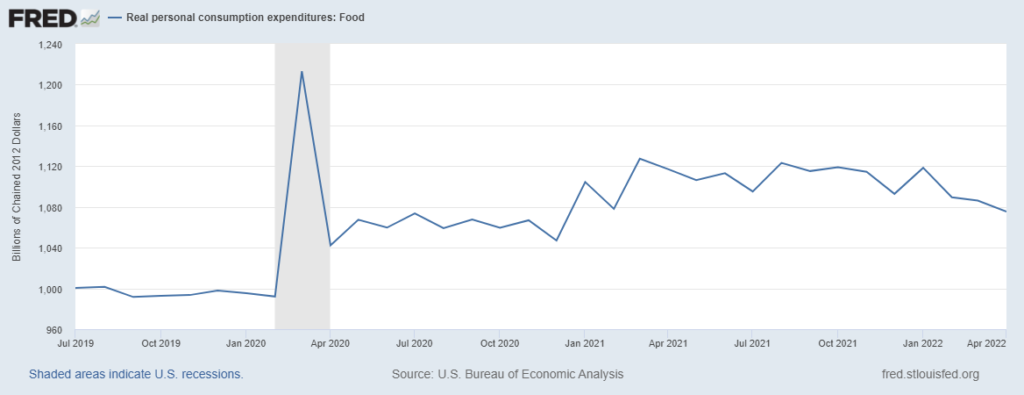
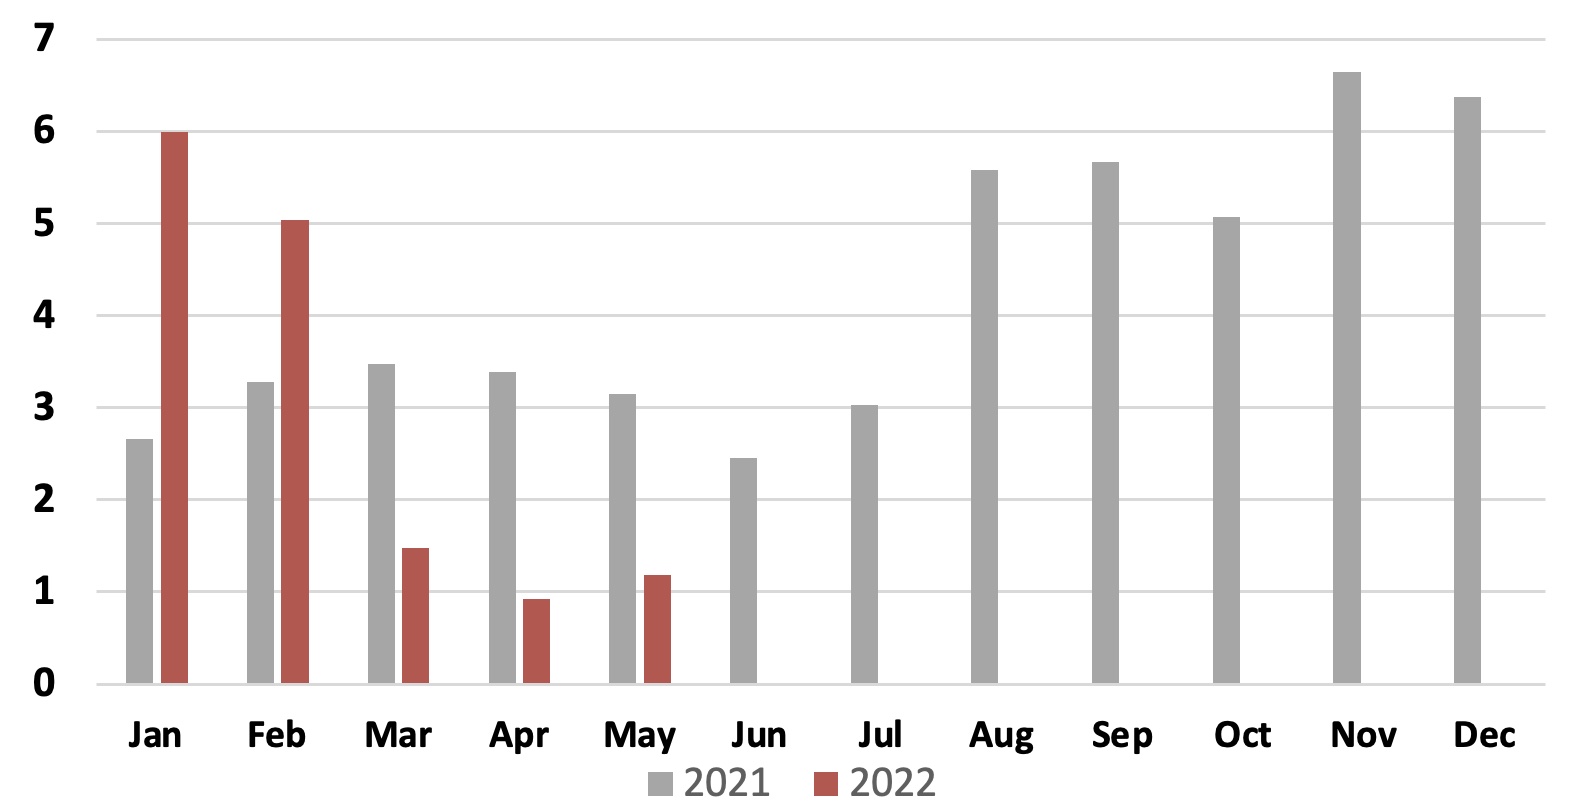
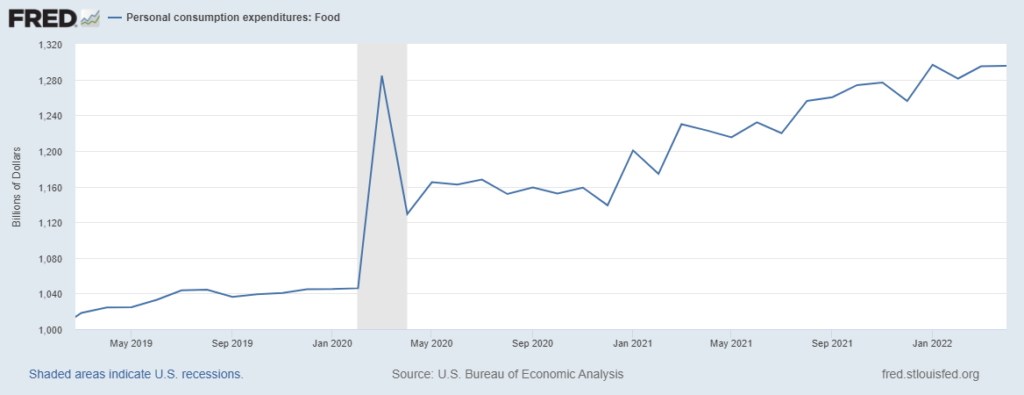
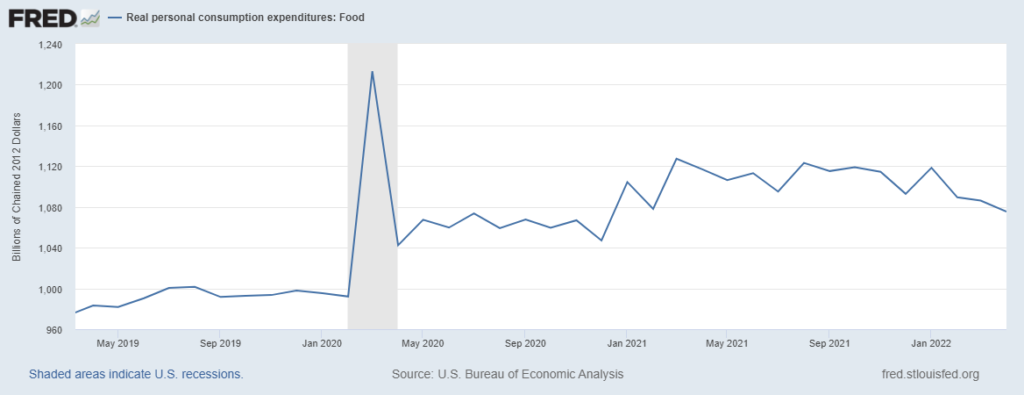
Last Saturday I hypothesized, “that between May and September we will see food-at-home real consumption gradually decline by another seven to ten percent and then flatten or incrementally increase. I hypothesize that durable goods and services will begin to show slopes similar to 2022 food consumption. I also hypothesize a more rapid rate-of-change than that for food between last November and April.” According to the May PCE, real personal consumption expenditures for food fell 0.99 percent between April and May. It has fallen five percent since January. See chart below. Real expenditures on durable goods also fell between April and May. Services expenditures slightly increased. It is too early to say anything about rate-of-change.